| Param | Original file | Final file |
|---|---|---|
| Filename | modeM0/AS1T03_244T01_9000003912_27127cztM0_level2.evt | modeM0/AS1T03_244T01_9000003912_27127cztM0_level2_quad_clean.evt |
| Size (bytes) | 633,116,160 | 93,168,000 |
| Size | 603.8 MB | 88.9 MB |
| Events in quadrant A | 4,118,907 | 615,303 |
| Events in quadrant B | 3,794,856 | 624,769 |
| Events in quadrant C | 3,227,255 | 609,368 |
| Events in quadrant D | 7,611,821 | 536,793 |
| Mode M9 | |||
|---|---|---|---|
| Quadrant | BADHDUFLAG | Total packets | Discarded packets |
| A | 0 | 13 | 0 |
| B | 0 | 14 | 0 |
| C | 0 | 14 | 0 |
| D | 0 | 14 | 0 |
| Mode M0 | |||
|---|---|---|---|
| Quadrant | BADHDUFLAG | Total packets | Discarded packets |
| A | 0 | 16421 | 0 |
| B | 0 | 15151 | 0 |
| C | 0 | 13303 | 0 |
| D | 0 | 26838 | 0 |
| Quadrant | Total seconds | Saturated seconds | Saturation percentage |
|---|---|---|---|
| A | 6225 | 139 | 2.232932% |
| B | 6224 | 204 | 3.277635% |
| C | 6224 | 84 | 1.349614% |
| D | 6224 | 1200 | 19.280206% |
Noise dominated data is calculated using 1-second bins in cleaned event files. If a bin has >2000 counts, and if more than 50% of those come from <1% of pixels, then it is considered to be noise-dominated and hence unusable.
| Quadrant | # 1 sec bins | Bins with >0 counts | Bins with >2000 counts | High rate bins dominated by noise | Noise dominated (total time) | Noise dominated (detector-on time) | Marked lightcurve |
|---|---|---|---|---|---|---|---|
| A | 7505 | 6226 | 103 | 103 | 1.37% | 1.65% | 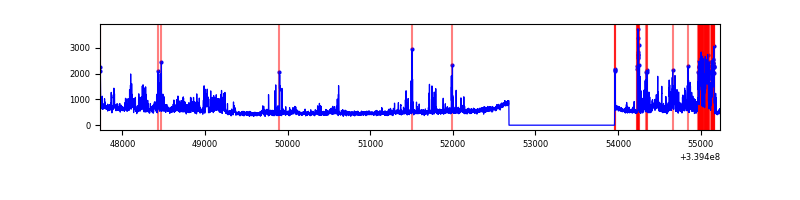 |
| B | 7504 | 6225 | 137 | 137 | 1.83% | 2.20% | 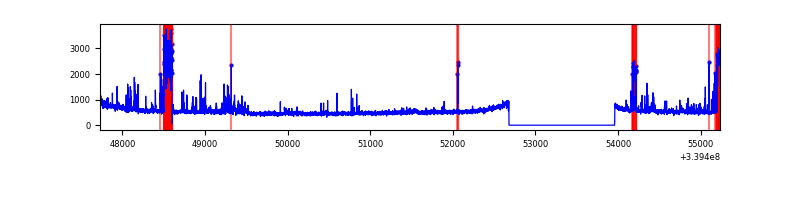 |
| C | 7504 | 6225 | 0 | 0 | 0.00% | 0.00% | 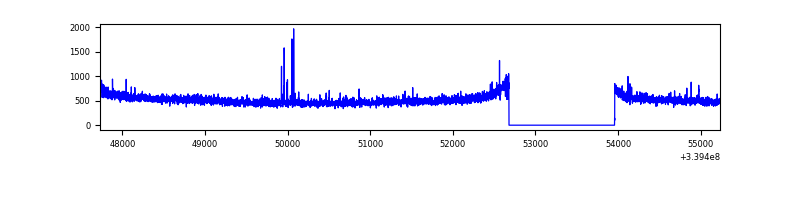 |
| D | 7504 | 6225 | 1221 | 1221 | 16.27% | 19.61% | 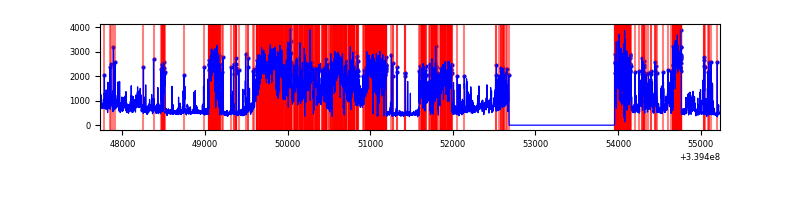 |
Top three noisy pixels from each quadrant. If the there are fewer than three noisy pixels in the level2.evt file, extra rows are filled as -1
| Pixel properties | Quadrant properties | ||||||
|---|---|---|---|---|---|---|---|
| Quadrant | DetID | PixID | Counts | Sigma | Mean | Median | Sigma |
| A | 6 | 16 | 636988 | 4027.05 | 802 | 787 | 158.0 |
| A | 14 | 235 | 274115 | 1730.12 | 802 | 787 | 158.0 |
| A | 13 | 248 | 72810 | 455.89 | 802 | 787 | 158.0 |
| B | 10 | 245 | 461887 | 3086.44 | 796 | 778 | 149.4 |
| B | 7 | 205 | 76255 | 505.21 | 796 | 778 | 149.4 |
| B | 0 | 189 | 42460 | 279.0 | 796 | 778 | 149.4 |
| C | 14 | 238 | 126687 | 684.17 | 785 | 793 | 184.0 |
| C | 2 | 16 | 30825 | 163.21 | 785 | 793 | 184.0 |
| C | 15 | 208 | 11949 | 60.63 | 785 | 793 | 184.0 |
| D | 1 | 52 | 3911303 | 20511.72 | 730 | 716 | 190.7 |
| D | 7 | 38 | 659224 | 3453.99 | 730 | 716 | 190.7 |
| D | 2 | 250 | 192009 | 1003.36 | 730 | 716 | 190.7 |
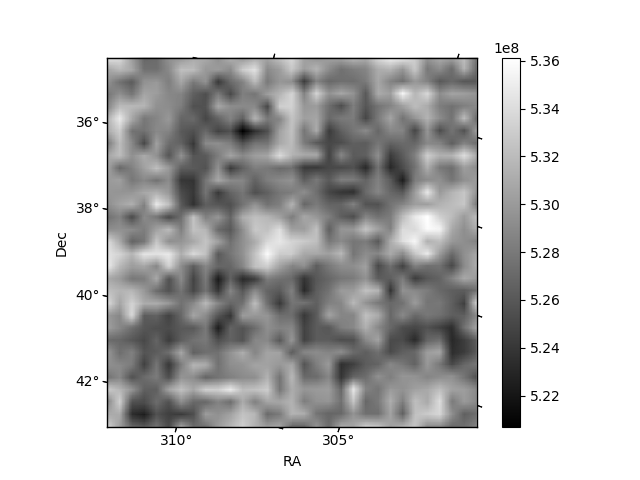
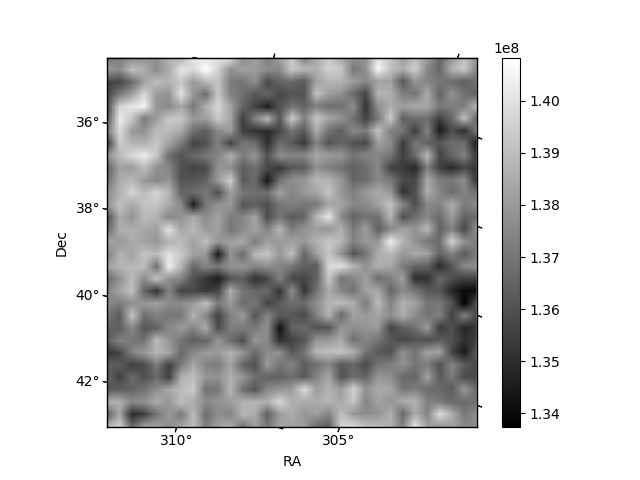
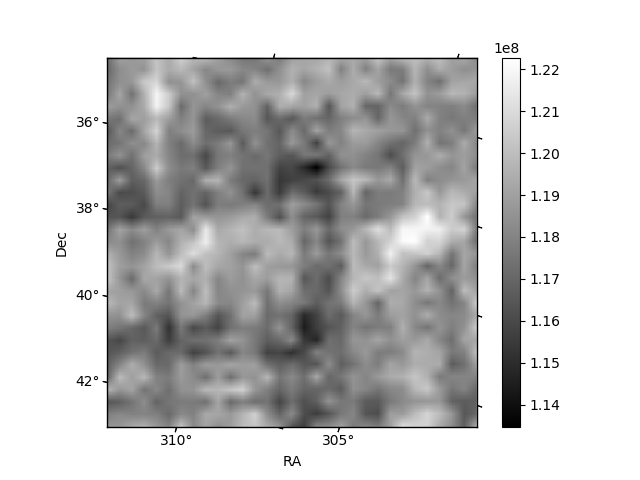
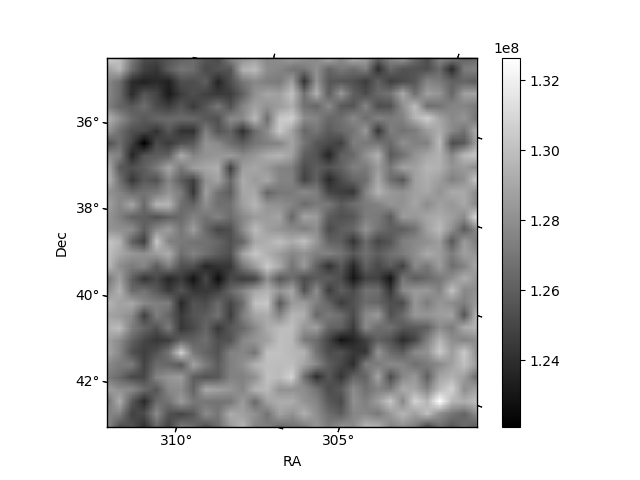
Histogram calculated using DETX and DETY for each event in the final _common_clean file
| Quadrant A | 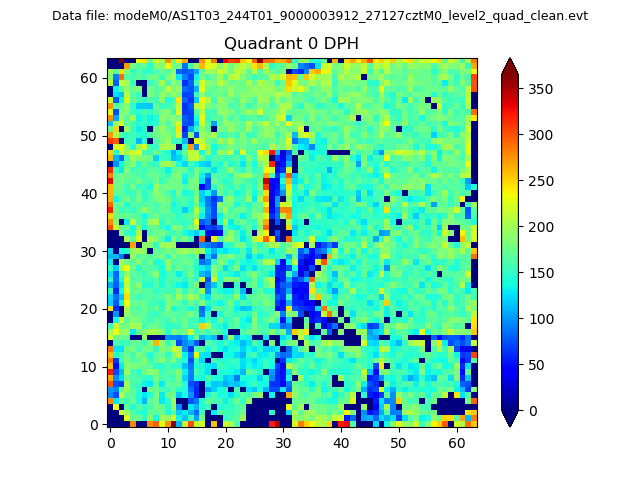 |
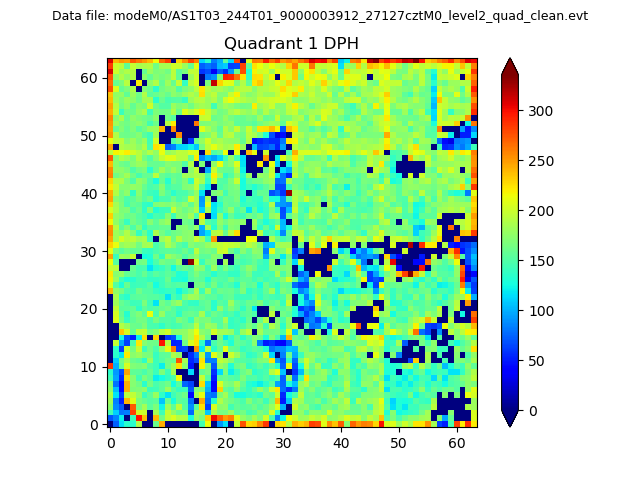 |
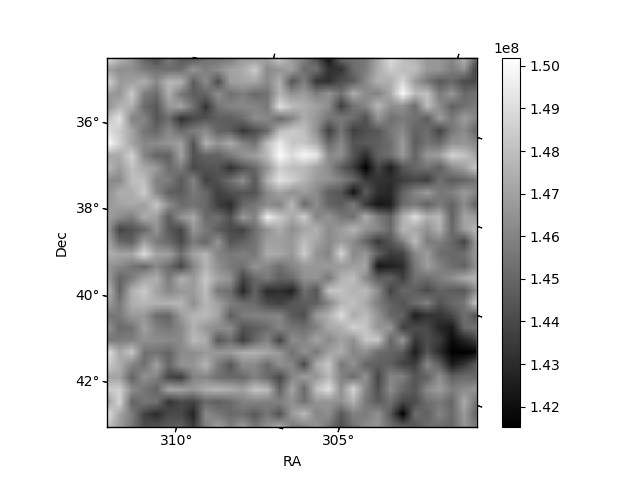
Quadrant B |
|---|---|---|---|
| Quadrant D | 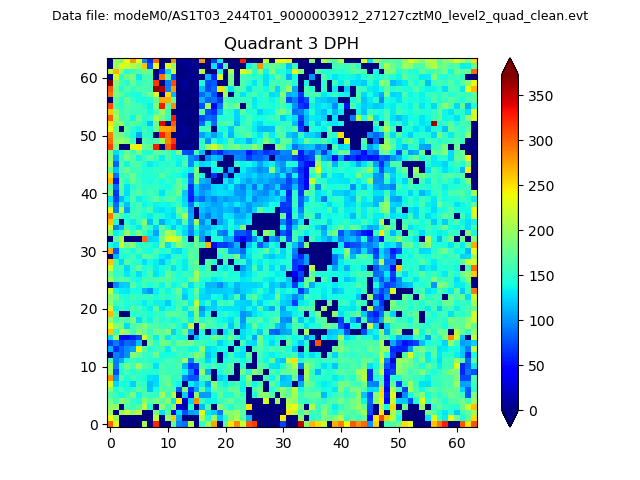 |
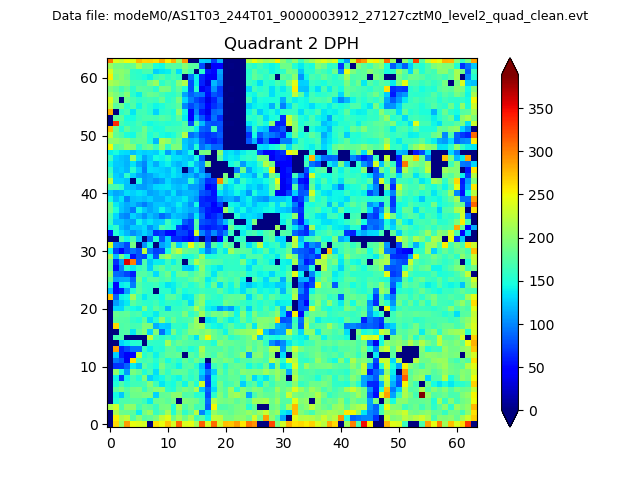 |
Quadrant C |
| Plot type | Count rate plots | Images |
|---|---|---|
| Comparison with Poisson distribution Blue bars denote a histogram of data divided into 1 sec bins. Red curve is a Poisson curve with rate = median count rate of data. |
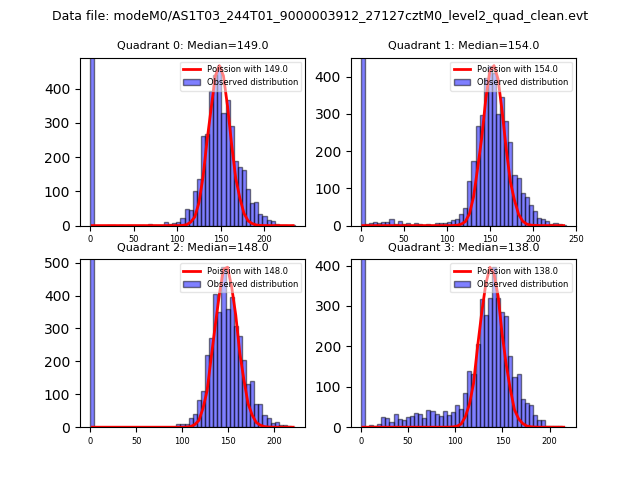 |
 |
| Quadrant-wise count rates Data is divided into 100 sec bins |
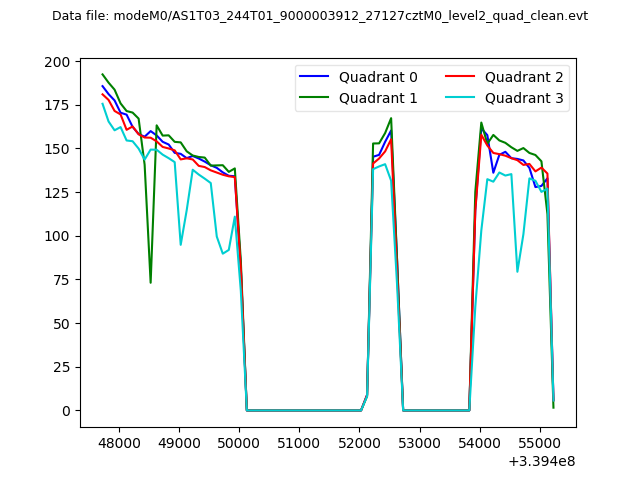 |
|
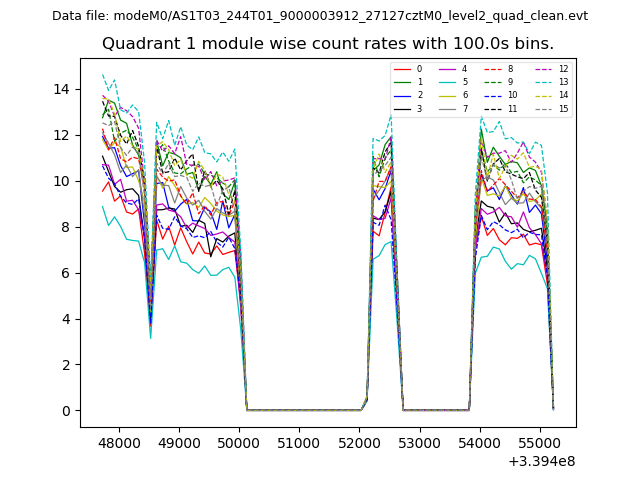
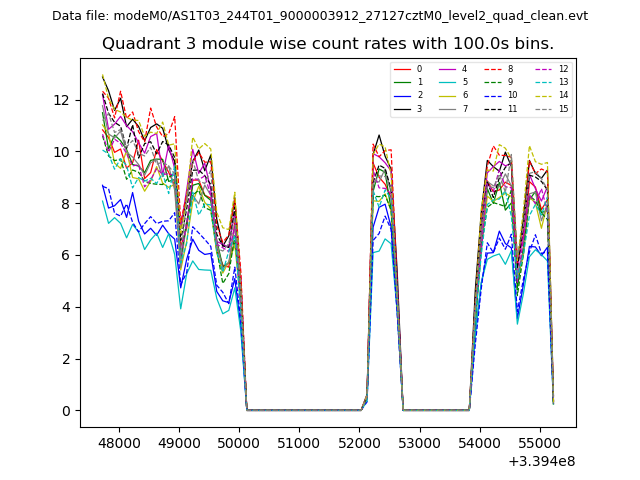
| Module-wise count rates for Quadrant A Data is divided into 100 sec bins |
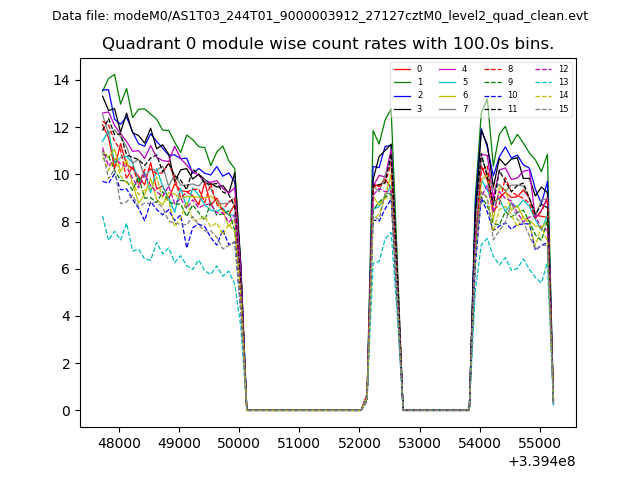 |
 |
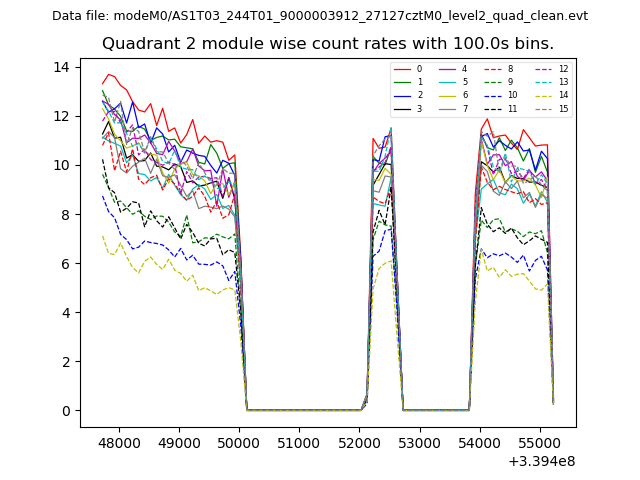
| Module-wise count rates for Quadrant B Data is divided into 100 sec bins |
 |
 |
| Module-wise count rates for Quadrant C Data is divided into 100 sec bins |
 |
 |
| Module-wise count rates for Quadrant D Data is divided into 100 sec bins |
 |
 |
| Parameter | Plot |
|---|---|
| CZT HV Monitor | 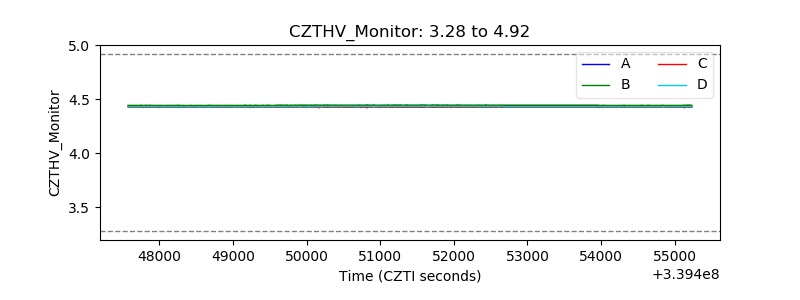 |
| D_VDD | 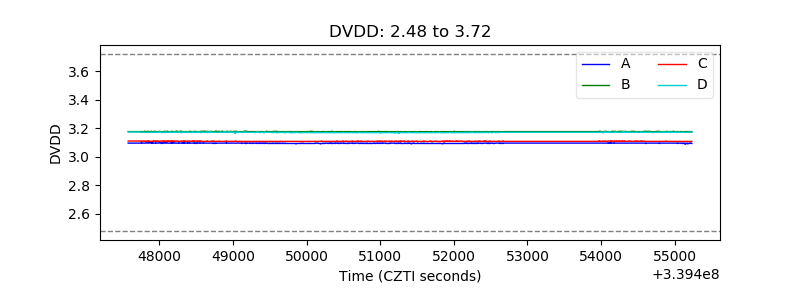 |
| Temperature 1 | 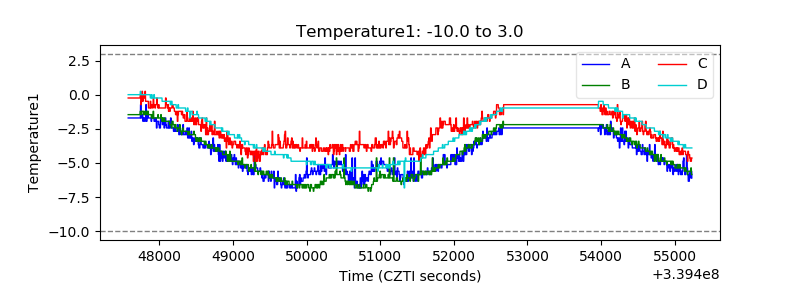 |
| Veto HV Monitor | 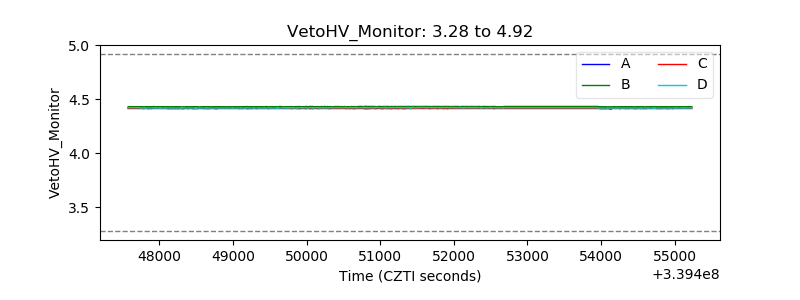 |
| Veto LLD | 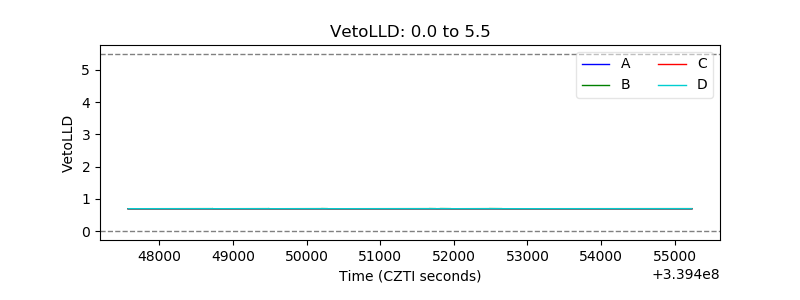 |
| Alpha Counter | 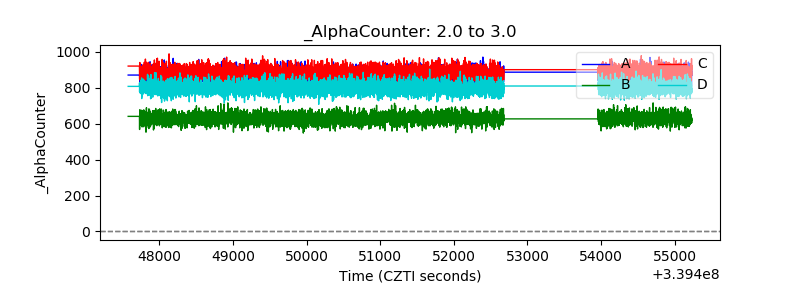 |
| _CPM_Rate | 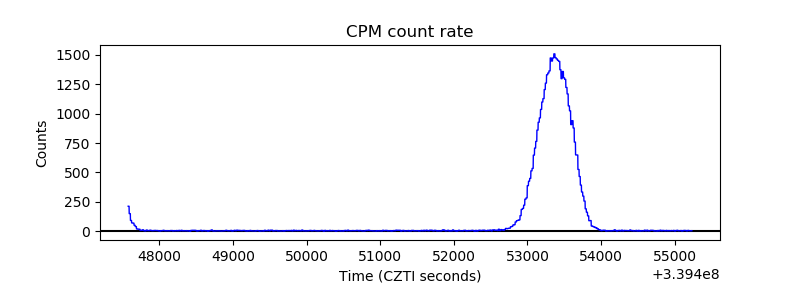 |
| CZT Counter | 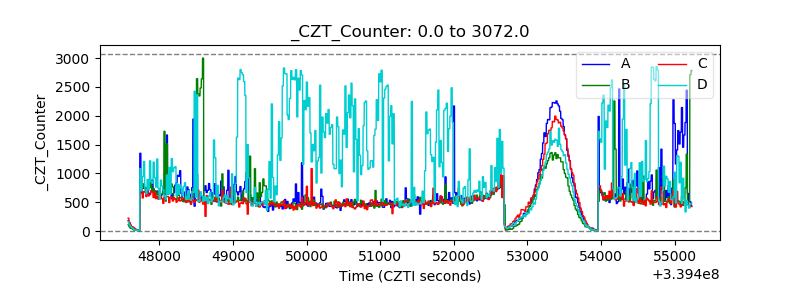 |
| +2.5 Volts monitor | 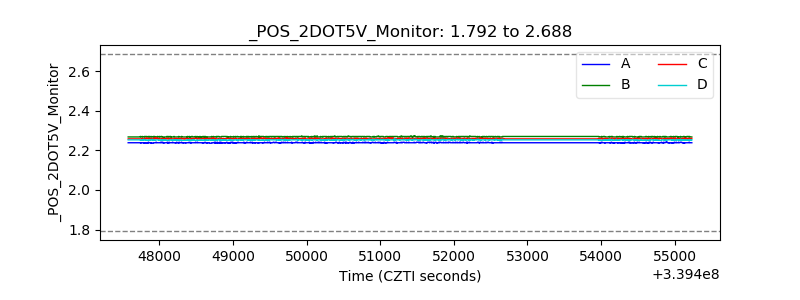 |
| +5 Volts monitor |  |
| _ROLL_ROT | 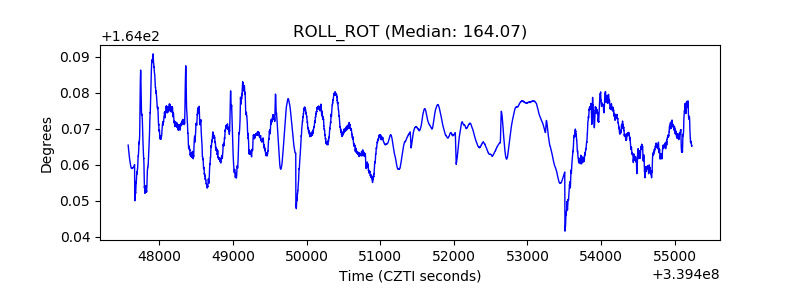 |
| _Roll_DEC | 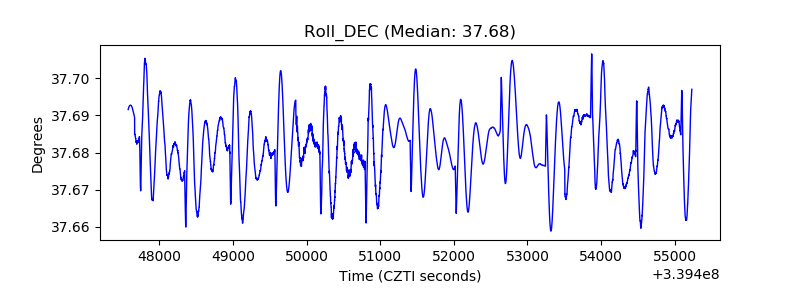 |
| _Roll_RA | 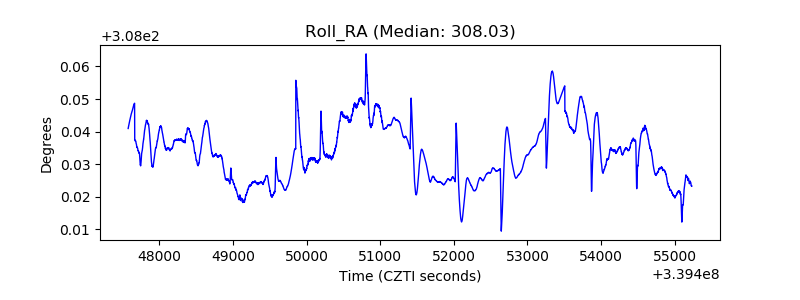 |
| Veto Counter | 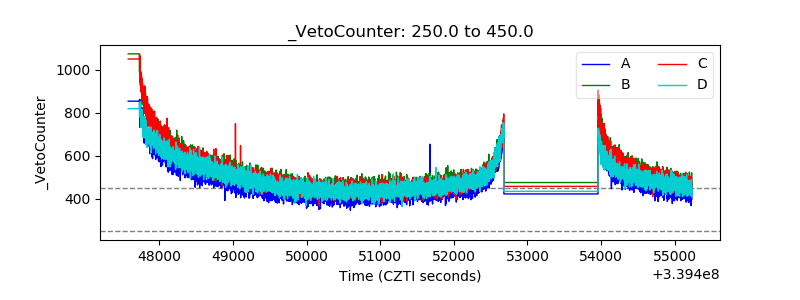 |