| Param | Original file | Final file |
|---|---|---|
| Filename | modeM0/AS1T03_244T01_9000003912_27128cztM0_level2.evt | modeM0/AS1T03_244T01_9000003912_27128cztM0_level2_quad_clean.evt |
| Size (bytes) | 620,277,120 | 94,248,000 |
| Size | 591.5 MB | 89.9 MB |
| Events in quadrant A | 4,253,999 | 622,287 |
| Events in quadrant B | 3,797,106 | 635,447 |
| Events in quadrant C | 3,284,443 | 617,478 |
| Events in quadrant D | 7,000,538 | 516,117 |
| Mode M9 | |||
|---|---|---|---|
| Quadrant | BADHDUFLAG | Total packets | Discarded packets |
| A | 0 | 17 | 0 |
| B | 0 | 18 | 0 |
| C | 0 | 18 | 0 |
| D | 0 | 18 | 0 |
| Mode M0 | |||
|---|---|---|---|
| Quadrant | BADHDUFLAG | Total packets | Discarded packets |
| A | 0 | 16825 | 0 |
| B | 0 | 15396 | 0 |
| C | 0 | 13849 | 0 |
| D | 0 | 25346 | 0 |
| Quadrant | Total seconds | Saturated seconds | Saturation percentage |
|---|---|---|---|
| A | 6624 | 148 | 2.234300% |
| B | 6624 | 177 | 2.672101% |
| C | 6624 | 76 | 1.147343% |
| D | 6624 | 1459 | 22.025966% |
Noise dominated data is calculated using 1-second bins in cleaned event files. If a bin has >2000 counts, and if more than 50% of those come from <1% of pixels, then it is considered to be noise-dominated and hence unusable.
| Quadrant | # 1 sec bins | Bins with >0 counts | Bins with >2000 counts | High rate bins dominated by noise | Noise dominated (total time) | Noise dominated (detector-on time) | Marked lightcurve |
|---|---|---|---|---|---|---|---|
| A | 7649 | 6625 | 117 | 117 | 1.53% | 1.77% | 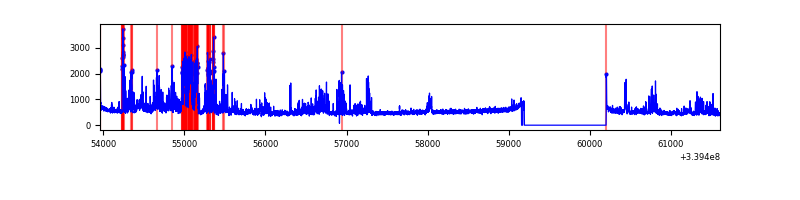 |
| B | 7649 | 6625 | 117 | 117 | 1.53% | 1.77% | 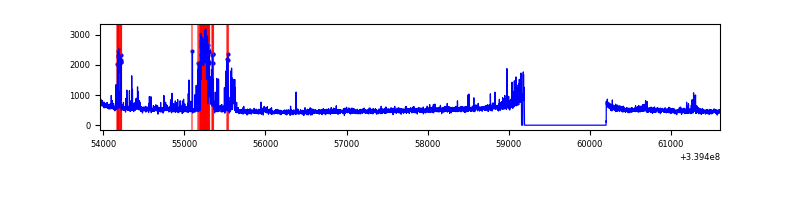 |
| C | 7649 | 6625 | 1 | 1 | 0.01% | 0.02% | 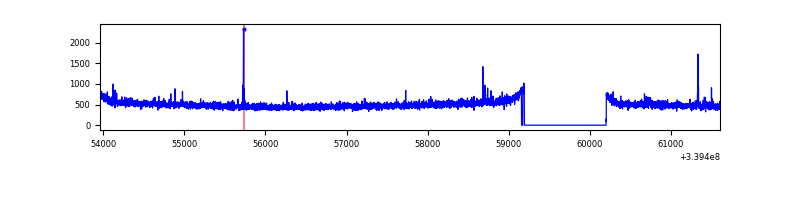 |
| D | 7649 | 6625 | 1207 | 1207 | 15.78% | 18.22% | 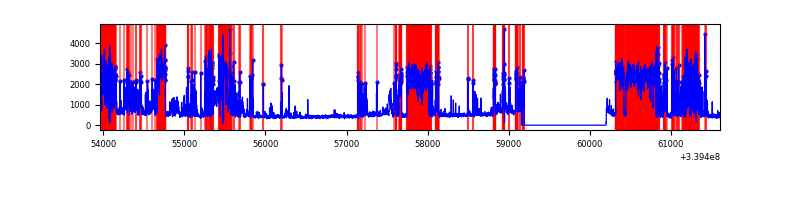 |
Top three noisy pixels from each quadrant. If the there are fewer than three noisy pixels in the level2.evt file, extra rows are filled as -1
| Pixel properties | Quadrant properties | ||||||
|---|---|---|---|---|---|---|---|
| Quadrant | DetID | PixID | Counts | Sigma | Mean | Median | Sigma |
| A | 6 | 16 | 559800 | 3435.22 | 815 | 797 | 162.7 |
| A | 14 | 235 | 474383 | 2910.31 | 815 | 797 | 162.7 |
| A | 13 | 248 | 51727 | 312.98 | 815 | 797 | 162.7 |
| B | 10 | 245 | 441634 | 2854.24 | 816 | 796 | 154.4 |
| B | 3 | 112 | 54465 | 347.48 | 816 | 796 | 154.4 |
| B | 7 | 205 | 45995 | 292.64 | 816 | 796 | 154.4 |
| C | 14 | 238 | 127739 | 677.42 | 799 | 804 | 187.4 |
| C | 2 | 16 | 19670 | 100.68 | 799 | 804 | 187.4 |
| C | 15 | 208 | 16833 | 85.54 | 799 | 804 | 187.4 |
| D | 1 | 52 | 3524854 | 18829.12 | 718 | 706 | 187.2 |
| D | 2 | 250 | 342092 | 1823.99 | 718 | 706 | 187.2 |
| D | 7 | 38 | 338089 | 1802.6 | 718 | 706 | 187.2 |
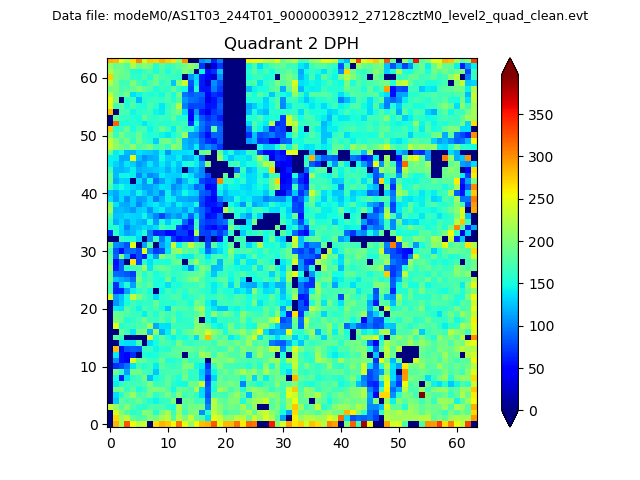
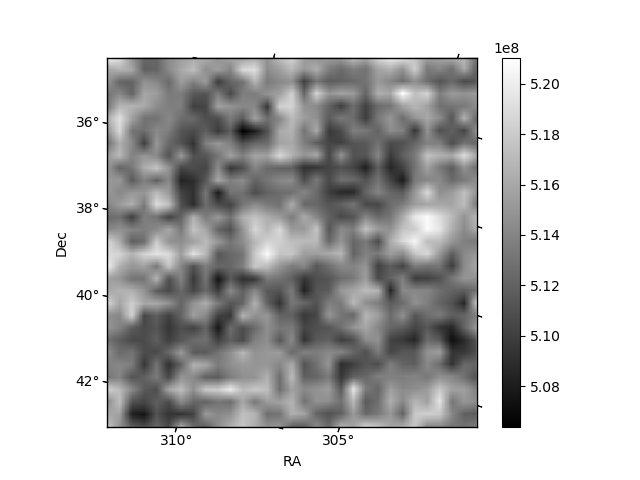
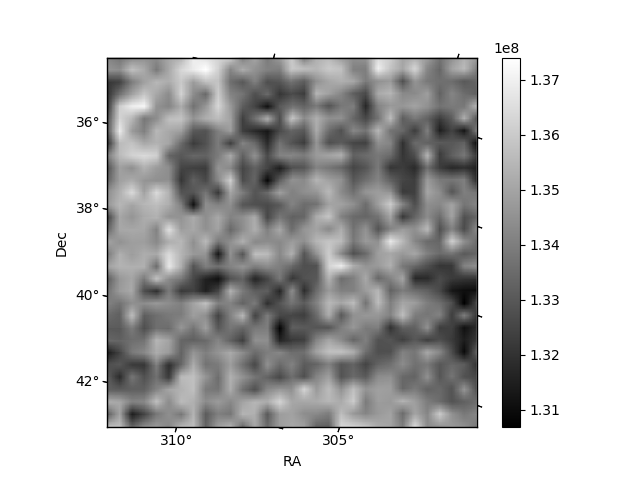
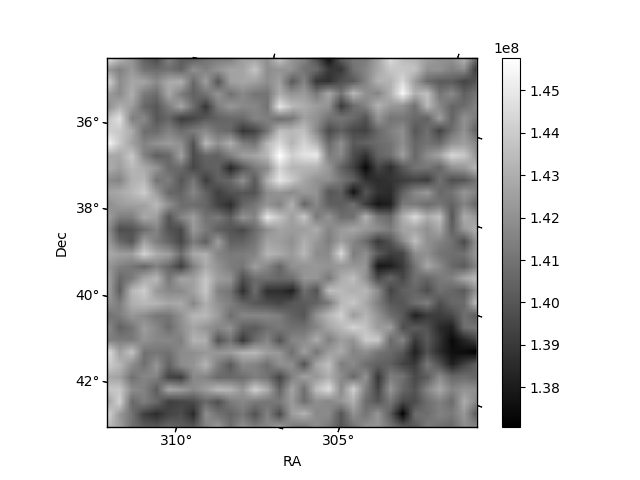
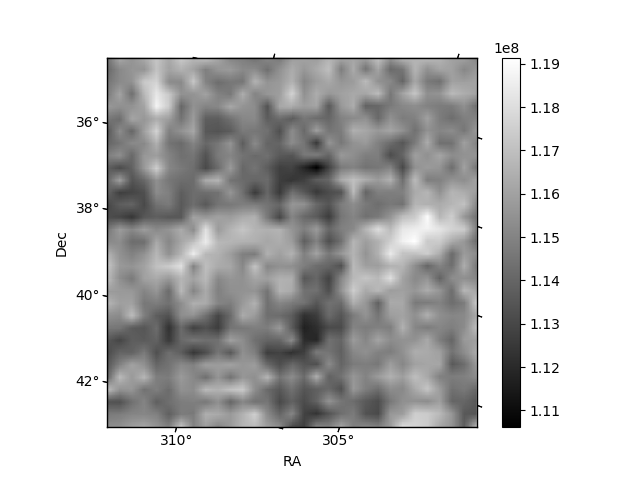
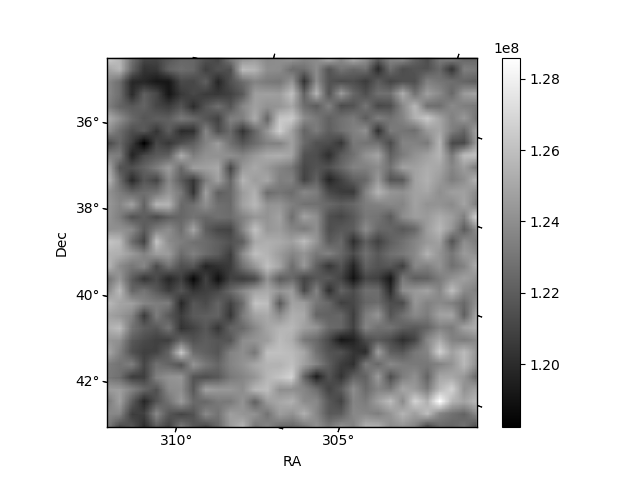
Histogram calculated using DETX and DETY for each event in the final _common_clean file
| Quadrant A | 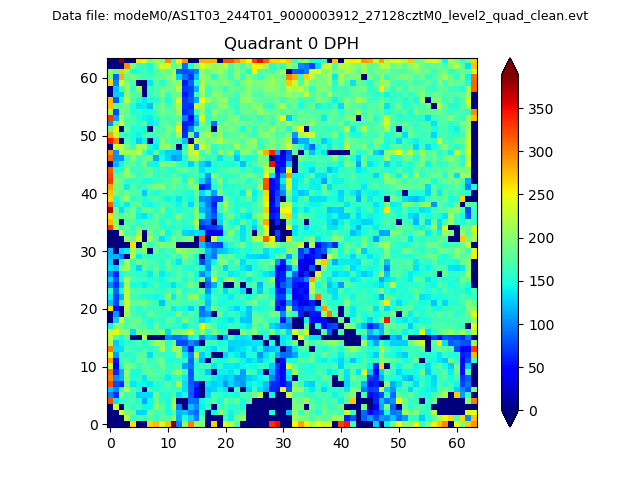 |
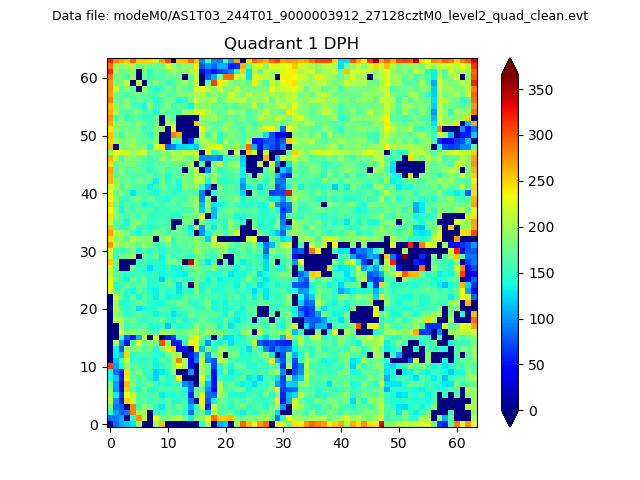 |
Quadrant B |
|---|---|---|---|
| Quadrant D | 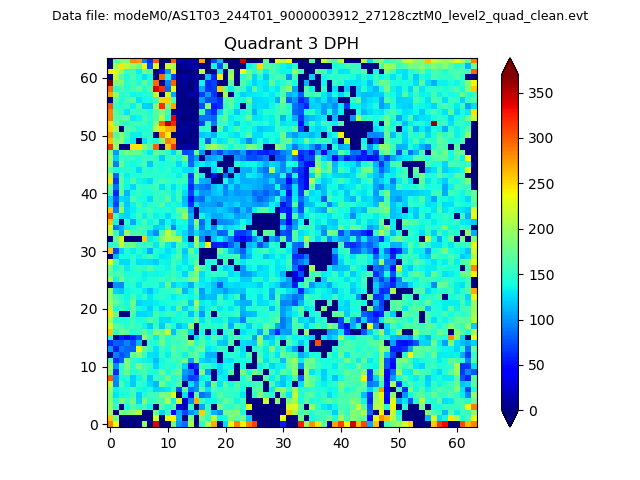 |
 |
Quadrant C |
| Plot type | Count rate plots | Images |
|---|---|---|
| Comparison with Poisson distribution Blue bars denote a histogram of data divided into 1 sec bins. Red curve is a Poisson curve with rate = median count rate of data. |
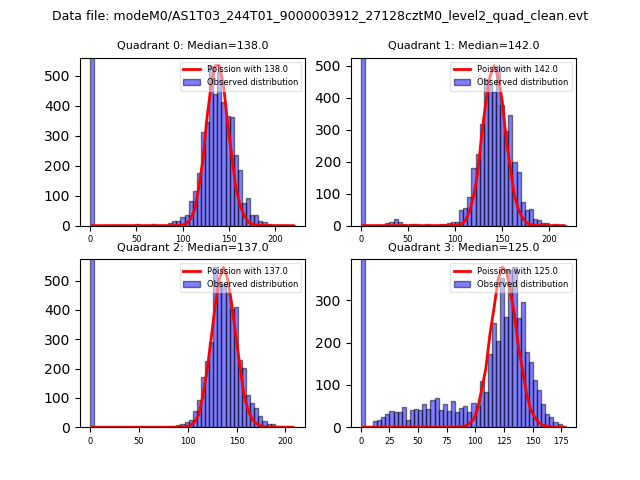 |
 |
| Quadrant-wise count rates Data is divided into 100 sec bins |
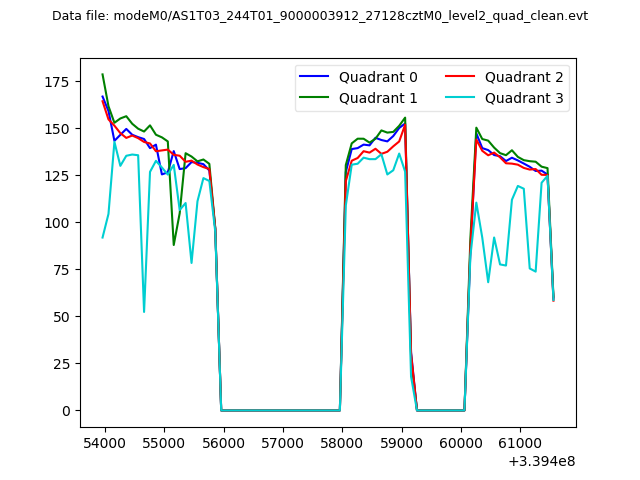 |
|
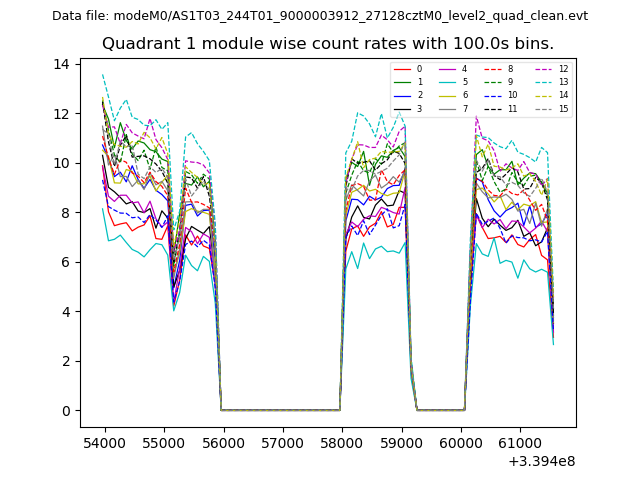
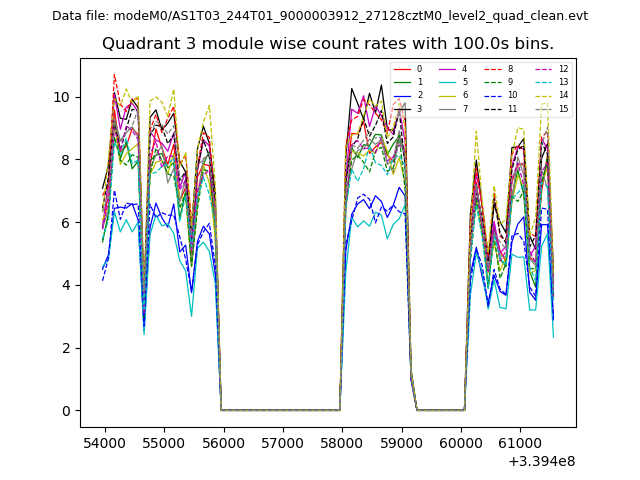
| Module-wise count rates for Quadrant A Data is divided into 100 sec bins |
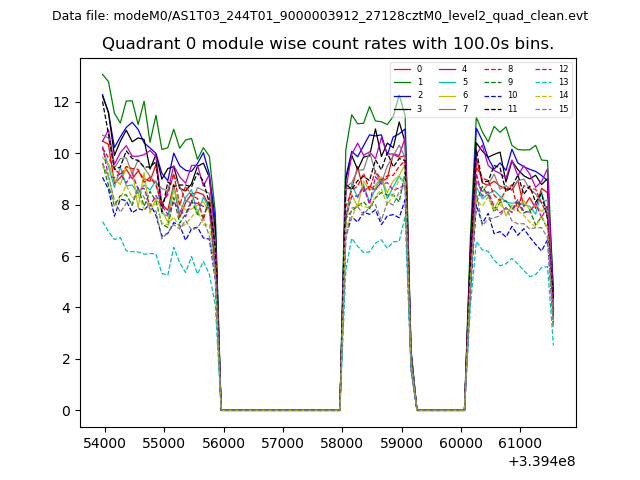 |
 |
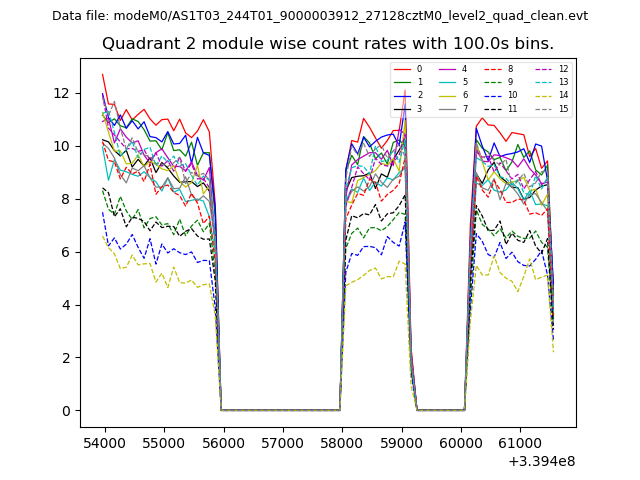
| Module-wise count rates for Quadrant B Data is divided into 100 sec bins |
 |
 |
| Module-wise count rates for Quadrant C Data is divided into 100 sec bins |
 |
 |
| Module-wise count rates for Quadrant D Data is divided into 100 sec bins |
 |
 |
| Parameter | Plot |
|---|---|
| CZT HV Monitor | 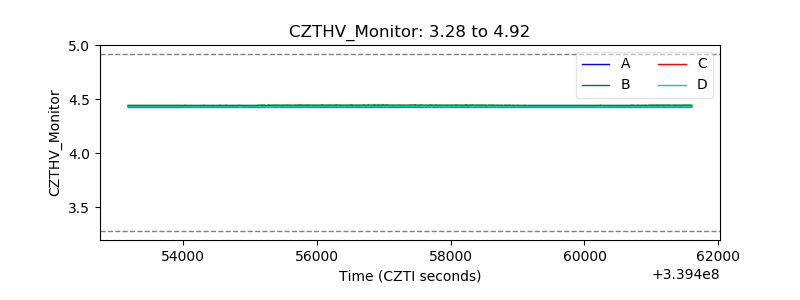 |
| D_VDD | 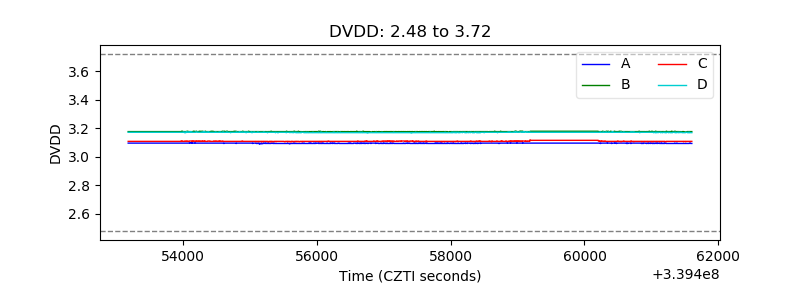 |
| Temperature 1 | 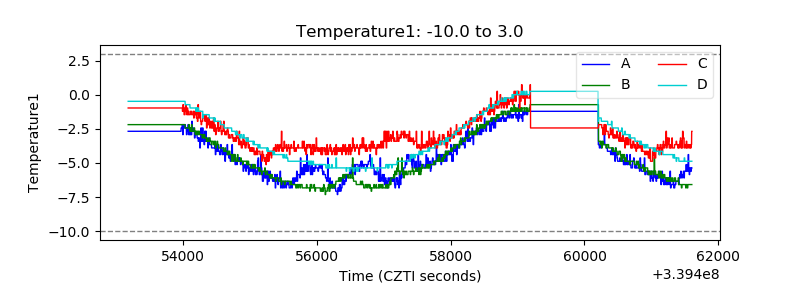 |
| Veto HV Monitor | 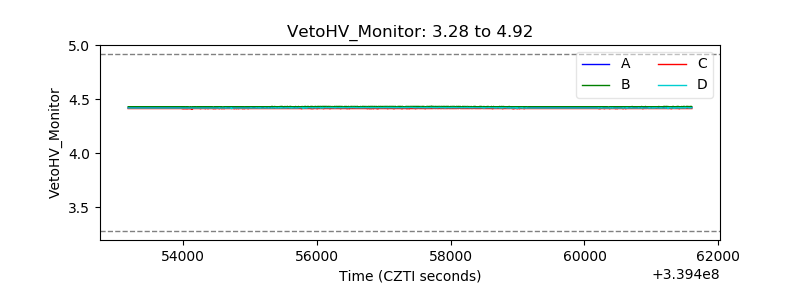 |
| Veto LLD | 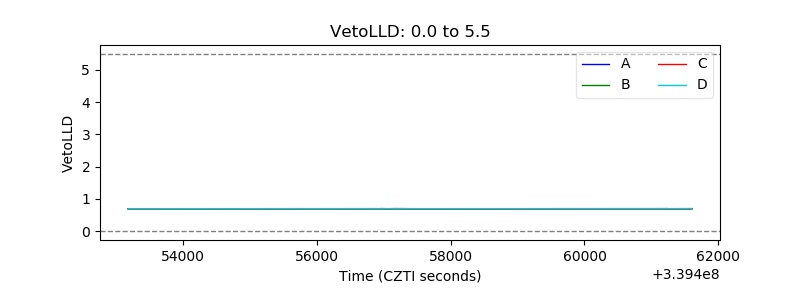 |
| Alpha Counter | 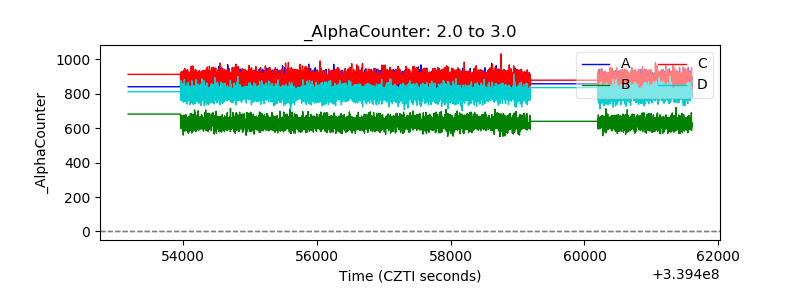 |
| _CPM_Rate | 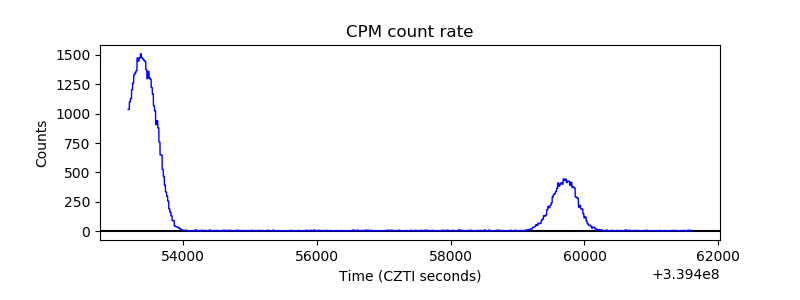 |
| CZT Counter | 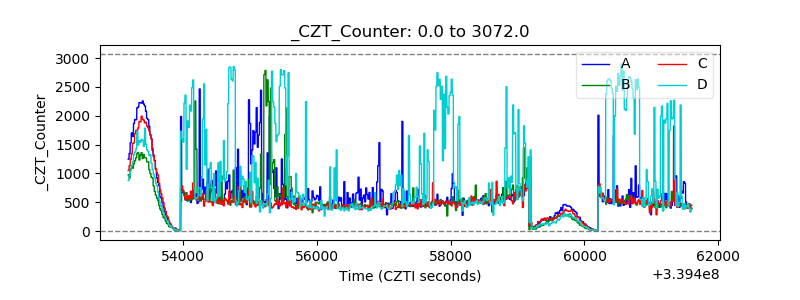 |
| +2.5 Volts monitor | 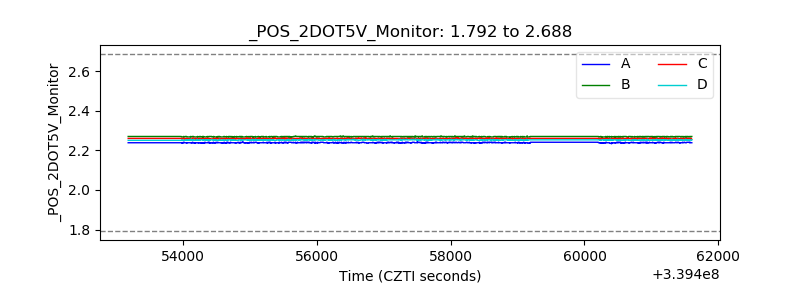 |
| +5 Volts monitor |  |
| _ROLL_ROT | 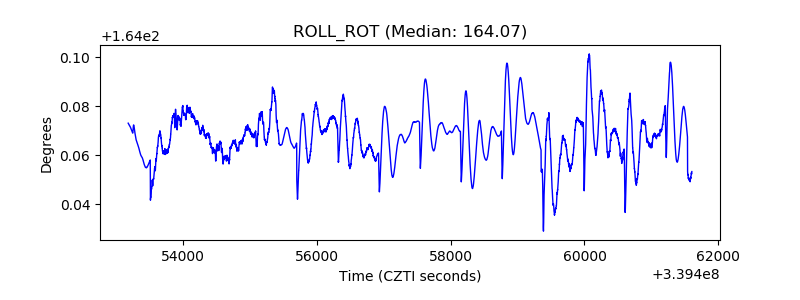 |
| _Roll_DEC | 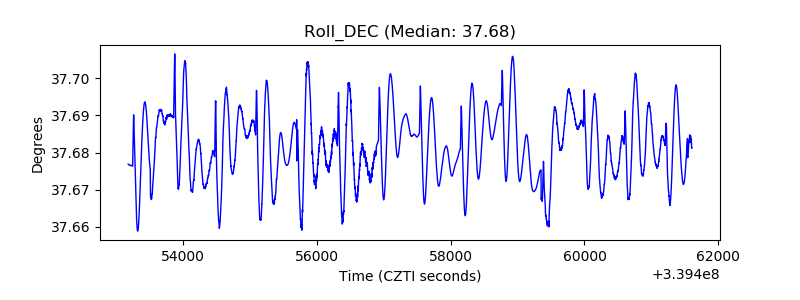 |
| _Roll_RA | 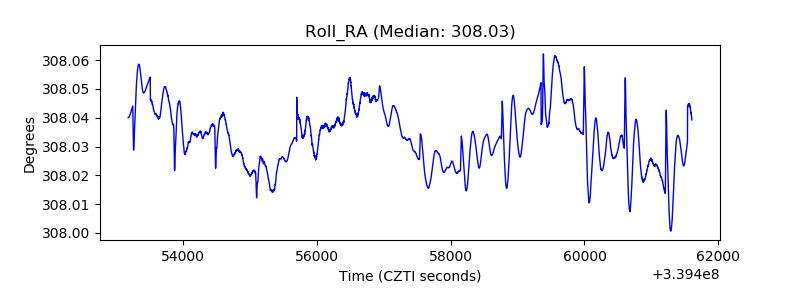 |
| Veto Counter | 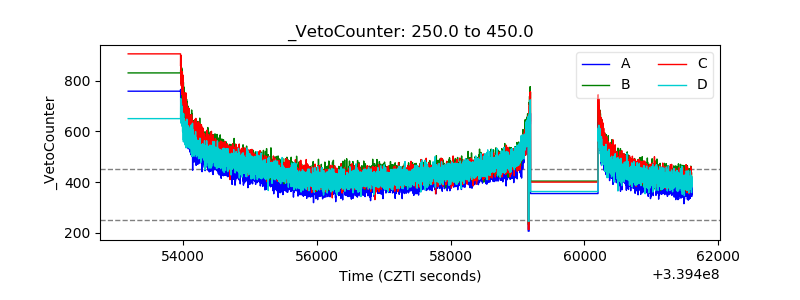 |