| Param | Original file | Final file |
|---|---|---|
| Filename | modeM0/AS1T03_244T01_9000003912_27129cztM0_level2.evt | modeM0/AS1T03_244T01_9000003912_27129cztM0_level2_quad_clean.evt |
| Size (bytes) | 566,161,920 | 95,094,720 |
| Size | 539.9 MB | 90.7 MB |
| Events in quadrant A | 4,035,759 | 615,342 |
| Events in quadrant B | 3,512,272 | 631,952 |
| Events in quadrant C | 3,394,604 | 605,558 |
| Events in quadrant D | 5,735,494 | 545,613 |
| Mode M9 | |||
|---|---|---|---|
| Quadrant | BADHDUFLAG | Total packets | Discarded packets |
| A | 0 | 13 | 0 |
| B | 0 | 14 | 0 |
| C | 0 | 14 | 0 |
| D | 0 | 14 | 0 |
| Mode M0 | |||
|---|---|---|---|
| Quadrant | BADHDUFLAG | Total packets | Discarded packets |
| A | 0 | 16395 | 0 |
| B | 0 | 14687 | 0 |
| C | 0 | 14518 | 0 |
| D | 0 | 21811 | 0 |
| Quadrant | Total seconds | Saturated seconds | Saturation percentage |
|---|---|---|---|
| A | 6899 | 44 | 0.637774% |
| B | 6899 | 37 | 0.536310% |
| C | 6899 | 63 | 0.913176% |
| D | 6899 | 783 | 11.349471% |
Noise dominated data is calculated using 1-second bins in cleaned event files. If a bin has >2000 counts, and if more than 50% of those come from <1% of pixels, then it is considered to be noise-dominated and hence unusable.
| Quadrant | # 1 sec bins | Bins with >0 counts | Bins with >2000 counts | High rate bins dominated by noise | Noise dominated (total time) | Noise dominated (detector-on time) | Marked lightcurve |
|---|---|---|---|---|---|---|---|
| A | 7574 | 6900 | 27 | 27 | 0.36% | 0.39% | 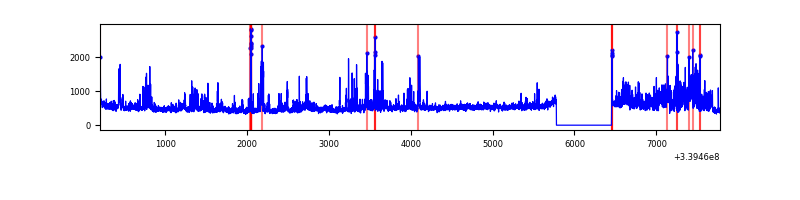 |
| B | 7574 | 6900 | 11 | 11 | 0.15% | 0.16% | 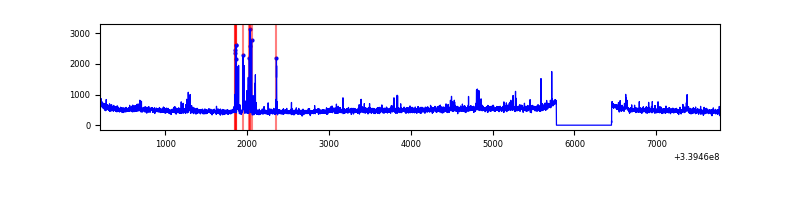 |
| C | 7574 | 6900 | 2 | 2 | 0.03% | 0.03% | 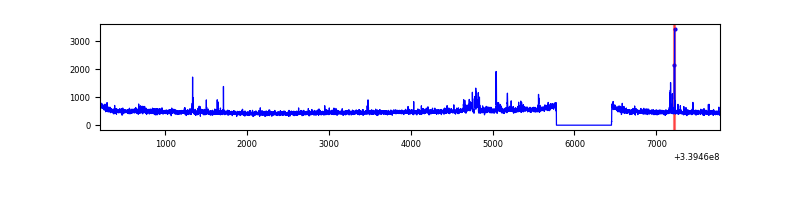 |
| D | 7574 | 6900 | 673 | 673 | 8.89% | 9.75% | 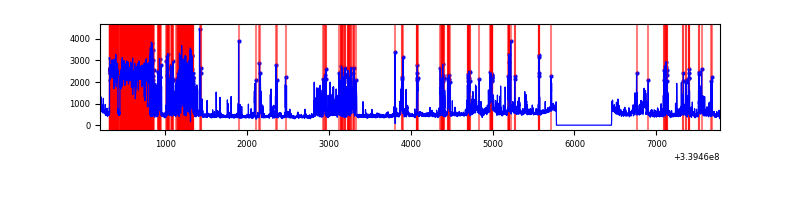 |
Top three noisy pixels from each quadrant. If the there are fewer than three noisy pixels in the level2.evt file, extra rows are filled as -1
| Pixel properties | Quadrant properties | ||||||
|---|---|---|---|---|---|---|---|
| Quadrant | DetID | PixID | Counts | Sigma | Mean | Median | Sigma |
| A | 14 | 235 | 456595 | 2740.37 | 830 | 810 | 166.3 |
| A | 6 | 16 | 341230 | 2046.75 | 830 | 810 | 166.3 |
| A | 8 | 192 | 17143 | 98.2 | 830 | 810 | 166.3 |
| B | 3 | 64 | 91983 | 571.05 | 834 | 812 | 159.7 |
| B | 3 | 112 | 84833 | 526.27 | 834 | 812 | 159.7 |
| B | 10 | 245 | 24810 | 150.31 | 834 | 812 | 159.7 |
| C | 14 | 238 | 128638 | 671.9 | 810 | 816 | 190.2 |
| C | 3 | 233 | 47747 | 246.7 | 810 | 816 | 190.2 |
| C | 15 | 208 | 22625 | 114.64 | 810 | 816 | 190.2 |
| D | 1 | 52 | 2416231 | 12069.93 | 768 | 752 | 200.1 |
| D | 7 | 38 | 193144 | 961.37 | 768 | 752 | 200.1 |
| D | 2 | 250 | 171265 | 852.04 | 768 | 752 | 200.1 |
Histogram calculated using DETX and DETY for each event in the final _common_clean file
| Quadrant A | 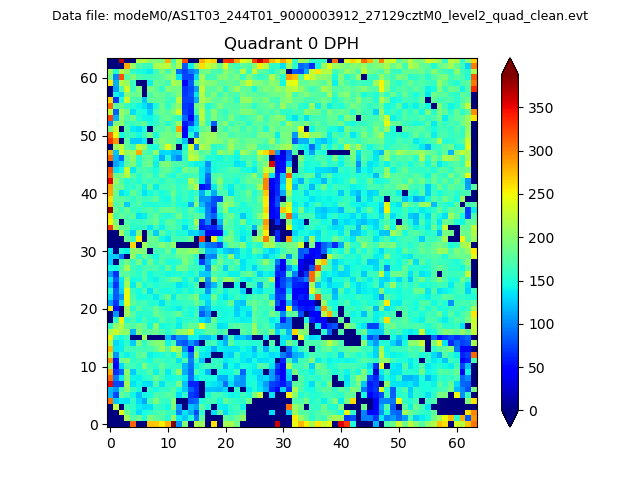 |
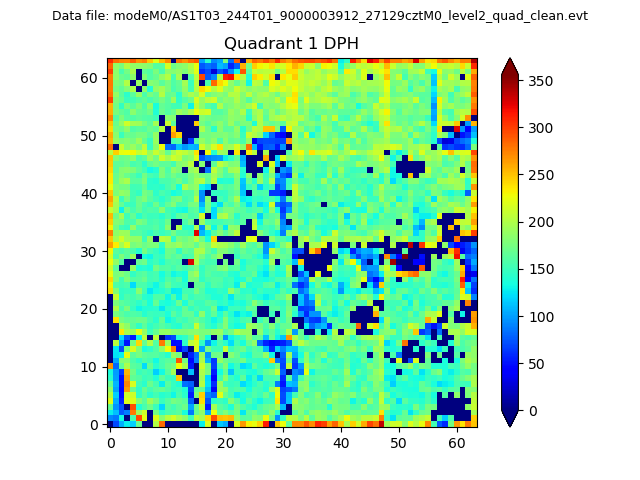 |
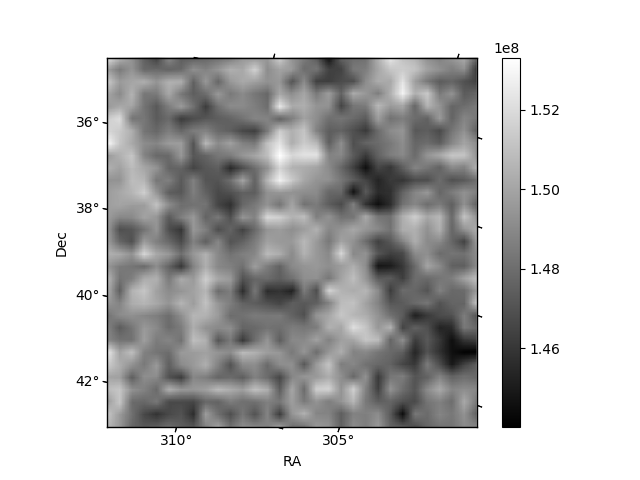
Quadrant B |
|---|---|---|---|
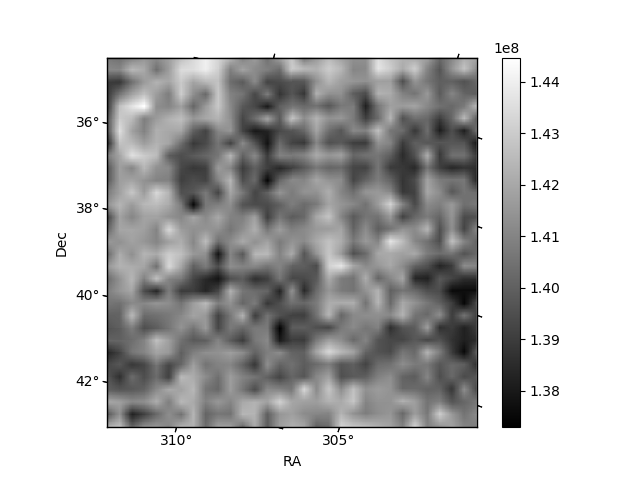
| Quadrant D |  |
 |
Quadrant C |
| Plot type | Count rate plots | Images |
|---|---|---|
| Comparison with Poisson distribution Blue bars denote a histogram of data divided into 1 sec bins. Red curve is a Poisson curve with rate = median count rate of data. |
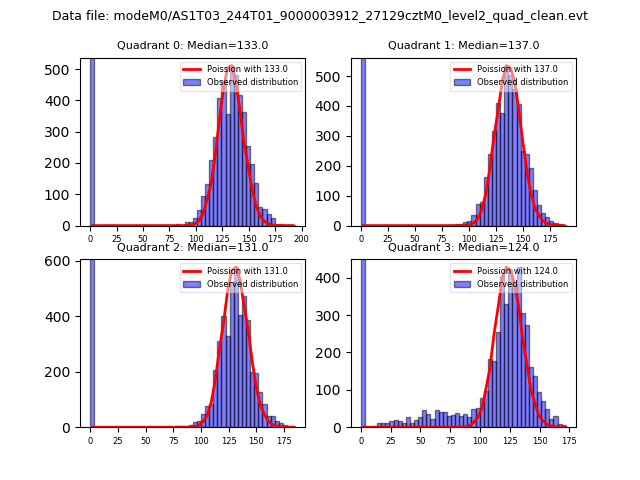 |
 |
| Quadrant-wise count rates Data is divided into 100 sec bins |
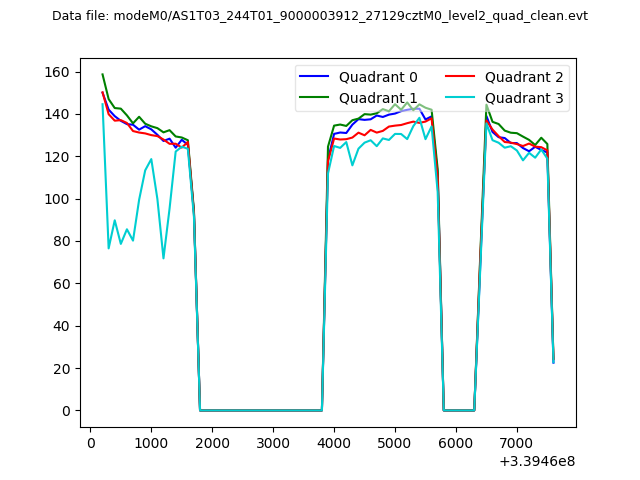 |
|
| Module-wise count rates for Quadrant A Data is divided into 100 sec bins |
 |
 |
| Module-wise count rates for Quadrant B Data is divided into 100 sec bins |
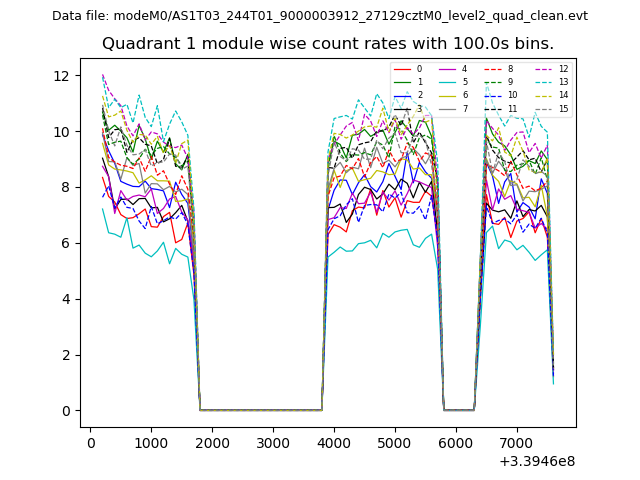 |
 |
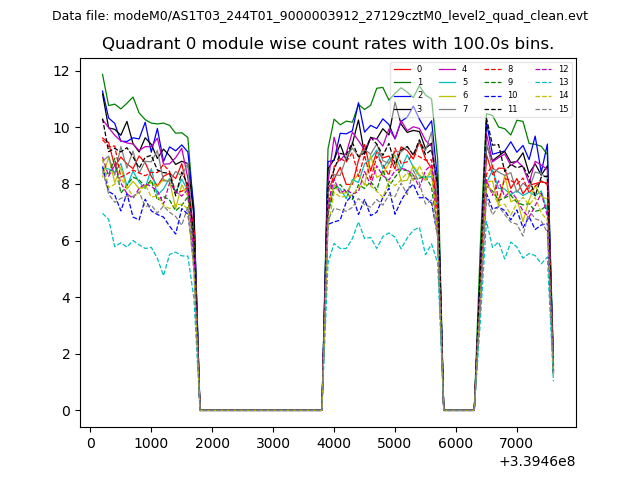
| Module-wise count rates for Quadrant C Data is divided into 100 sec bins |
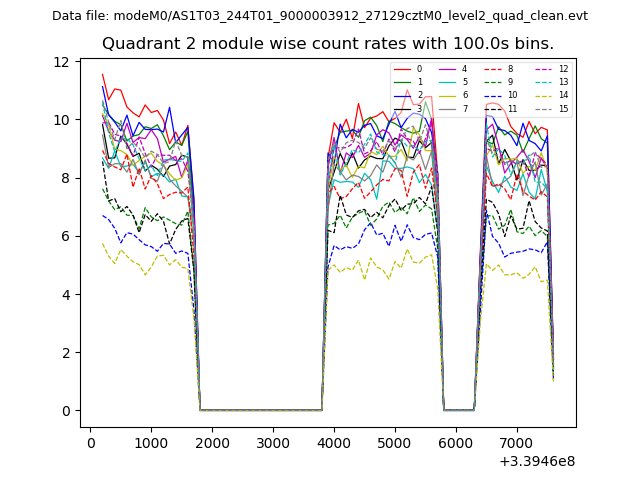 |
 |
| Module-wise count rates for Quadrant D Data is divided into 100 sec bins |
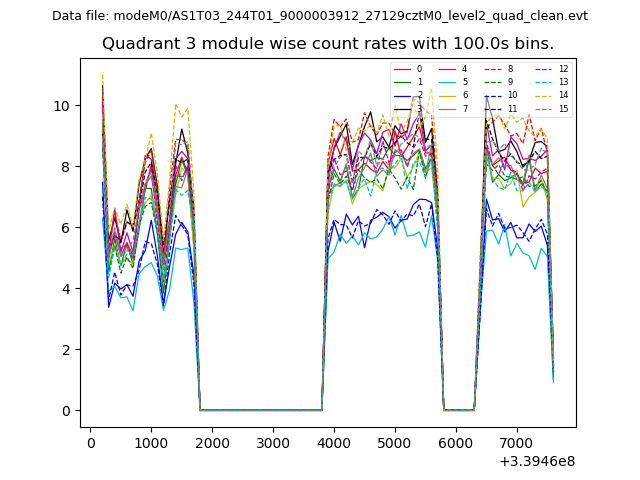 |
 |
| Parameter | Plot |
|---|---|
| CZT HV Monitor | 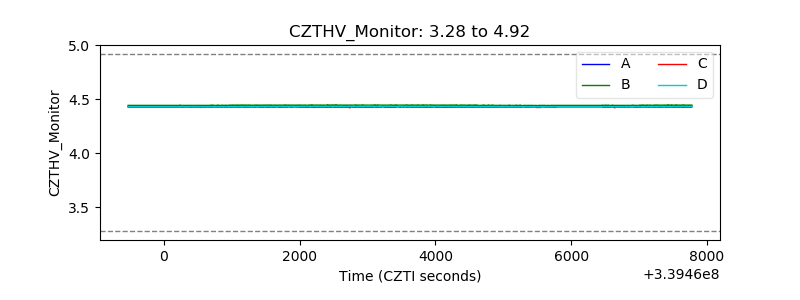 |
| D_VDD | 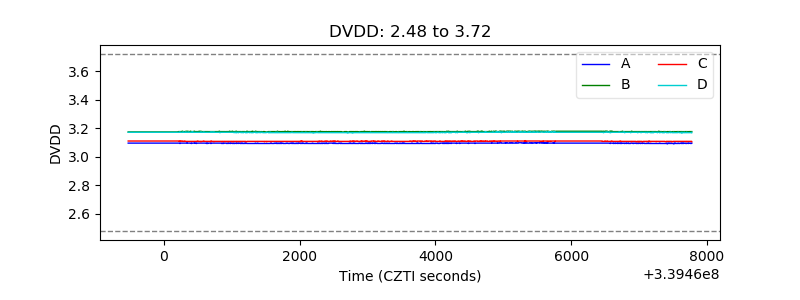 |
| Temperature 1 | 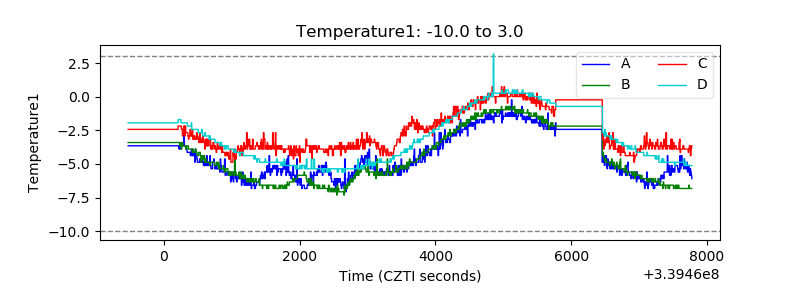 |
| Veto HV Monitor | 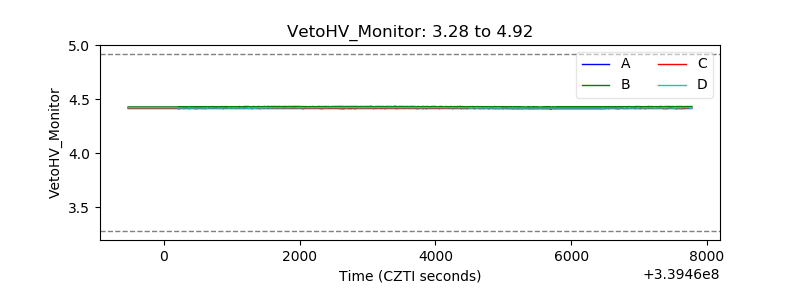 |
| Veto LLD | 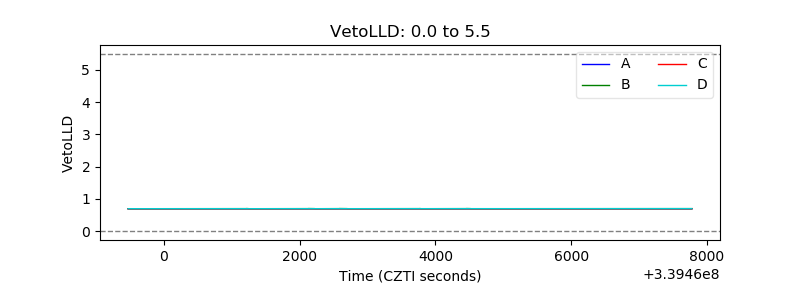 |
| Alpha Counter | 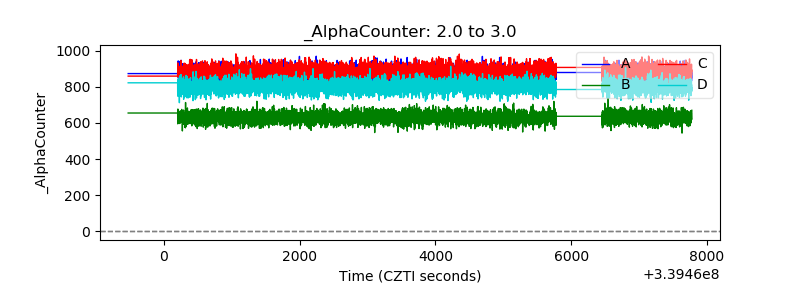 |
| _CPM_Rate | 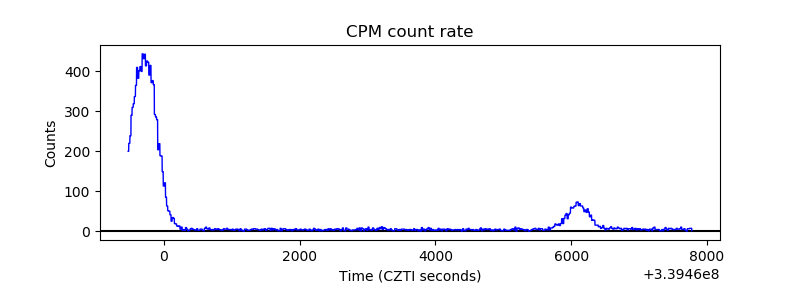 |
| CZT Counter | 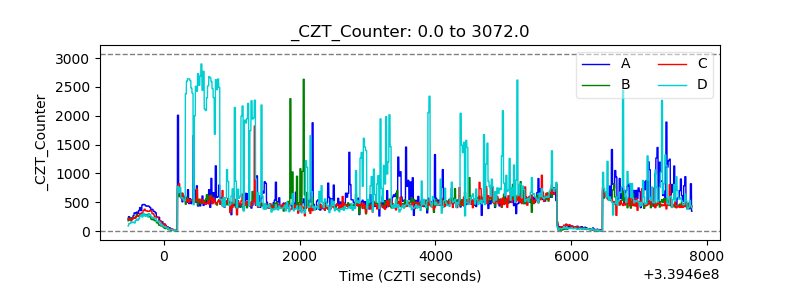 |
| +2.5 Volts monitor |  |
| +5 Volts monitor |  |
| _ROLL_ROT | 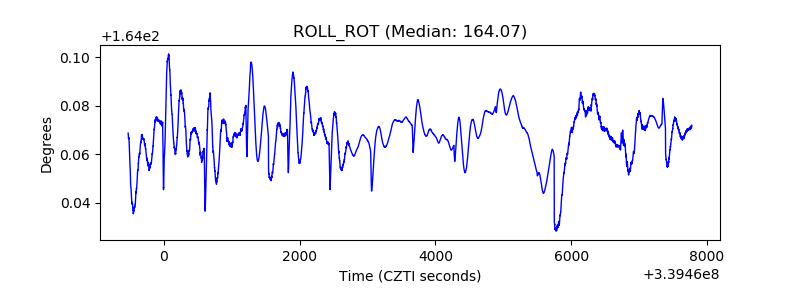 |
| _Roll_DEC | 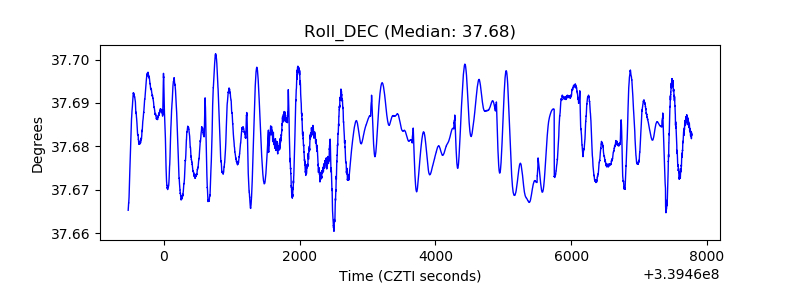 |
| _Roll_RA | 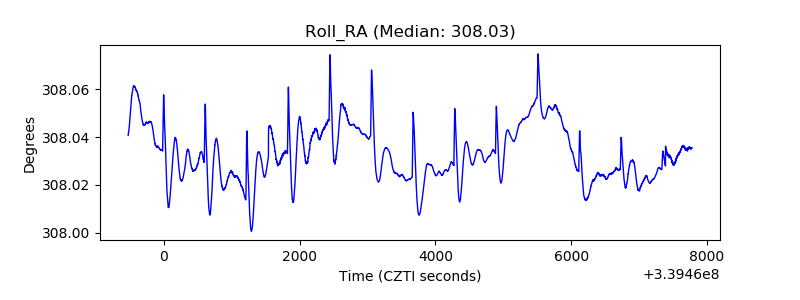 |
| Veto Counter | 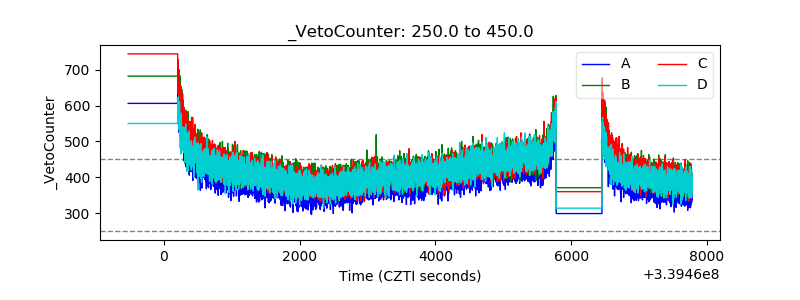 |