| Param | Original file | Final file |
|---|---|---|
| Filename | modeM0/AS1T03_244T01_9000003912_27130cztM0_level2.evt | modeM0/AS1T03_244T01_9000003912_27130cztM0_level2_quad_clean.evt |
| Size (bytes) | 959,466,240 | 150,560,640 |
| Size | 915.0 MB | 143.6 MB |
| Events in quadrant A | 7,238,004 | 945,451 |
| Events in quadrant B | 6,160,199 | 970,443 |
| Events in quadrant C | 5,922,109 | 929,085 |
| Events in quadrant D | 8,918,056 | 876,331 |
| Mode M9 | |||
|---|---|---|---|
| Quadrant | BADHDUFLAG | Total packets | Discarded packets |
| A | 0 | 9 | 0 |
| B | 0 | 9 | 0 |
| C | 0 | 9 | 0 |
| D | 0 | 9 | 0 |
| Mode M0 | |||
|---|---|---|---|
| Quadrant | BADHDUFLAG | Total packets | Discarded packets |
| A | 0 | 29457 | 0 |
| B | 0 | 25893 | 0 |
| C | 0 | 25375 | 0 |
| D | 0 | 34951 | 0 |
| Quadrant | Total seconds | Saturated seconds | Saturation percentage |
|---|---|---|---|
| A | 12124 | 129 | 1.064005% |
| B | 12124 | 117 | 0.965028% |
| C | 12124 | 135 | 1.113494% |
| D | 12124 | 635 | 5.237545% |
Noise dominated data is calculated using 1-second bins in cleaned event files. If a bin has >2000 counts, and if more than 50% of those come from <1% of pixels, then it is considered to be noise-dominated and hence unusable.
| Quadrant | # 1 sec bins | Bins with >0 counts | Bins with >2000 counts | High rate bins dominated by noise | Noise dominated (total time) | Noise dominated (detector-on time) | Marked lightcurve |
|---|---|---|---|---|---|---|---|
| A | 13079 | 12127 | 60 | 60 | 0.46% | 0.49% | 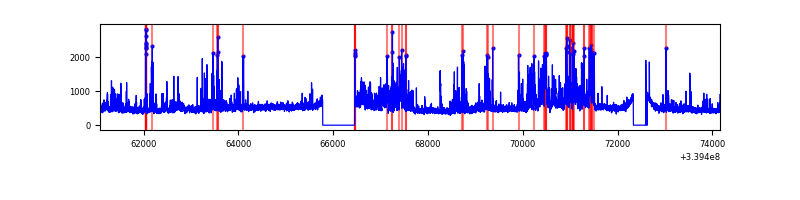 |
| B | 13079 | 12127 | 14 | 14 | 0.11% | 0.12% | 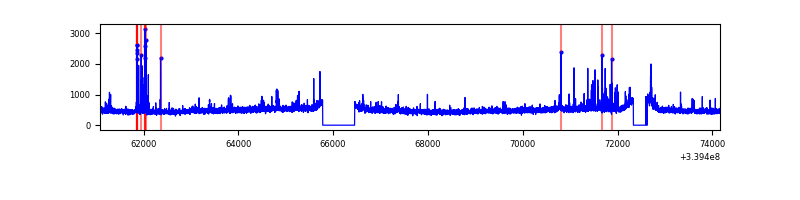 |
| C | 13079 | 12127 | 5 | 5 | 0.04% | 0.04% | 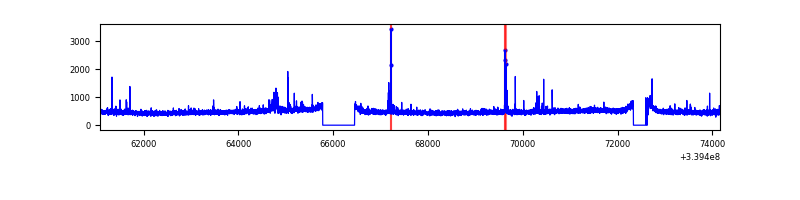 |
| D | 13079 | 12127 | 450 | 450 | 3.44% | 3.71% | 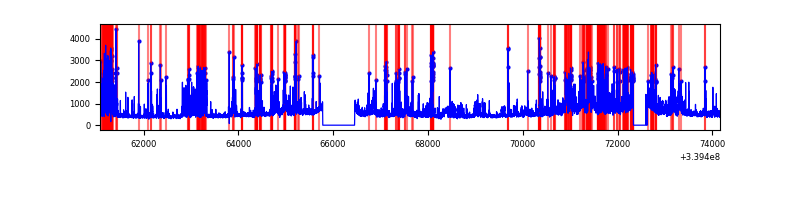 |
Top three noisy pixels from each quadrant. If the there are fewer than three noisy pixels in the level2.evt file, extra rows are filled as -1
| Pixel properties | Quadrant properties | ||||||
|---|---|---|---|---|---|---|---|
| Quadrant | DetID | PixID | Counts | Sigma | Mean | Median | Sigma |
| A | 6 | 16 | 949494 | 3245.66 | 1458 | 1423 | 292.1 |
| A | 14 | 235 | 608046 | 2076.74 | 1458 | 1423 | 292.1 |
| A | 12 | 189 | 27901 | 90.65 | 1458 | 1423 | 292.1 |
| B | 3 | 112 | 142191 | 504.87 | 1463 | 1423 | 278.8 |
| B | 3 | 64 | 93923 | 331.75 | 1463 | 1423 | 278.8 |
| B | 10 | 245 | 70669 | 248.35 | 1463 | 1423 | 278.8 |
| C | 14 | 238 | 227015 | 678.22 | 1417 | 1426 | 332.6 |
| C | 15 | 208 | 76345 | 225.24 | 1417 | 1426 | 332.6 |
| C | 3 | 233 | 49611 | 144.87 | 1417 | 1426 | 332.6 |
| D | 1 | 52 | 2803486 | 7845.51 | 1385 | 1357 | 357.2 |
| D | 7 | 38 | 371135 | 1035.32 | 1385 | 1357 | 357.2 |
| D | 2 | 250 | 320031 | 892.24 | 1385 | 1357 | 357.2 |
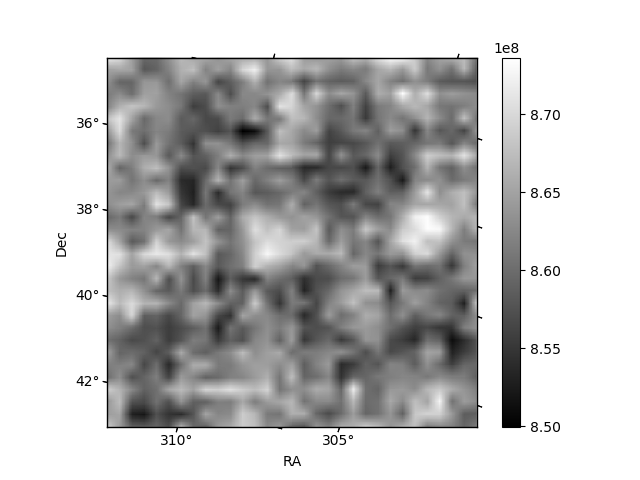
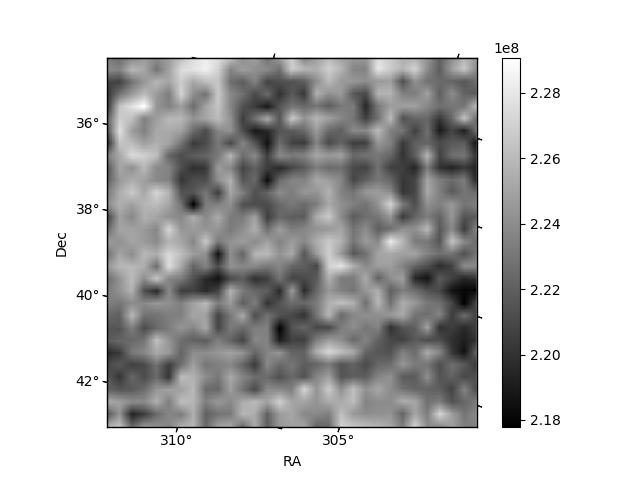
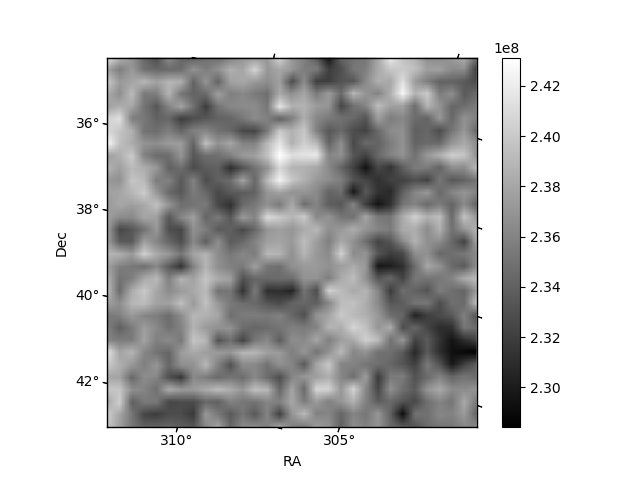
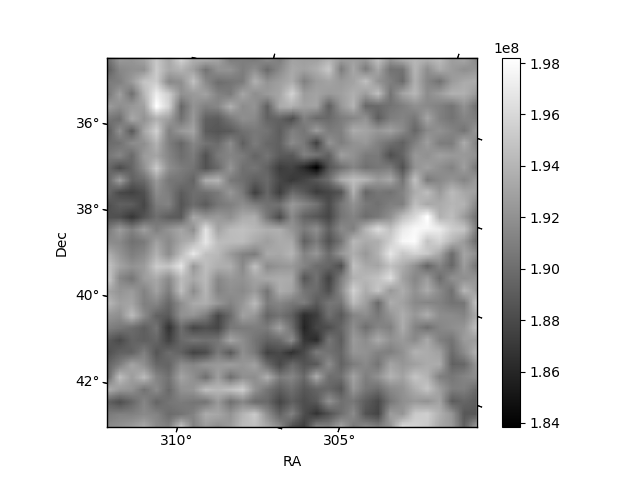
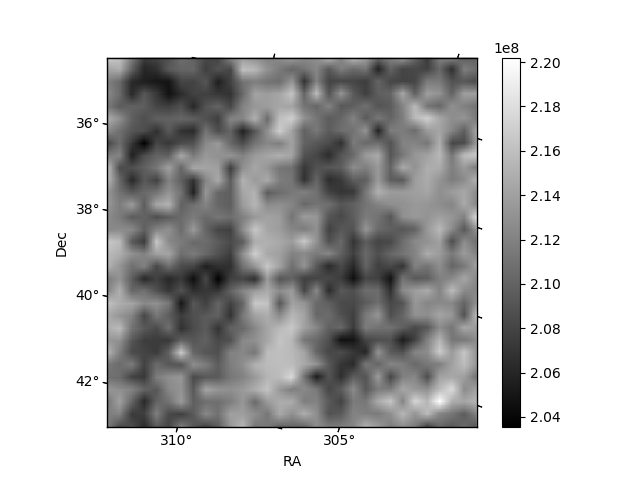
Histogram calculated using DETX and DETY for each event in the final _common_clean file
| Quadrant A | 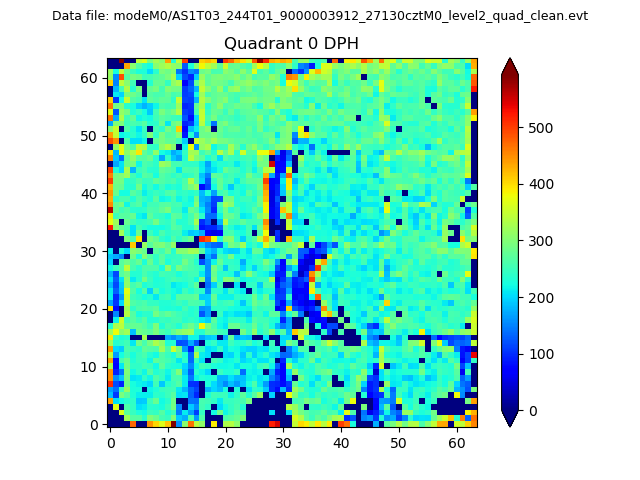 |
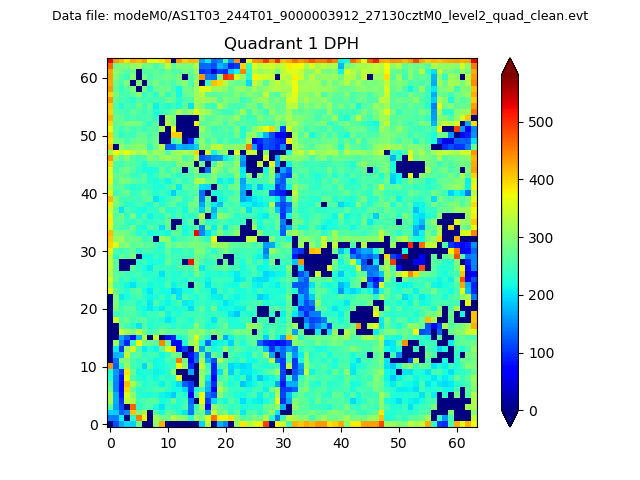 |
Quadrant B |
|---|---|---|---|
| Quadrant D | 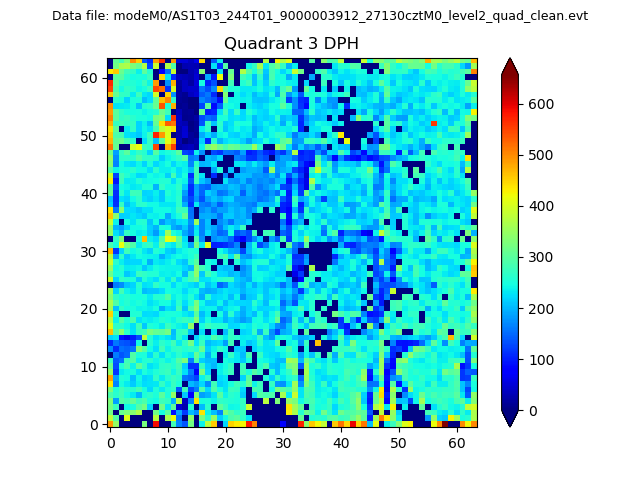 |
 |
Quadrant C |
| Plot type | Count rate plots | Images |
|---|---|---|
| Comparison with Poisson distribution Blue bars denote a histogram of data divided into 1 sec bins. Red curve is a Poisson curve with rate = median count rate of data. |
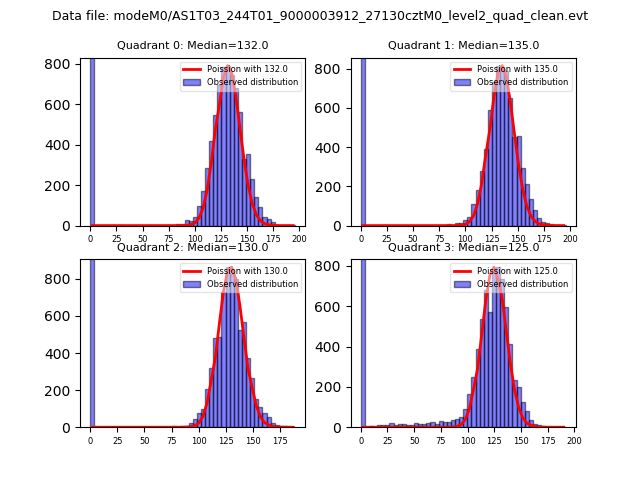 |
 |
| Quadrant-wise count rates Data is divided into 100 sec bins |
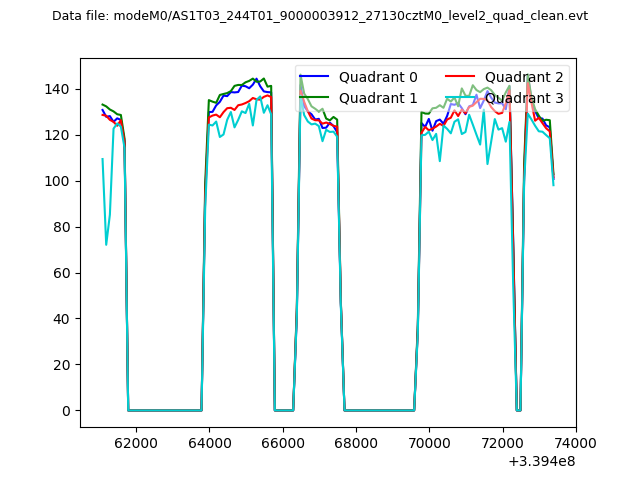 |
|
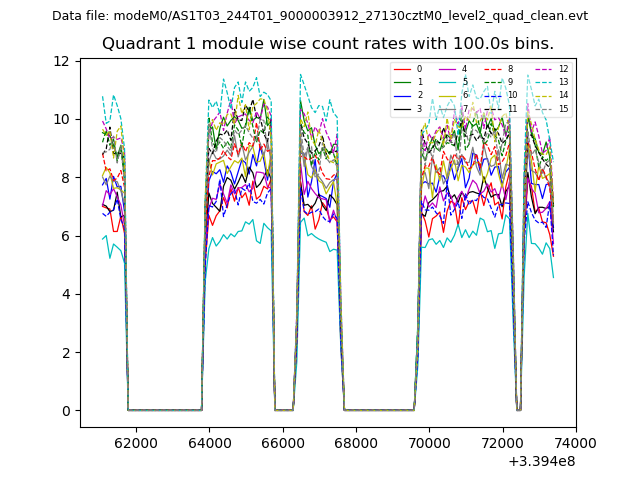
| Module-wise count rates for Quadrant A Data is divided into 100 sec bins |
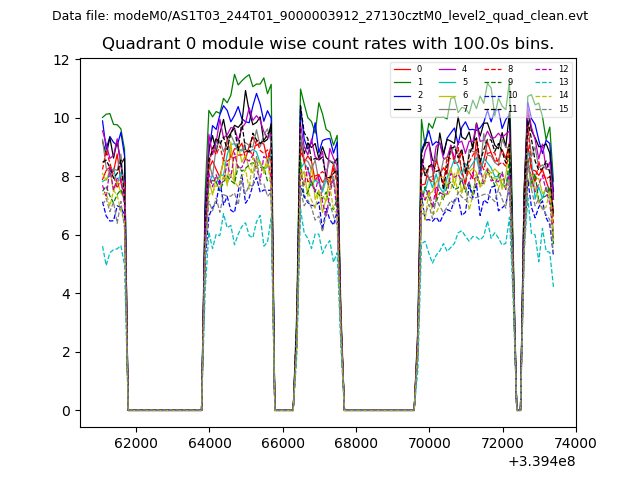 |
 |
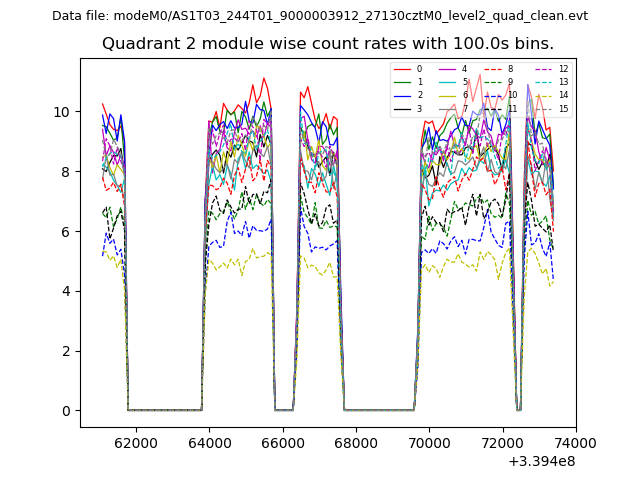
| Module-wise count rates for Quadrant B Data is divided into 100 sec bins |
 |
 |
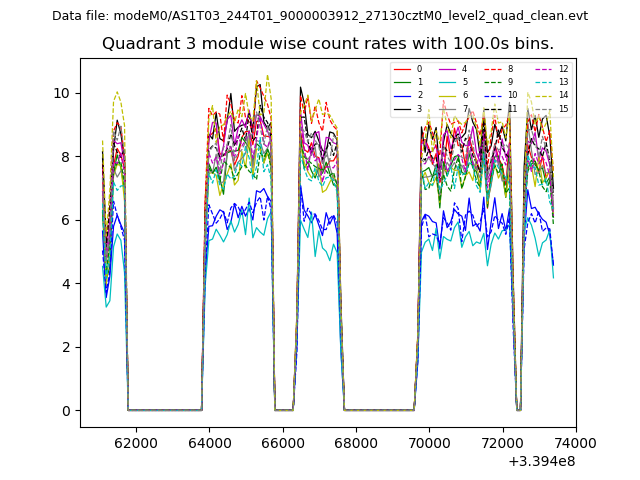
| Module-wise count rates for Quadrant C Data is divided into 100 sec bins |
 |
 |
| Module-wise count rates for Quadrant D Data is divided into 100 sec bins |
 |
 |
| Parameter | Plot |
|---|---|
| CZT HV Monitor | 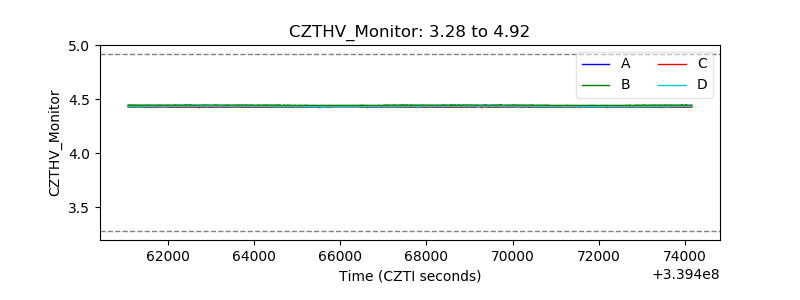 |
| D_VDD | 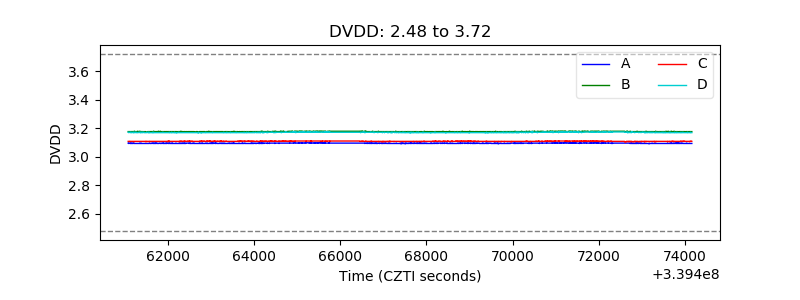 |
| Temperature 1 | 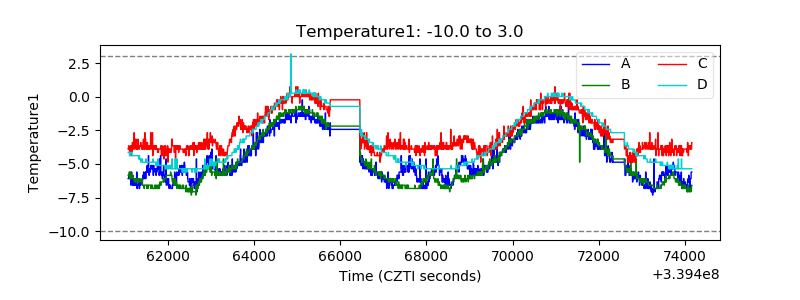 |
| Veto HV Monitor | 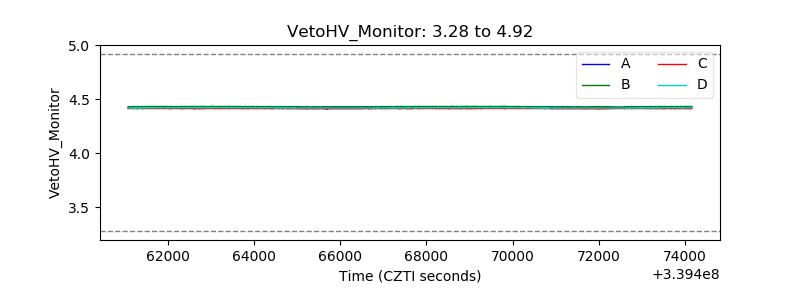 |
| Veto LLD | 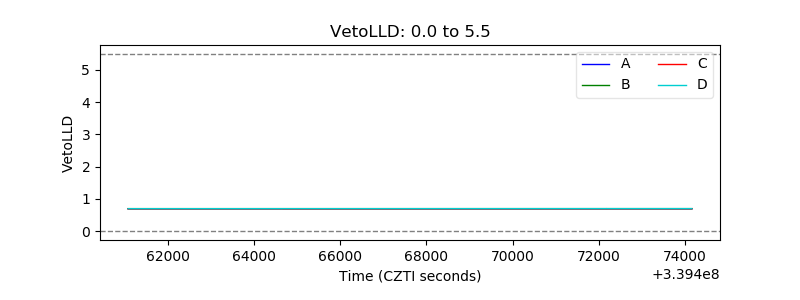 |
| Alpha Counter | 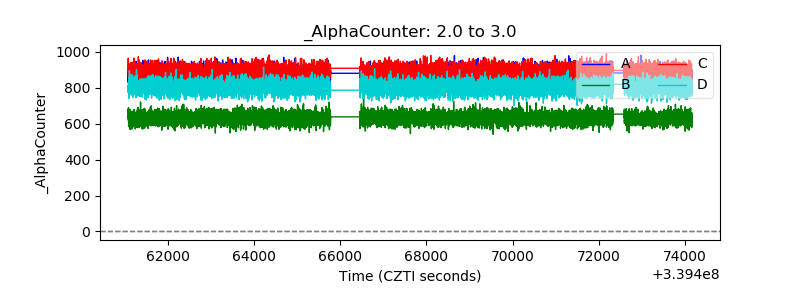 |
| _CPM_Rate | 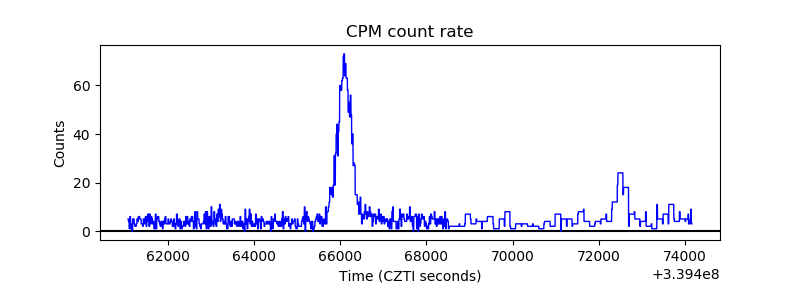 |
| CZT Counter | 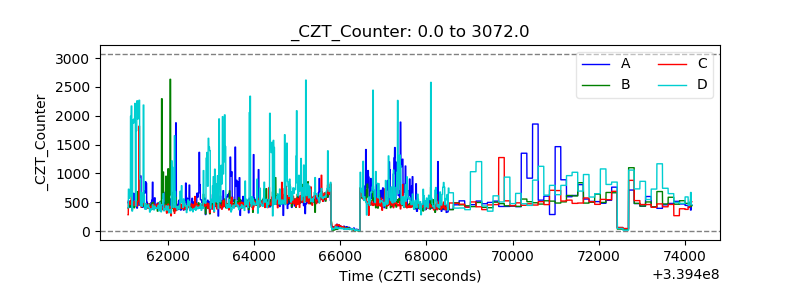 |
| +2.5 Volts monitor |  |
| +5 Volts monitor |  |
| _ROLL_ROT | 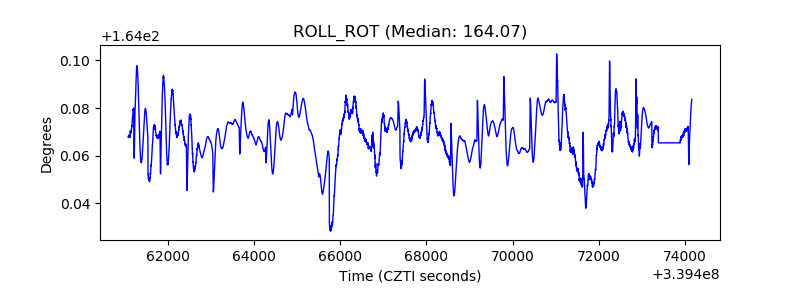 |
| _Roll_DEC |  |
| _Roll_RA | 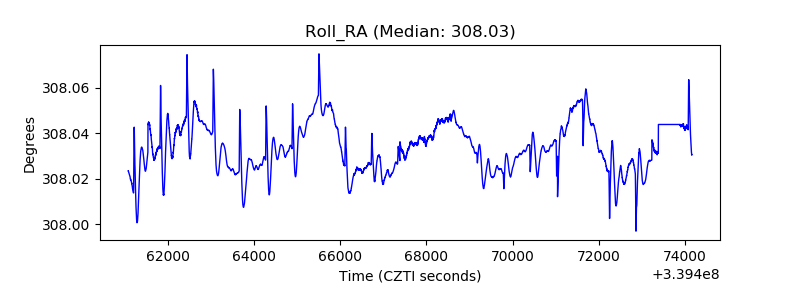 |
| Veto Counter | 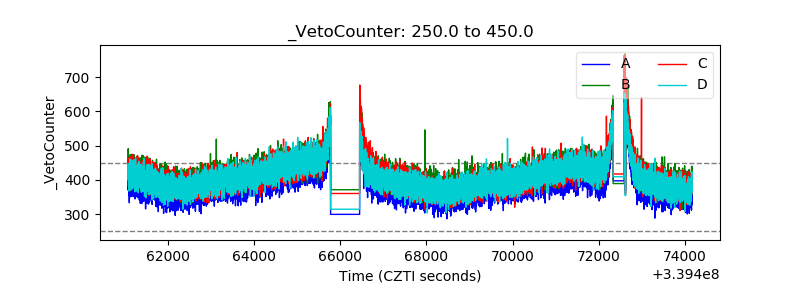 |