| Param | Original file | Final file |
|---|---|---|
| Filename | modeM0/AS1T03_244T01_9000003912_27134cztM0_level2.evt | modeM0/AS1T03_244T01_9000003912_27134cztM0_level2_quad_clean.evt |
| Size (bytes) | 1,457,596,800 | 231,111,360 |
| Size | 1.4 GB | 220.4 MB |
| Events in quadrant A | 9,490,419 | 1,456,349 |
| Events in quadrant B | 9,505,267 | 1,491,078 |
| Events in quadrant C | 8,936,361 | 1,430,480 |
| Events in quadrant D | 14,957,568 | 1,341,525 |
| Mode M9 | |||
|---|---|---|---|
| Quadrant | BADHDUFLAG | Total packets | Discarded packets |
| A | 0 | 19 | 0 |
| B | 0 | 19 | 0 |
| C | 0 | 19 | 0 |
| D | 0 | 19 | 0 |
| Mode M0 | |||
|---|---|---|---|
| Quadrant | BADHDUFLAG | Total packets | Discarded packets |
| A | 0 | 39981 | 0 |
| B | 0 | 39745 | 0 |
| C | 0 | 38087 | 0 |
| D | 0 | 56936 | 0 |
| Quadrant | Total seconds | Saturated seconds | Saturation percentage |
|---|---|---|---|
| A | 18580 | 344 | 1.851453% |
| B | 18581 | 311 | 1.673753% |
| C | 18581 | 253 | 1.361606% |
| D | 18581 | 1444 | 7.771379% |
Noise dominated data is calculated using 1-second bins in cleaned event files. If a bin has >2000 counts, and if more than 50% of those come from <1% of pixels, then it is considered to be noise-dominated and hence unusable.
| Quadrant | # 1 sec bins | Bins with >0 counts | Bins with >2000 counts | High rate bins dominated by noise | Noise dominated (total time) | Noise dominated (detector-on time) | Marked lightcurve |
|---|---|---|---|---|---|---|---|
| A | 20425 | 18583 | 101 | 101 | 0.49% | 0.54% | 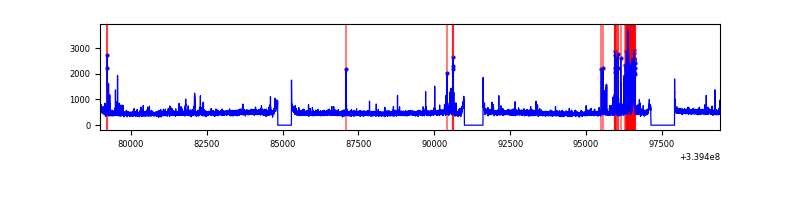 |
| B | 20426 | 18584 | 56 | 56 | 0.27% | 0.30% | 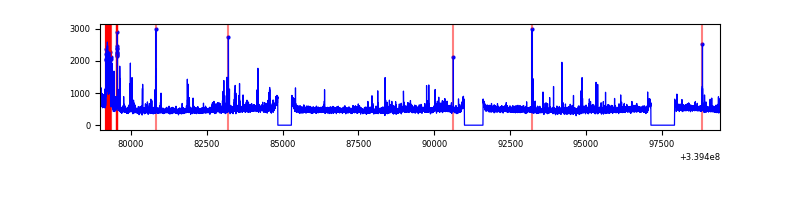 |
| C | 20426 | 18584 | 6 | 6 | 0.03% | 0.03% | 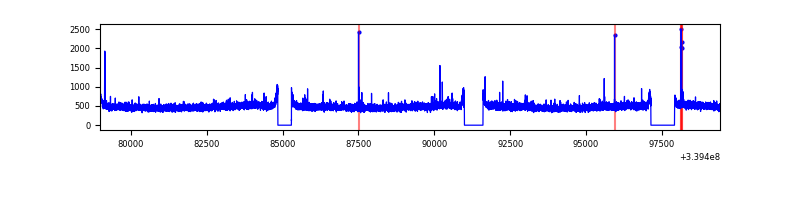 |
| D | 20426 | 18584 | 1221 | 1221 | 5.98% | 6.57% | 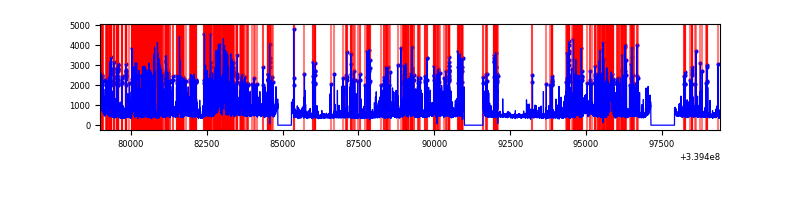 |
Top three noisy pixels from each quadrant. If the there are fewer than three noisy pixels in the level2.evt file, extra rows are filled as -1
| Pixel properties | Quadrant properties | ||||||
|---|---|---|---|---|---|---|---|
| Quadrant | DetID | PixID | Counts | Sigma | Mean | Median | Sigma |
| A | 14 | 235 | 758112 | 1677.74 | 2247 | 2198 | 450.6 |
| A | 13 | 254 | 30720 | 63.3 | 2247 | 2198 | 450.6 |
| A | 12 | 189 | 28313 | 57.96 | 2247 | 2198 | 450.6 |
| B | 10 | 245 | 474321 | 1105.45 | 2244 | 2179 | 427.1 |
| B | 3 | 112 | 145959 | 336.64 | 2244 | 2179 | 427.1 |
| B | 12 | 111 | 53672 | 120.56 | 2244 | 2179 | 427.1 |
| C | 14 | 238 | 343692 | 668.77 | 2172 | 2185 | 510.6 |
| C | 15 | 208 | 75375 | 143.33 | 2172 | 2185 | 510.6 |
| C | 2 | 16 | 20981 | 36.81 | 2172 | 2185 | 510.6 |
| D | 1 | 52 | 5816902 | 10987.59 | 2117 | 2065 | 529.2 |
| D | 7 | 38 | 489062 | 920.22 | 2117 | 2065 | 529.2 |
| D | 2 | 250 | 349281 | 656.09 | 2117 | 2065 | 529.2 |
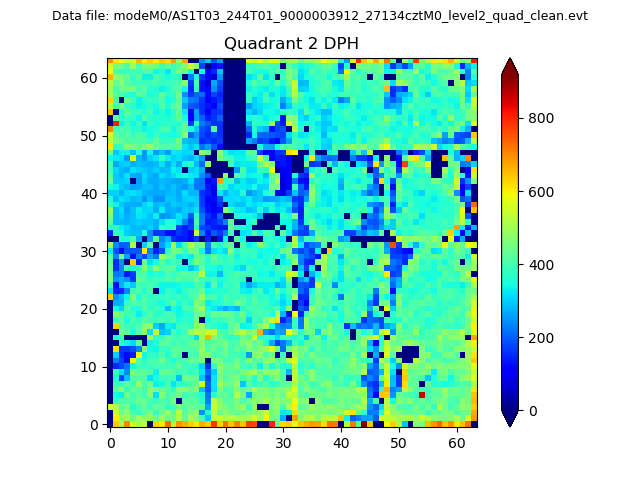
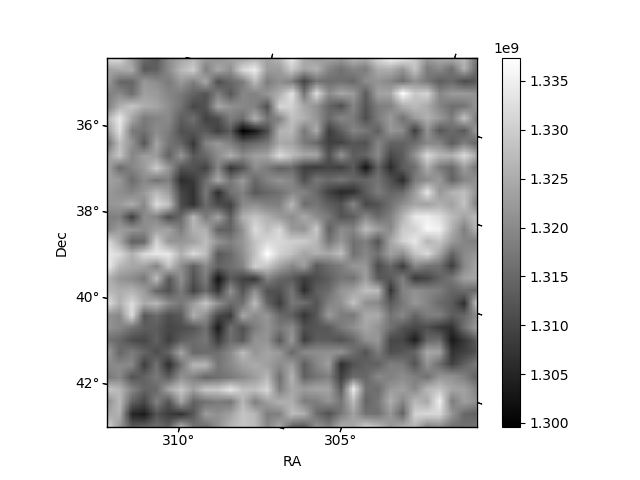
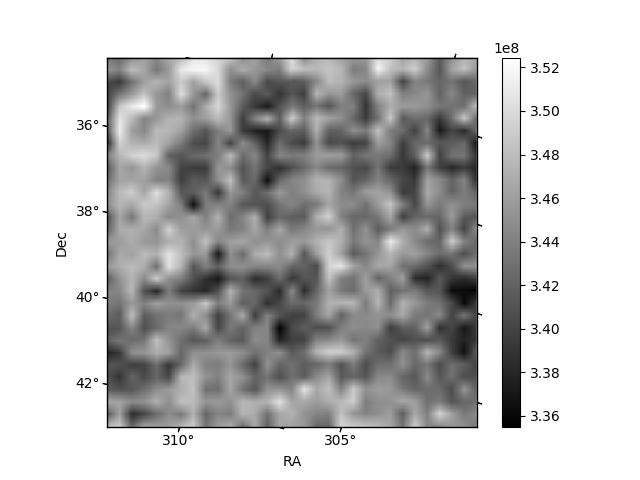
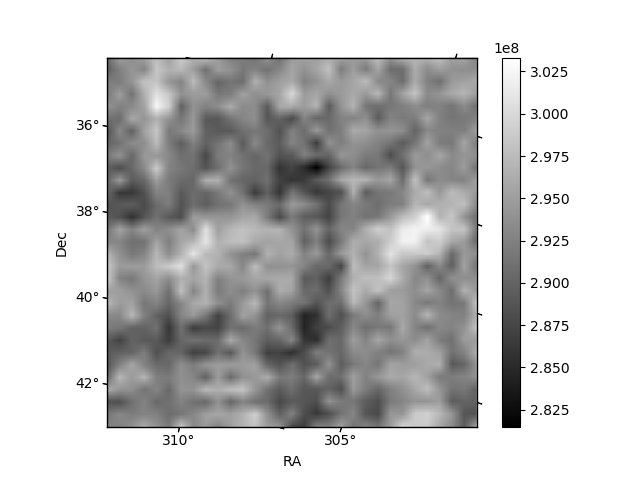
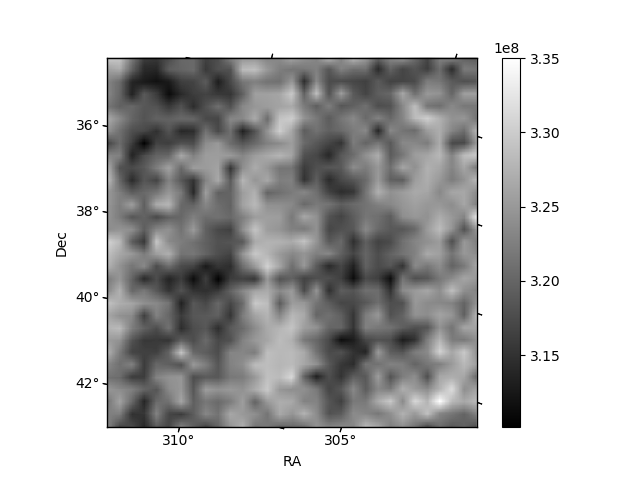
Histogram calculated using DETX and DETY for each event in the final _common_clean file
| Quadrant A | 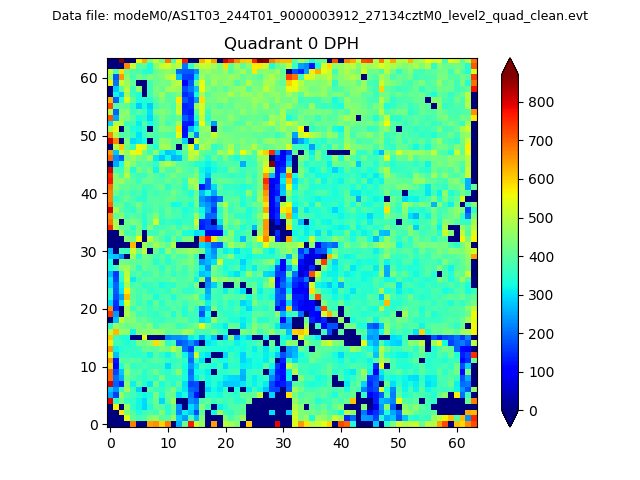 |
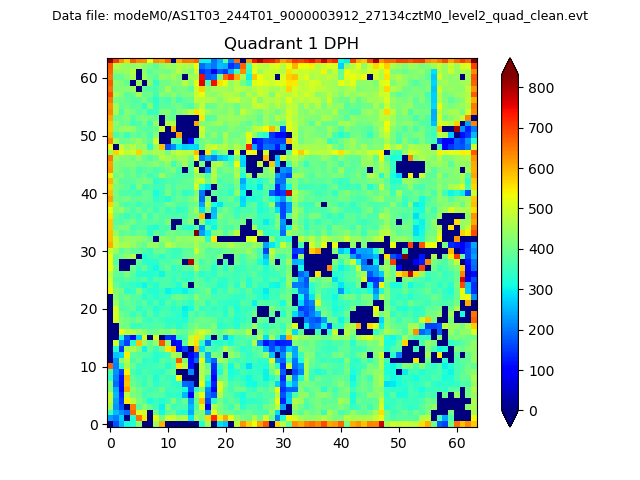 |
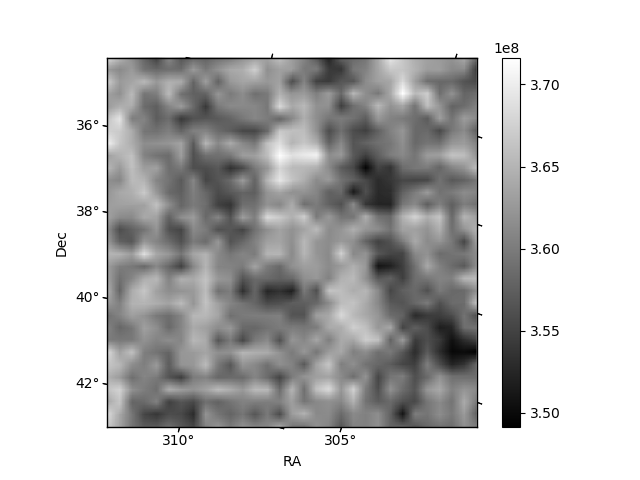
Quadrant B |
|---|---|---|---|
| Quadrant D | 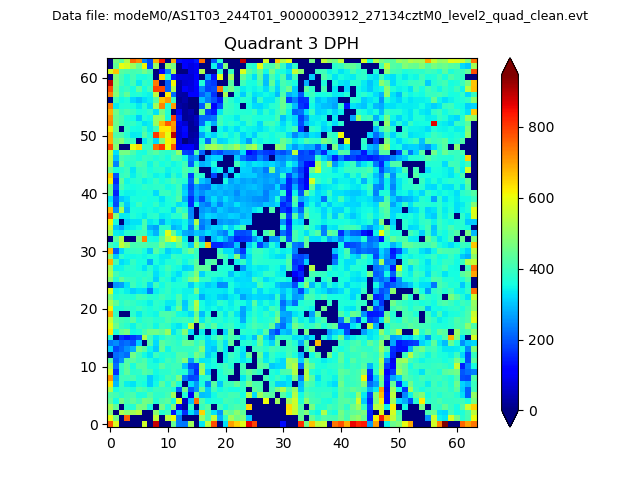 |
 |
Quadrant C |
| Plot type | Count rate plots | Images |
|---|---|---|
| Comparison with Poisson distribution Blue bars denote a histogram of data divided into 1 sec bins. Red curve is a Poisson curve with rate = median count rate of data. |
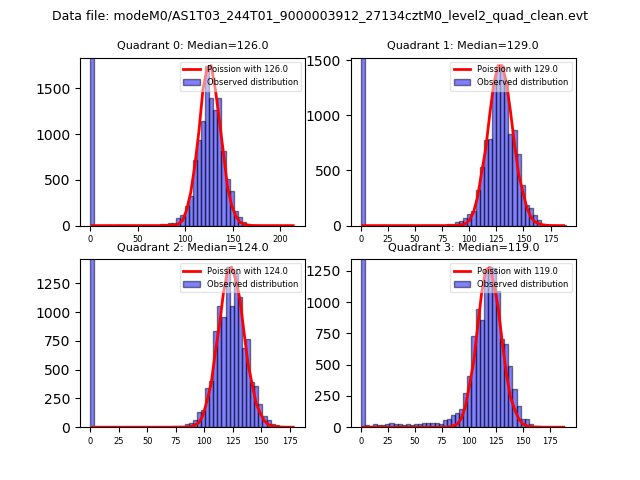 |
 |
| Quadrant-wise count rates Data is divided into 100 sec bins |
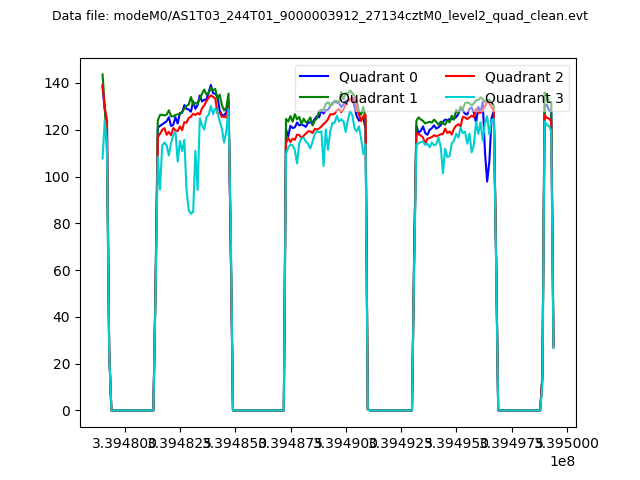 |
|
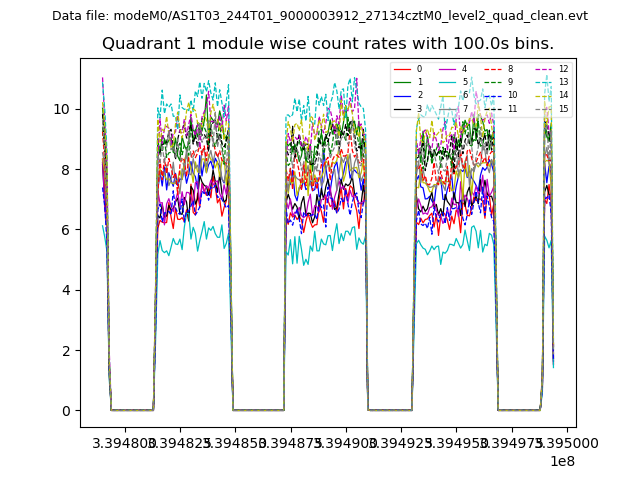
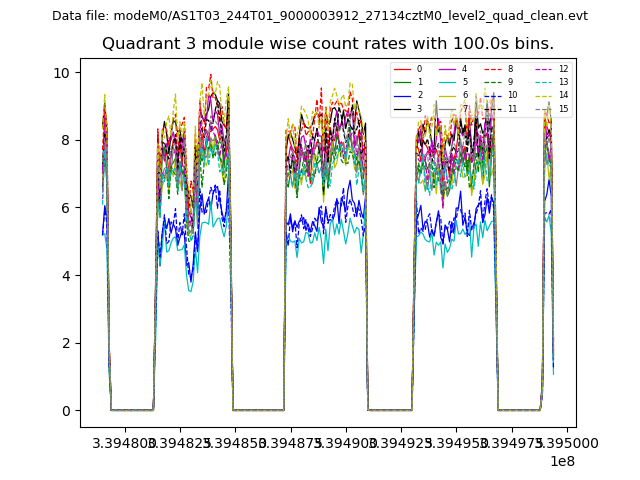
| Module-wise count rates for Quadrant A Data is divided into 100 sec bins |
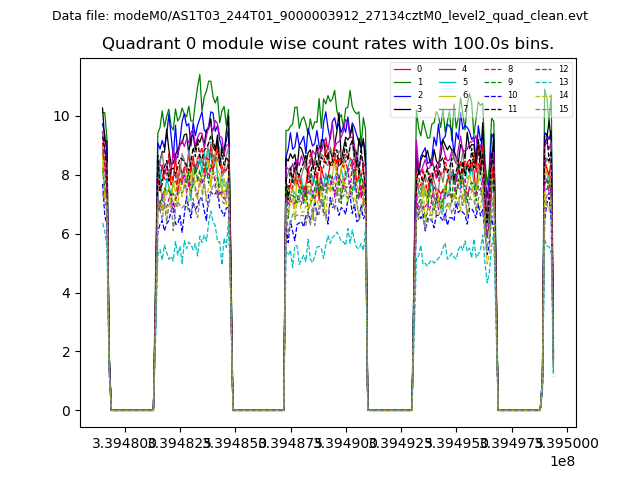 |
 |
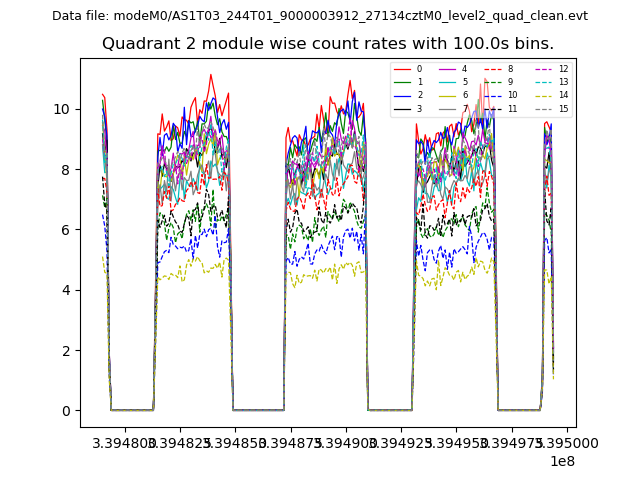
| Module-wise count rates for Quadrant B Data is divided into 100 sec bins |
 |
 |
| Module-wise count rates for Quadrant C Data is divided into 100 sec bins |
 |
 |
| Module-wise count rates for Quadrant D Data is divided into 100 sec bins |
 |
 |
| Parameter | Plot |
|---|---|
| CZT HV Monitor | 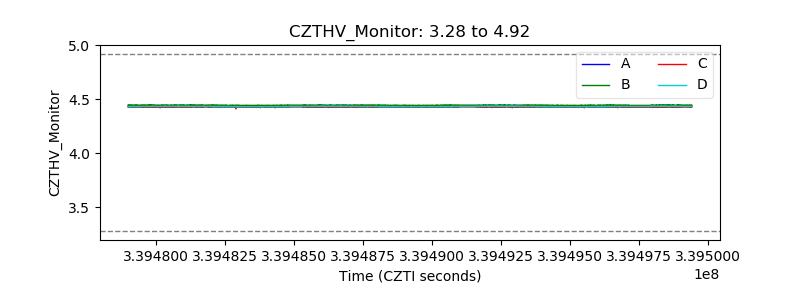 |
| D_VDD | 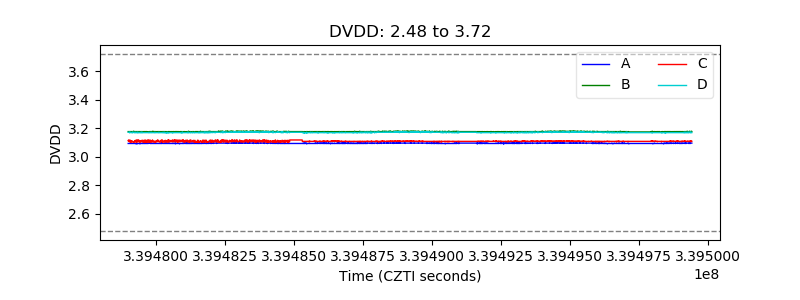 |
| Temperature 1 | 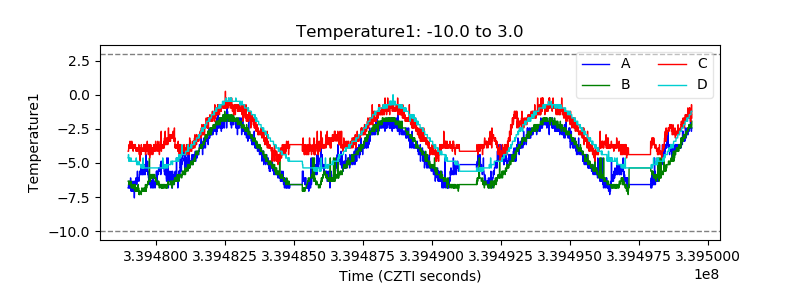 |
| Veto HV Monitor |  |
| Veto LLD | 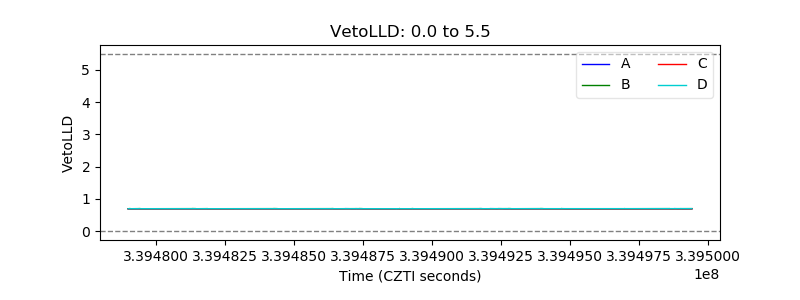 |
| Alpha Counter | 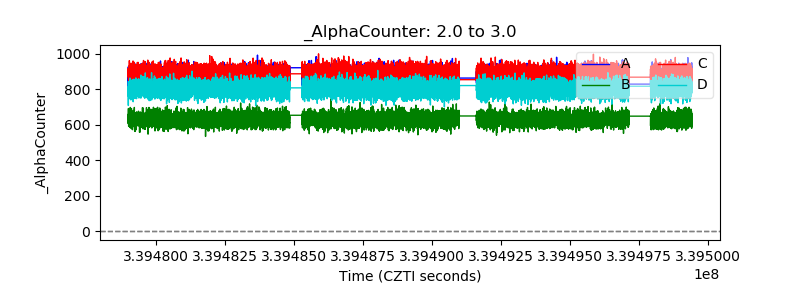 |
| _CPM_Rate | 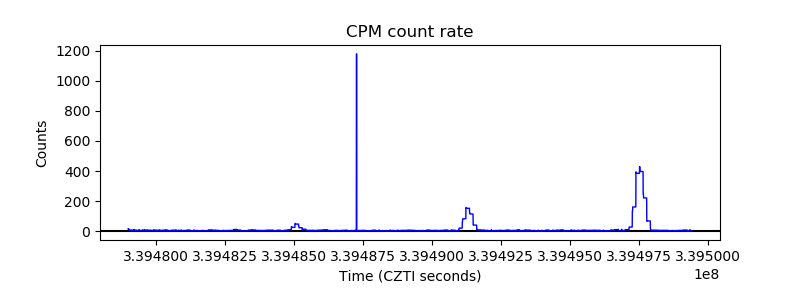 |
| CZT Counter | 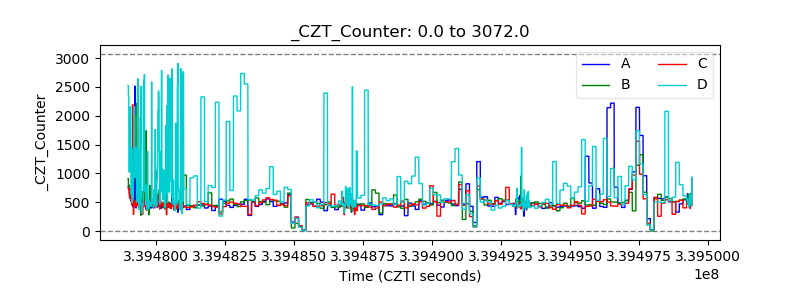 |
| +2.5 Volts monitor |  |
| +5 Volts monitor |  |
| _ROLL_ROT | 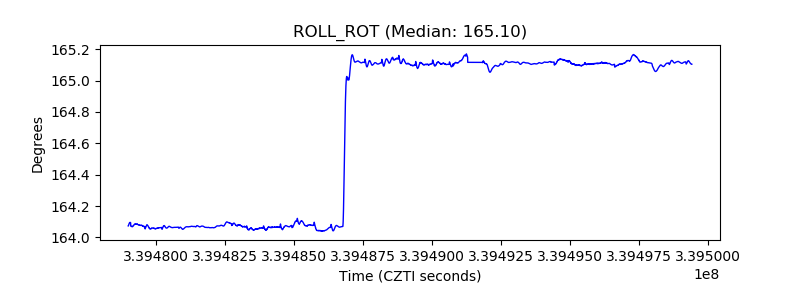 |
| _Roll_DEC | 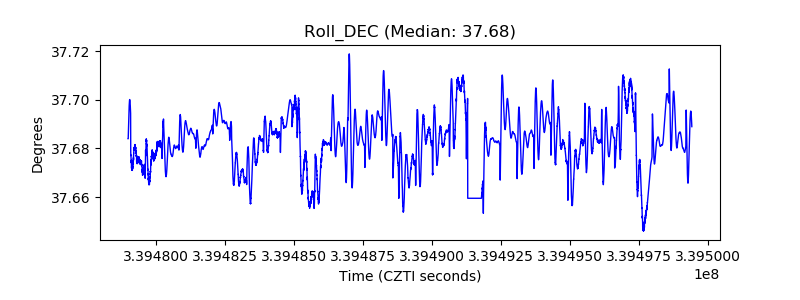 |
| _Roll_RA | 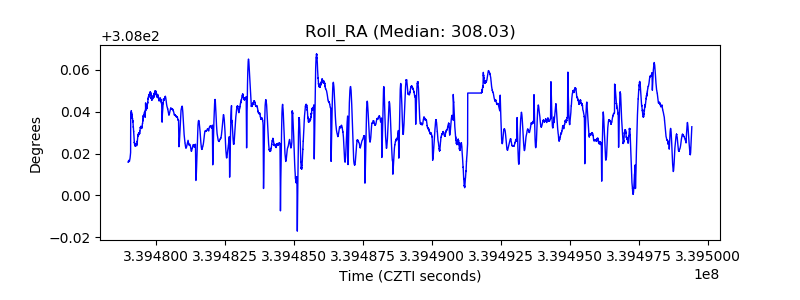 |
| Veto Counter | 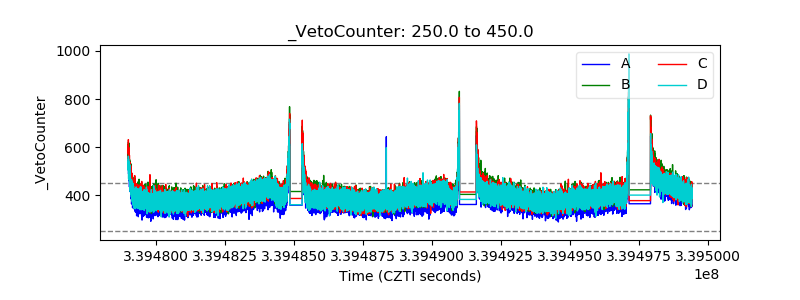 |