| Param | Original file | Final file |
|---|---|---|
| Filename | modeM0/AS1T03_244T01_9000003912_27135cztM0_level2.evt | modeM0/AS1T03_244T01_9000003912_27135cztM0_level2_quad_clean.evt |
| Size (bytes) | 523,863,360 | 93,009,600 |
| Size | 499.6 MB | 88.7 MB |
| Events in quadrant A | 3,653,883 | 602,093 |
| Events in quadrant B | 3,378,152 | 615,105 |
| Events in quadrant C | 3,310,939 | 584,797 |
| Events in quadrant D | 5,065,895 | 545,515 |
| Mode M9 | |||
|---|---|---|---|
| Quadrant | BADHDUFLAG | Total packets | Discarded packets |
| A | 0 | 10 | 0 |
| B | 0 | 10 | 0 |
| C | 0 | 10 | 0 |
| D | 0 | 10 | 0 |
| Mode M0 | |||
|---|---|---|---|
| Quadrant | BADHDUFLAG | Total packets | Discarded packets |
| A | 0 | 14999 | 0 |
| B | 0 | 14134 | 0 |
| C | 0 | 13966 | 0 |
| D | 0 | 19365 | 0 |
| Quadrant | Total seconds | Saturated seconds | Saturation percentage |
|---|---|---|---|
| A | 6730 | 100 | 1.485884% |
| B | 6731 | 66 | 0.980538% |
| C | 6731 | 97 | 1.441093% |
| D | 6730 | 450 | 6.686478% |
Noise dominated data is calculated using 1-second bins in cleaned event files. If a bin has >2000 counts, and if more than 50% of those come from <1% of pixels, then it is considered to be noise-dominated and hence unusable.
| Quadrant | # 1 sec bins | Bins with >0 counts | Bins with >2000 counts | High rate bins dominated by noise | Noise dominated (total time) | Noise dominated (detector-on time) | Marked lightcurve |
|---|---|---|---|---|---|---|---|
| A | 7680 | 6731 | 17 | 17 | 0.22% | 0.25% | 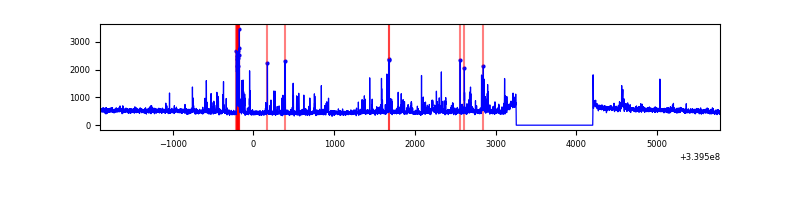 |
| B | 7681 | 6732 | 4 | 4 | 0.05% | 0.06% | 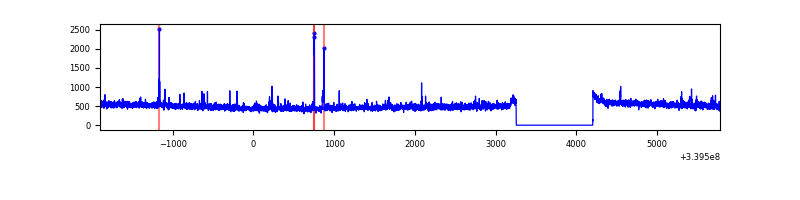 |
| C | 7681 | 6732 | 4 | 4 | 0.05% | 0.06% | 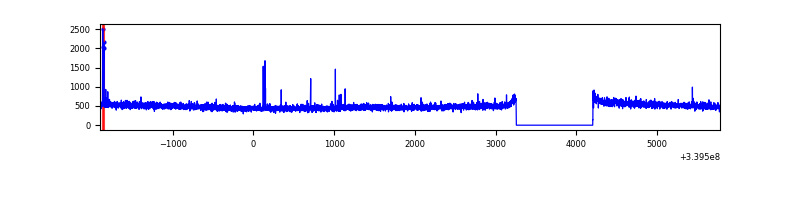 |
| D | 7680 | 6731 | 383 | 383 | 4.99% | 5.69% | 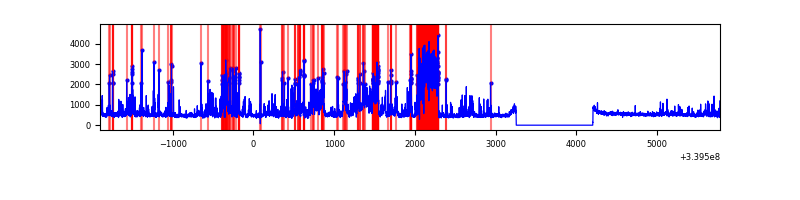 |
Top three noisy pixels from each quadrant. If the there are fewer than three noisy pixels in the level2.evt file, extra rows are filled as -1
| Pixel properties | Quadrant properties | ||||||
|---|---|---|---|---|---|---|---|
| Quadrant | DetID | PixID | Counts | Sigma | Mean | Median | Sigma |
| A | 14 | 235 | 312172 | 1832.71 | 844 | 827 | 169.9 |
| A | 6 | 16 | 63096 | 366.54 | 844 | 827 | 169.9 |
| A | 12 | 189 | 19028 | 107.14 | 844 | 827 | 169.9 |
| B | 3 | 112 | 54918 | 338.38 | 835 | 811 | 159.9 |
| B | 10 | 246 | 25093 | 151.86 | 835 | 811 | 159.9 |
| B | 12 | 111 | 19749 | 118.44 | 835 | 811 | 159.9 |
| C | 14 | 238 | 129634 | 683.29 | 804 | 809 | 188.5 |
| C | 15 | 208 | 39917 | 207.43 | 804 | 809 | 188.5 |
| C | 13 | 61 | 5426 | 24.49 | 804 | 809 | 188.5 |
| D | 7 | 38 | 1029678 | 5302.72 | 789 | 772 | 194.0 |
| D | 1 | 52 | 750377 | 3863.27 | 789 | 772 | 194.0 |
| D | 2 | 250 | 240819 | 1237.14 | 789 | 772 | 194.0 |
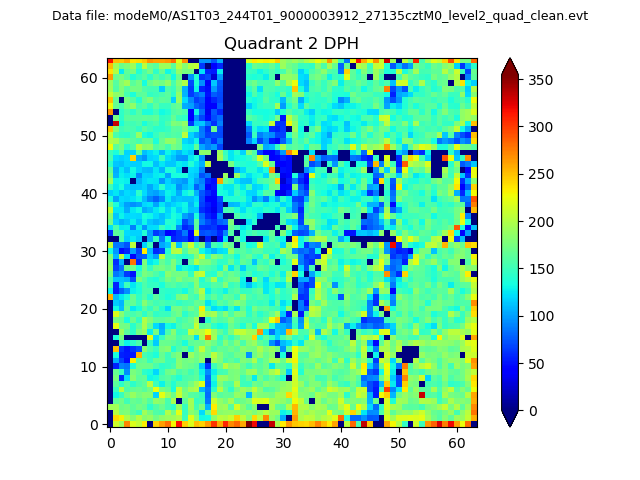
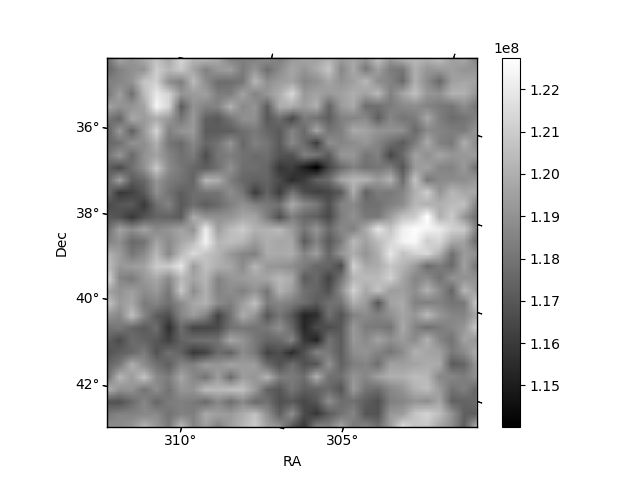
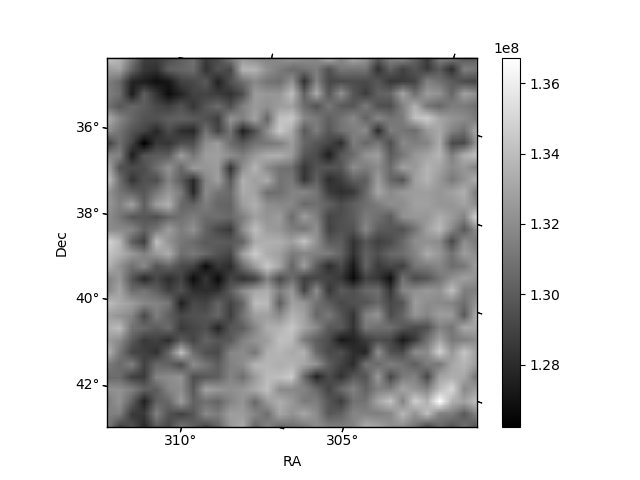
Histogram calculated using DETX and DETY for each event in the final _common_clean file
| Quadrant A | 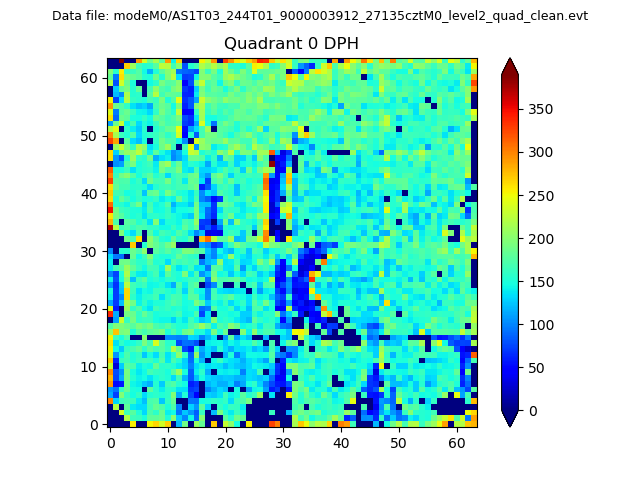 |
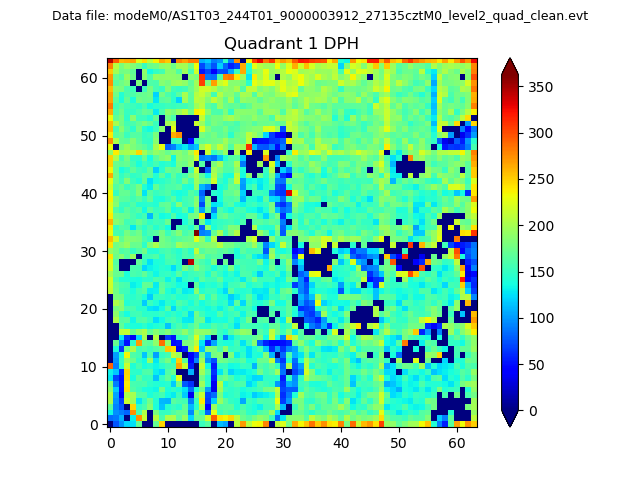 |
Quadrant B |
|---|---|---|---|
| Quadrant D | 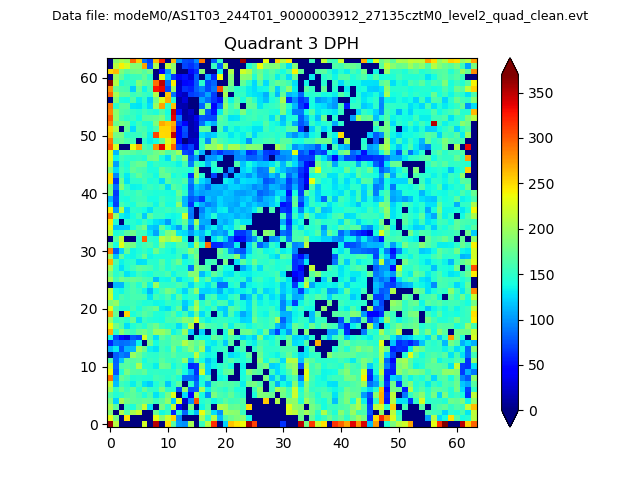 |
 |
Quadrant C |
| Plot type | Count rate plots | Images |
|---|---|---|
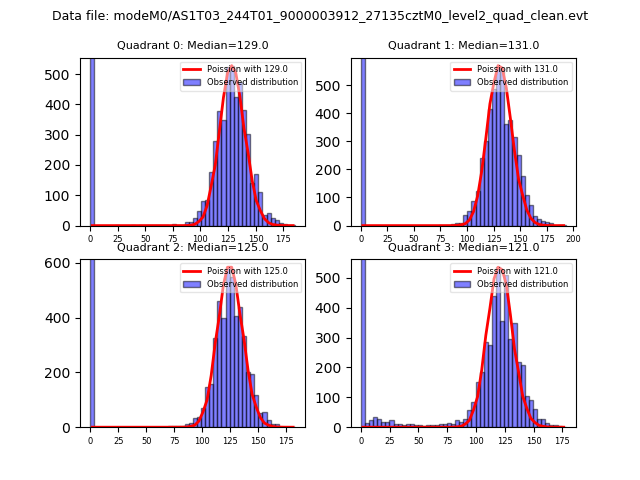
| Comparison with Poisson distribution Blue bars denote a histogram of data divided into 1 sec bins. Red curve is a Poisson curve with rate = median count rate of data. |
 |
 |
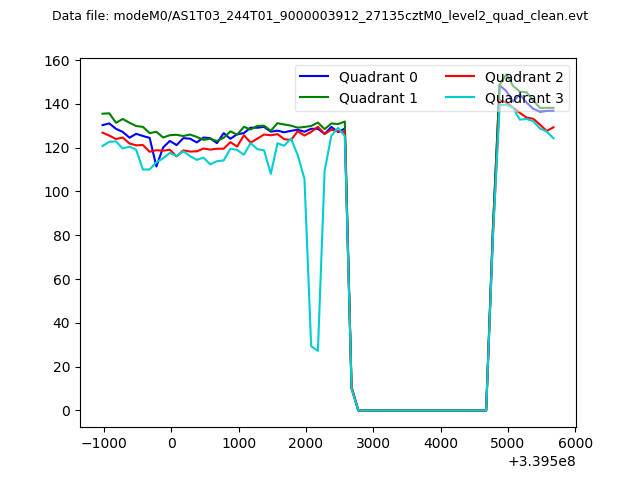
| Quadrant-wise count rates Data is divided into 100 sec bins |
 |
|
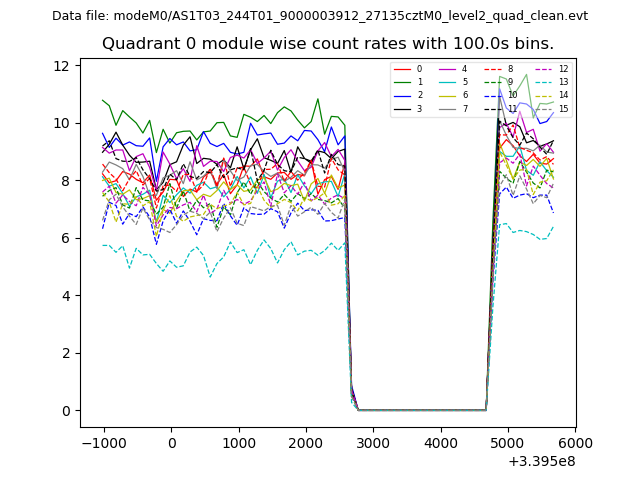
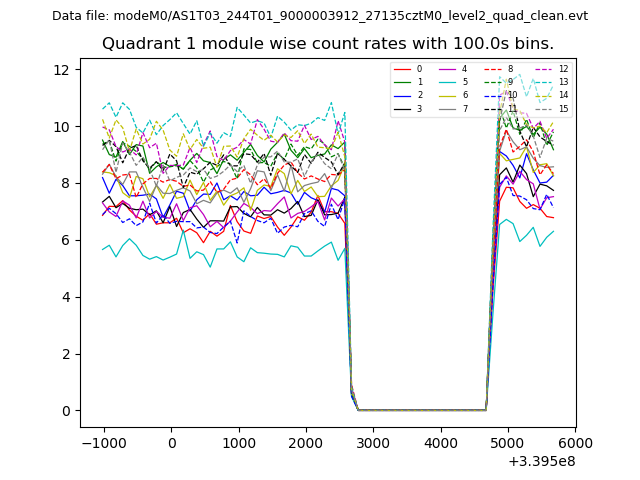
| Module-wise count rates for Quadrant A Data is divided into 100 sec bins |
 |
 |
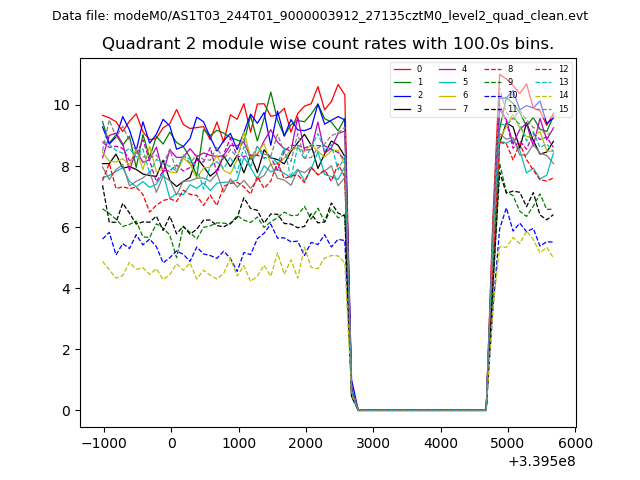
| Module-wise count rates for Quadrant B Data is divided into 100 sec bins |
 |
 |
| Module-wise count rates for Quadrant C Data is divided into 100 sec bins |
 |
 |
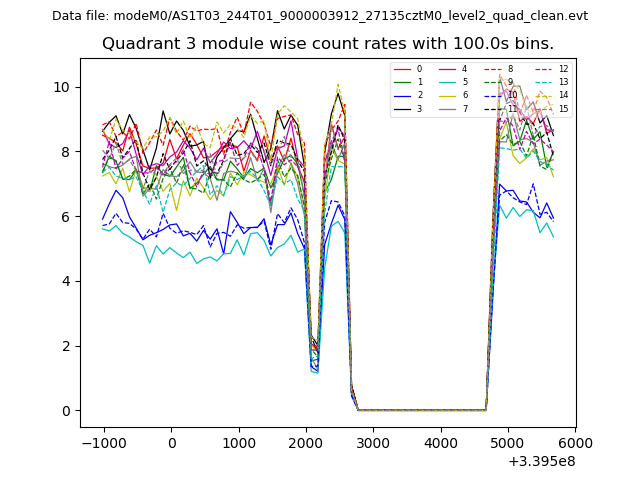
| Module-wise count rates for Quadrant D Data is divided into 100 sec bins |
 |
 |
| Parameter | Plot |
|---|---|
| CZT HV Monitor | 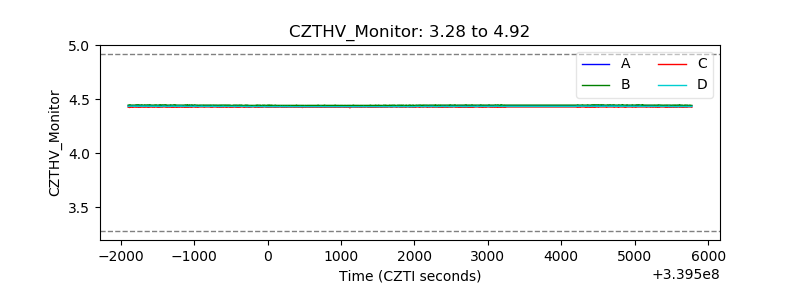 |
| D_VDD | 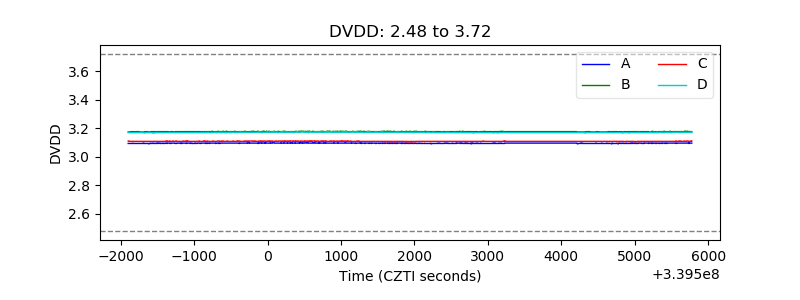 |
| Temperature 1 | 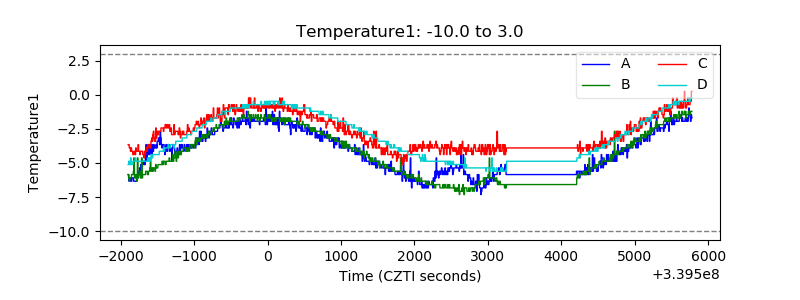 |
| Veto HV Monitor | 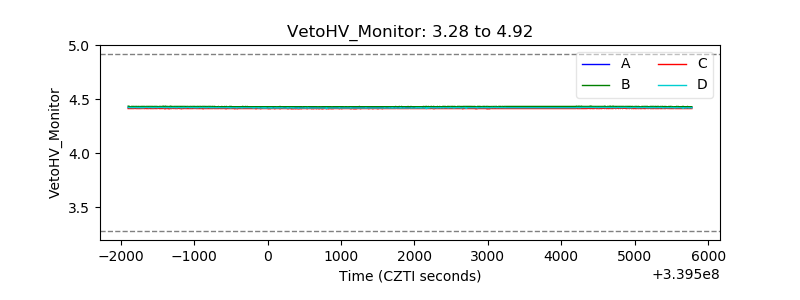 |
| Veto LLD | 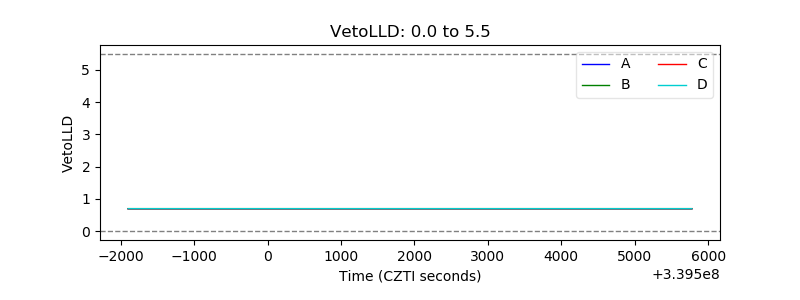 |
| Alpha Counter | 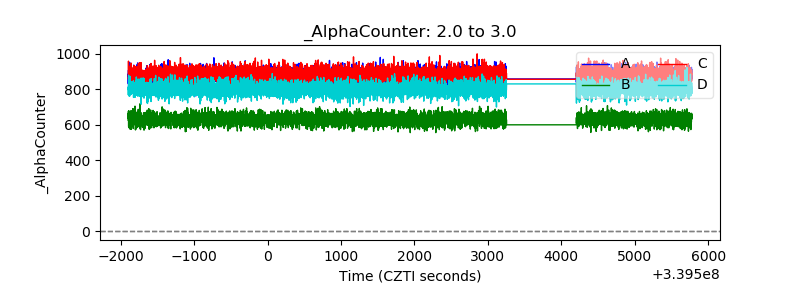 |
| _CPM_Rate | 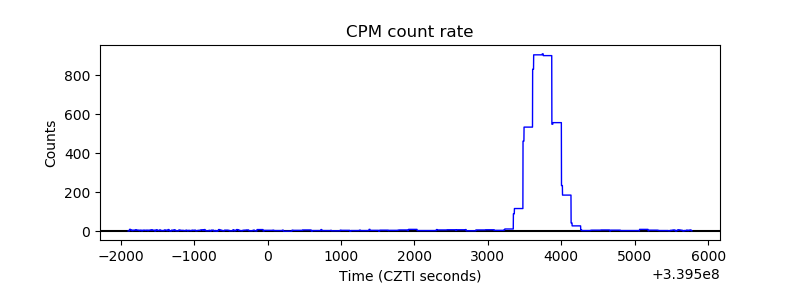 |
| CZT Counter |  |
| +2.5 Volts monitor | 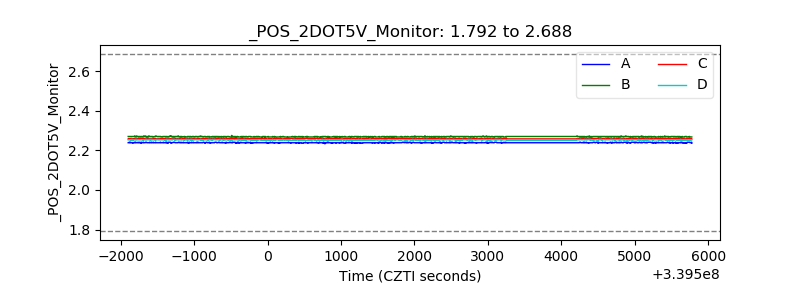 |
| +5 Volts monitor |  |
| _ROLL_ROT | 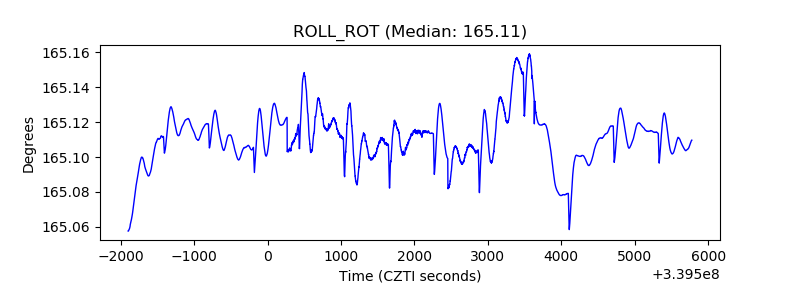 |
| _Roll_DEC | 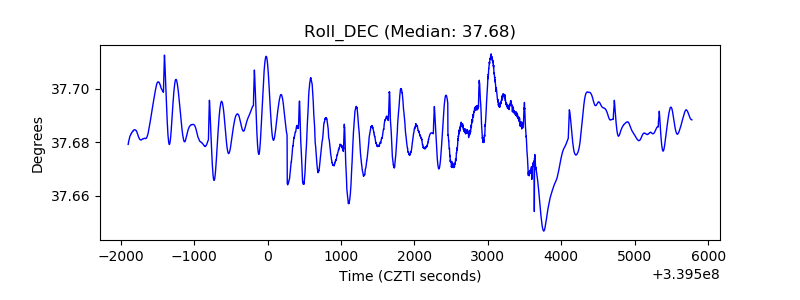 |
| _Roll_RA | 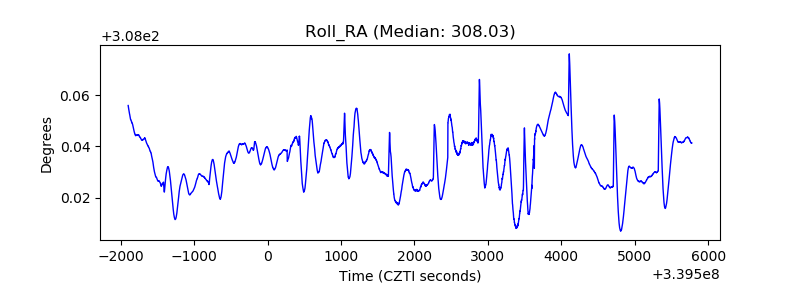 |
| Veto Counter | 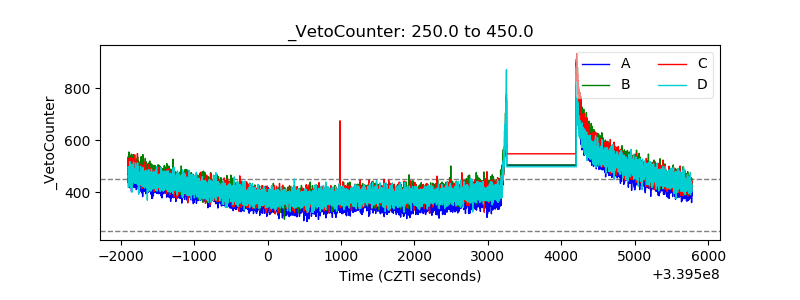 |