| Param | Original file | Final file |
|---|---|---|
| Filename | modeM0/AS1T03_244T01_9000003912_27137cztM0_level2.evt | modeM0/AS1T03_244T01_9000003912_27137cztM0_level2_quad_clean.evt |
| Size (bytes) | 452,185,920 | 99,132,480 |
| Size | 431.2 MB | 94.5 MB |
| Events in quadrant A | 2,937,171 | 668,086 |
| Events in quadrant B | 2,953,562 | 676,027 |
| Events in quadrant C | 2,910,476 | 634,296 |
| Events in quadrant D | 4,500,947 | 619,887 |
| Mode M9 | |||
|---|---|---|---|
| Quadrant | BADHDUFLAG | Total packets | Discarded packets |
| A | 0 | 11 | 0 |
| B | 0 | 11 | 0 |
| C | 0 | 11 | 0 |
| D | 0 | 11 | 0 |
| Mode M0 | |||
|---|---|---|---|
| Quadrant | BADHDUFLAG | Total packets | Discarded packets |
| A | 0 | 12475 | 0 |
| B | 0 | 12412 | 0 |
| C | 0 | 12305 | 0 |
| D | 0 | 17311 | 0 |
| Quadrant | Total seconds | Saturated seconds | Saturation percentage |
|---|---|---|---|
| A | 5777 | 51 | 0.882811% |
| B | 5777 | 48 | 0.830881% |
| C | 5776 | 81 | 1.402355% |
| D | 5777 | 219 | 3.790895% |
Noise dominated data is calculated using 1-second bins in cleaned event files. If a bin has >2000 counts, and if more than 50% of those come from <1% of pixels, then it is considered to be noise-dominated and hence unusable.
| Quadrant | # 1 sec bins | Bins with >0 counts | Bins with >2000 counts | High rate bins dominated by noise | Noise dominated (total time) | Noise dominated (detector-on time) | Marked lightcurve |
|---|---|---|---|---|---|---|---|
| A | 6887 | 5778 | 2 | 2 | 0.03% | 0.03% | 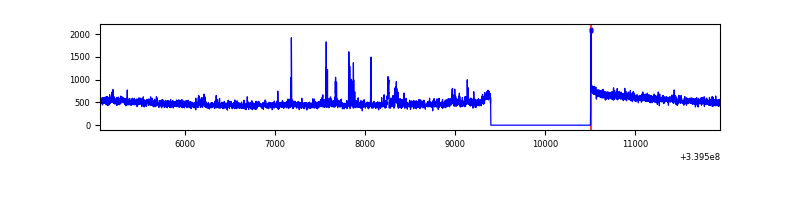 |
| B | 6887 | 5778 | 0 | 0 | 0.00% | 0.00% | 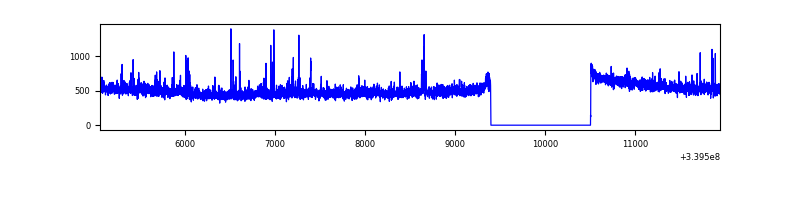 |
| C | 6886 | 5777 | 3 | 3 | 0.04% | 0.05% | 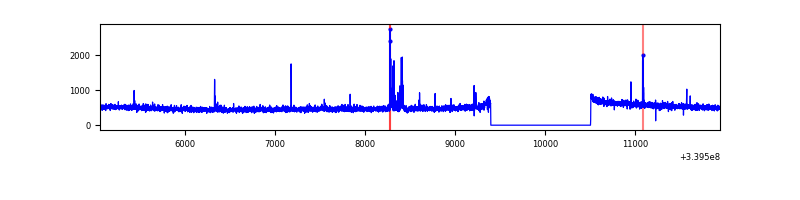 |
| D | 6887 | 5778 | 169 | 169 | 2.45% | 2.92% | 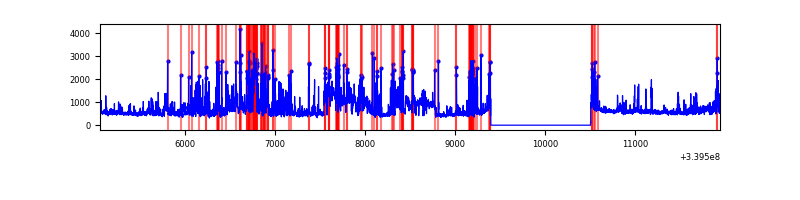 |
Top three noisy pixels from each quadrant. If the there are fewer than three noisy pixels in the level2.evt file, extra rows are filled as -1
| Pixel properties | Quadrant properties | ||||||
|---|---|---|---|---|---|---|---|
| Quadrant | DetID | PixID | Counts | Sigma | Mean | Median | Sigma |
| A | 14 | 235 | 81248 | 545.77 | 734 | 720 | 147.5 |
| A | 12 | 189 | 10246 | 64.56 | 734 | 720 | 147.5 |
| A | 13 | 254 | 9083 | 56.68 | 734 | 720 | 147.5 |
| B | 3 | 112 | 76114 | 548.71 | 725 | 706 | 137.4 |
| B | 10 | 245 | 20055 | 140.79 | 725 | 706 | 137.4 |
| B | 12 | 111 | 16245 | 113.07 | 725 | 706 | 137.4 |
| C | 14 | 238 | 111830 | 680.69 | 698 | 702 | 163.3 |
| C | 15 | 208 | 71348 | 432.73 | 698 | 702 | 163.3 |
| C | 4 | 224 | 5326 | 28.32 | 698 | 702 | 163.3 |
| D | 1 | 52 | 1210310 | 6801.31 | 699 | 685 | 177.9 |
| D | 2 | 250 | 314307 | 1763.39 | 699 | 685 | 177.9 |
| D | 7 | 38 | 264730 | 1484.63 | 699 | 685 | 177.9 |
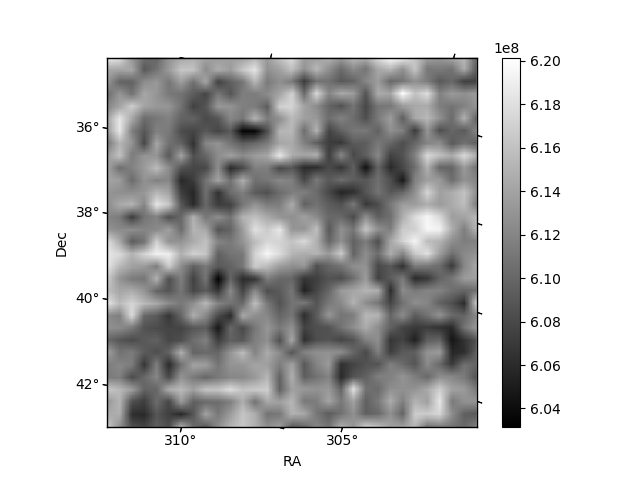
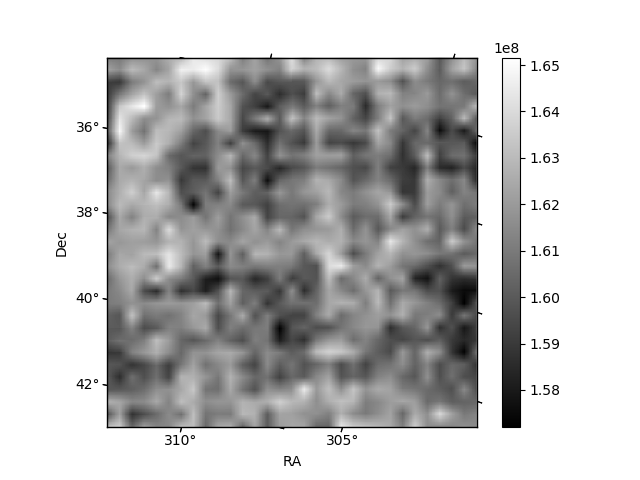
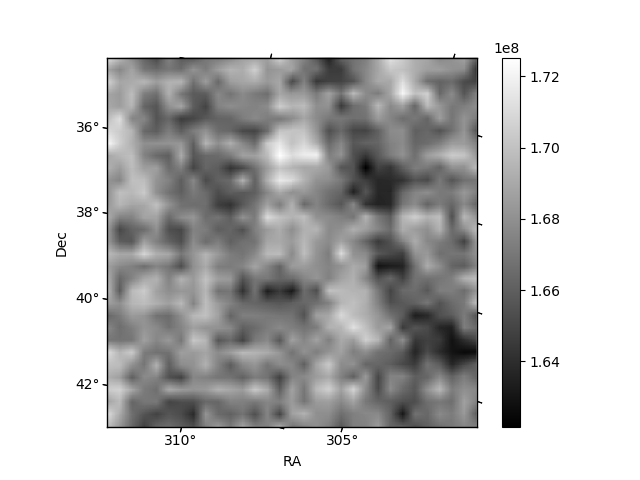
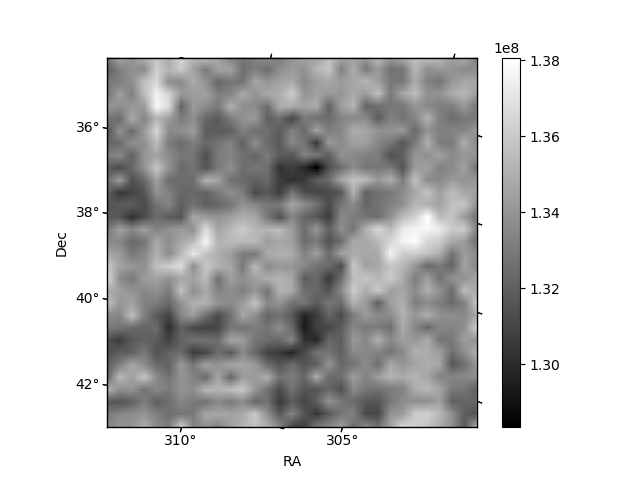
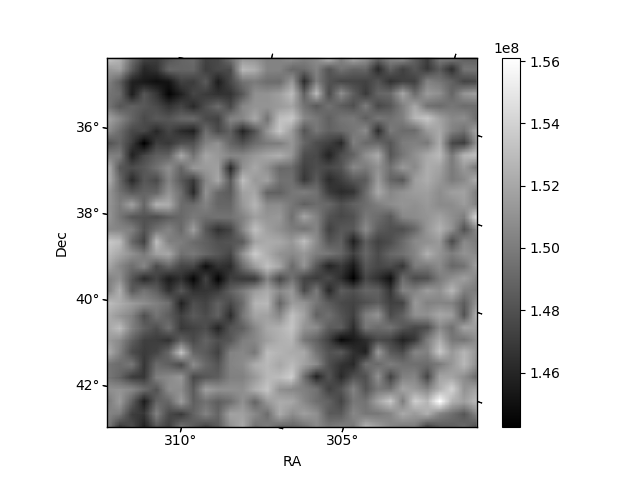
Histogram calculated using DETX and DETY for each event in the final _common_clean file
| Quadrant A | 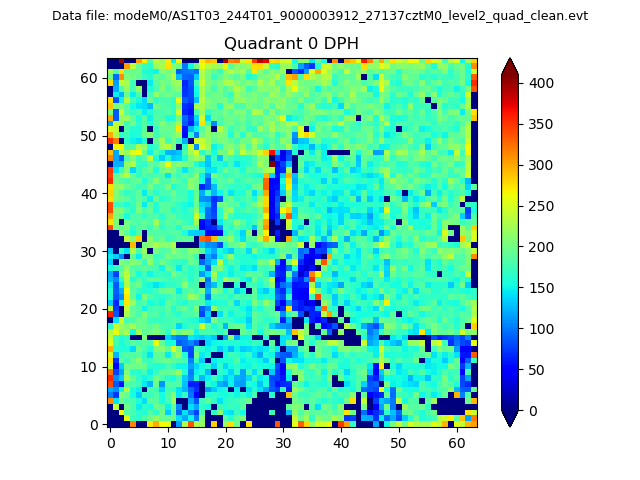 |
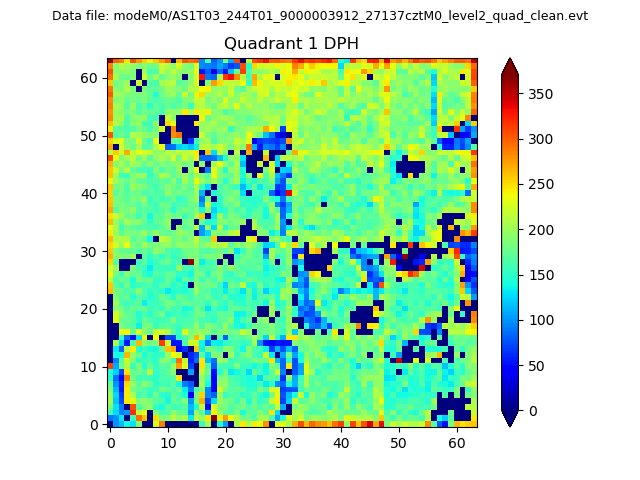 |
Quadrant B |
|---|---|---|---|
| Quadrant D | 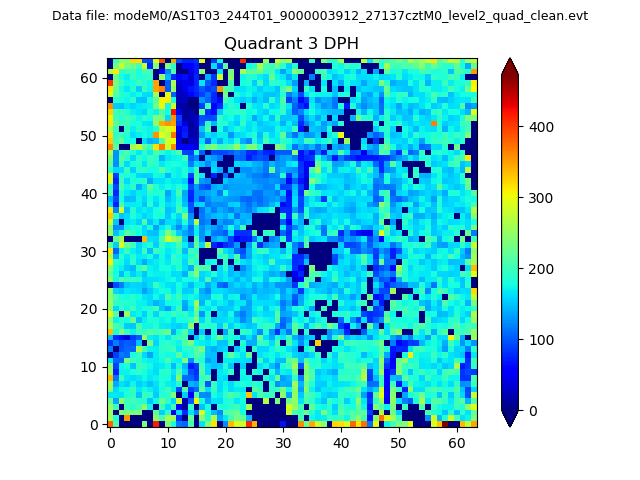 |
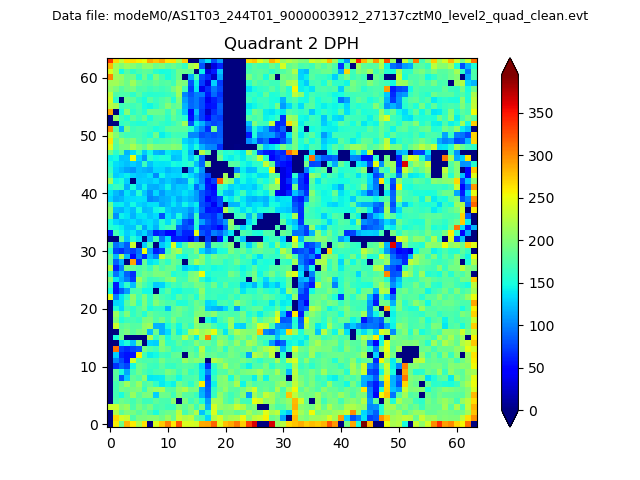 |
Quadrant C |
| Plot type | Count rate plots | Images |
|---|---|---|
| Comparison with Poisson distribution Blue bars denote a histogram of data divided into 1 sec bins. Red curve is a Poisson curve with rate = median count rate of data. |
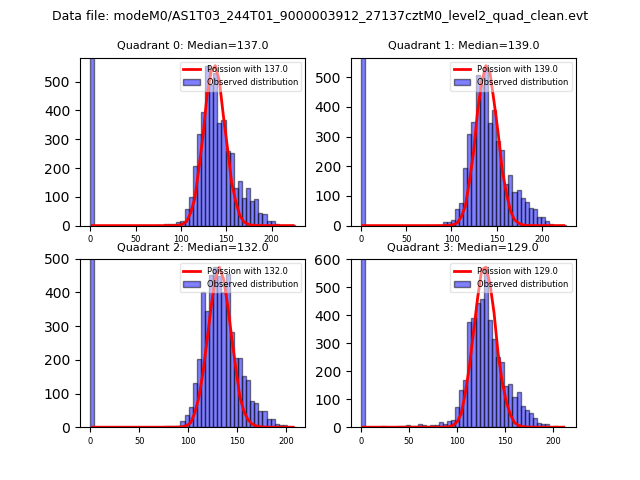 |
 |
| Quadrant-wise count rates Data is divided into 100 sec bins |
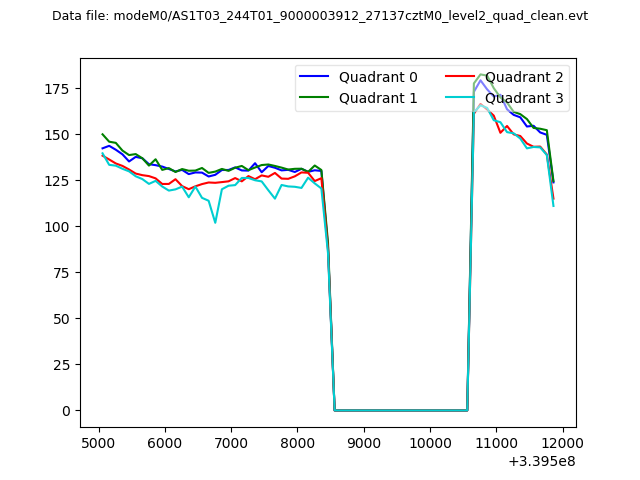 |
|
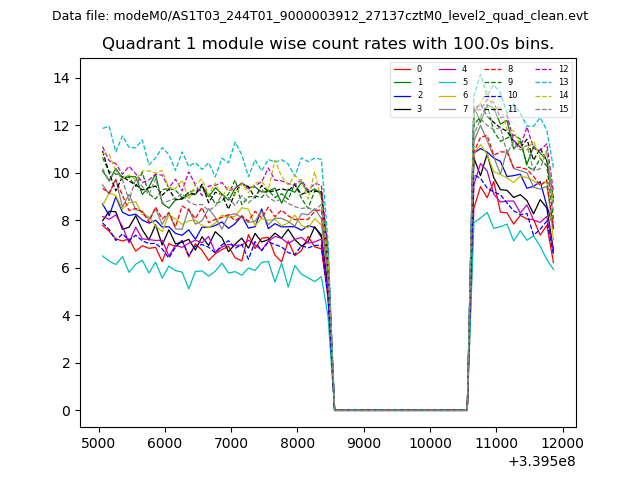
| Module-wise count rates for Quadrant A Data is divided into 100 sec bins |
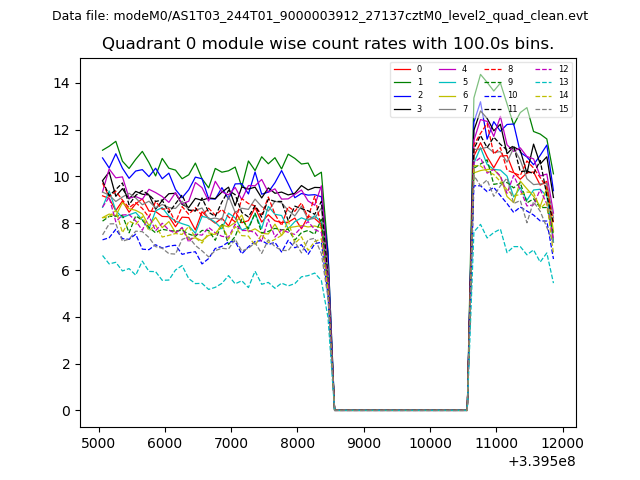 |
 |
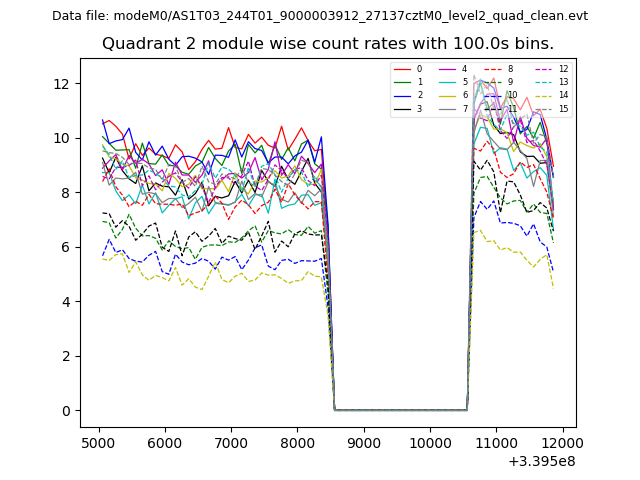
| Module-wise count rates for Quadrant B Data is divided into 100 sec bins |
 |
 |
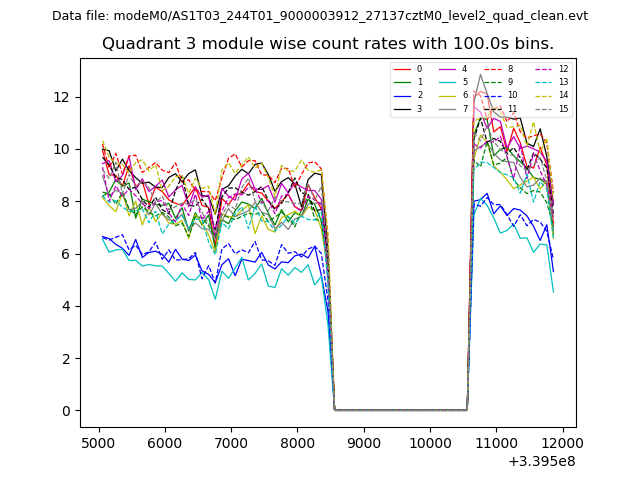
| Module-wise count rates for Quadrant C Data is divided into 100 sec bins |
 |
 |
| Module-wise count rates for Quadrant D Data is divided into 100 sec bins |
 |
 |
| Parameter | Plot |
|---|---|
| CZT HV Monitor | 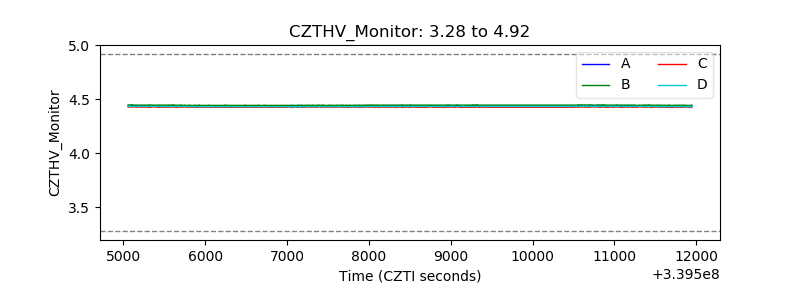 |
| D_VDD | 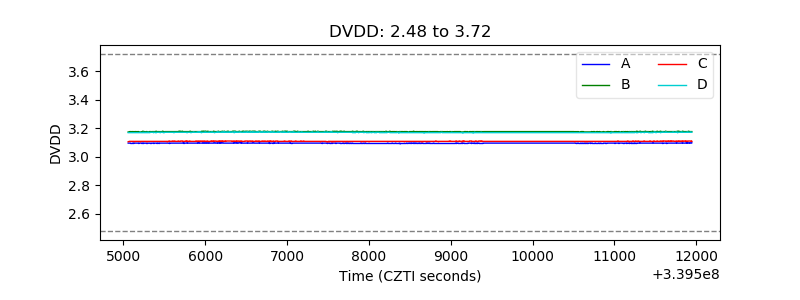 |
| Temperature 1 | 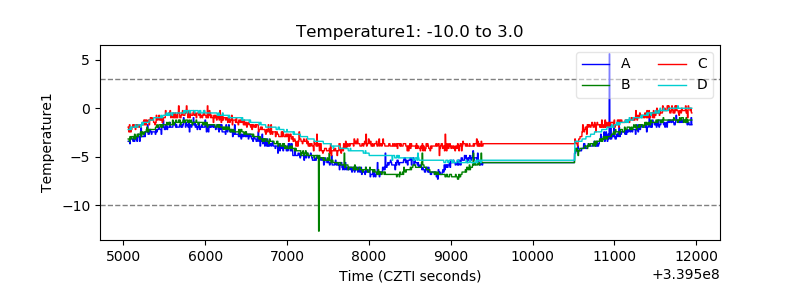 |
| Veto HV Monitor |  |
| Veto LLD |  |
| Alpha Counter | 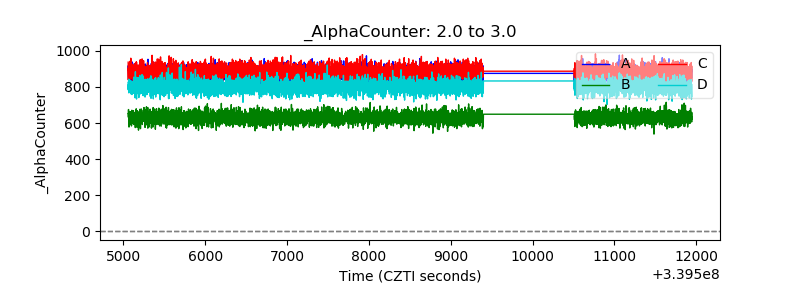 |
| _CPM_Rate | 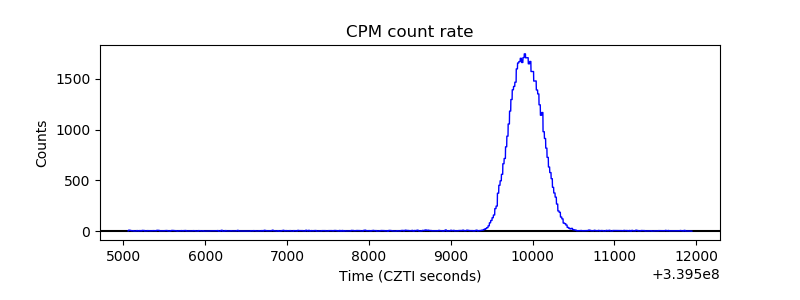 |
| CZT Counter | 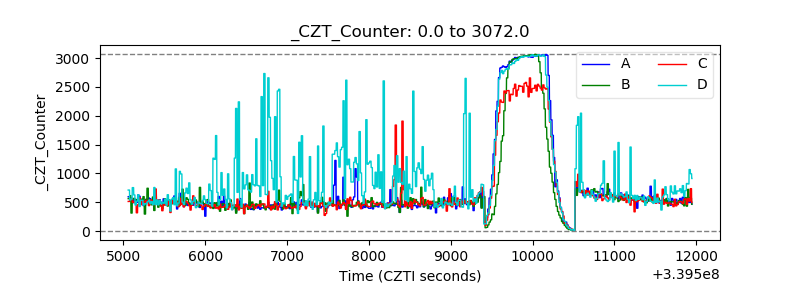 |
| +2.5 Volts monitor | 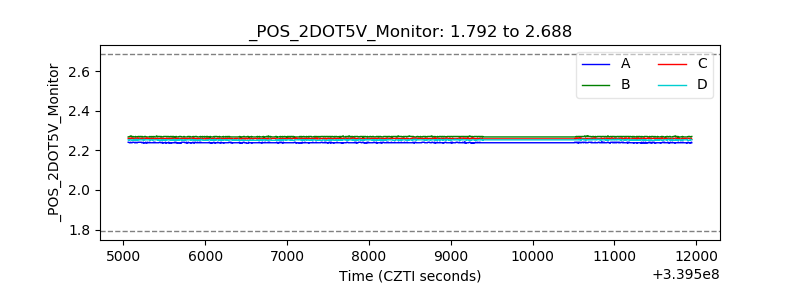 |
| +5 Volts monitor |  |
| _ROLL_ROT | 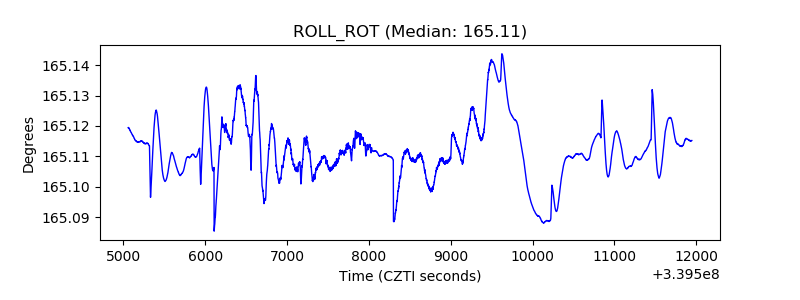 |
| _Roll_DEC | 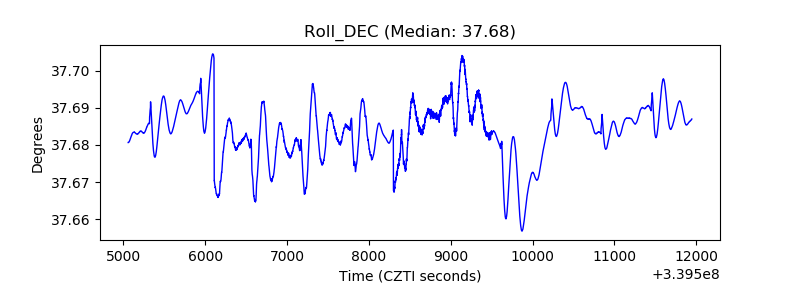 |
| _Roll_RA | 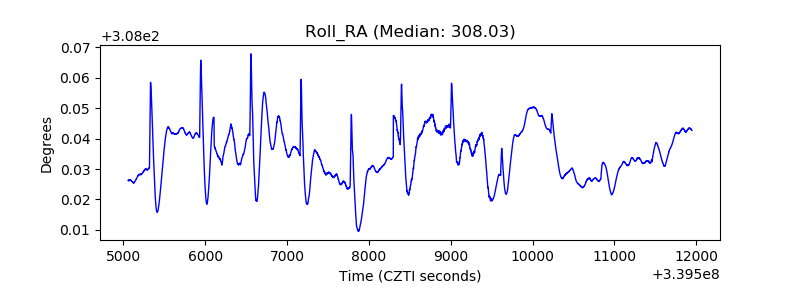 |
| Veto Counter | 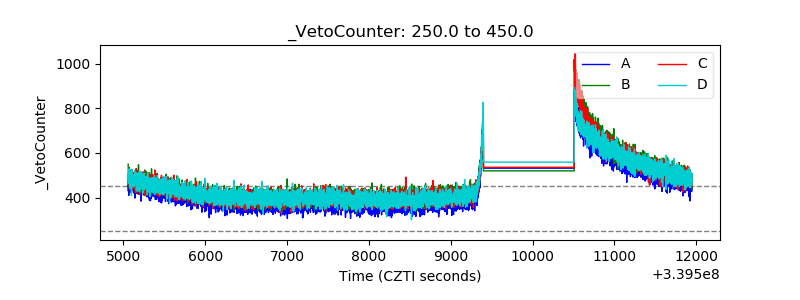 |