| Param | Original file | Final file |
|---|---|---|
| Filename | modeM0/AS1T03_244T01_9000003912_27138cztM0_level2.evt | modeM0/AS1T03_244T01_9000003912_27138cztM0_level2_quad_clean.evt |
| Size (bytes) | 500,754,240 | 103,455,360 |
| Size | 477.6 MB | 98.7 MB |
| Events in quadrant A | 3,029,679 | 715,506 |
| Events in quadrant B | 3,113,539 | 718,869 |
| Events in quadrant C | 3,005,592 | 675,118 |
| Events in quadrant D | 5,621,659 | 616,605 |
| Mode M9 | |||
|---|---|---|---|
| Quadrant | BADHDUFLAG | Total packets | Discarded packets |
| A | 0 | 12 | 0 |
| B | 0 | 12 | 0 |
| C | 0 | 12 | 0 |
| D | 0 | 12 | 0 |
| Mode M0 | |||
|---|---|---|---|
| Quadrant | BADHDUFLAG | Total packets | Discarded packets |
| A | 0 | 12749 | 0 |
| B | 0 | 12851 | 0 |
| C | 0 | 12537 | 0 |
| D | 0 | 20712 | 0 |
| Quadrant | Total seconds | Saturated seconds | Saturation percentage |
|---|---|---|---|
| A | 5823 | 55 | 0.944530% |
| B | 5824 | 48 | 0.824176% |
| C | 5824 | 82 | 1.407967% |
| D | 5824 | 769 | 13.203984% |
Noise dominated data is calculated using 1-second bins in cleaned event files. If a bin has >2000 counts, and if more than 50% of those come from <1% of pixels, then it is considered to be noise-dominated and hence unusable.
| Quadrant | # 1 sec bins | Bins with >0 counts | Bins with >2000 counts | High rate bins dominated by noise | Noise dominated (total time) | Noise dominated (detector-on time) | Marked lightcurve |
|---|---|---|---|---|---|---|---|
| A | 7033 | 5824 | 1 | 1 | 0.01% | 0.02% | 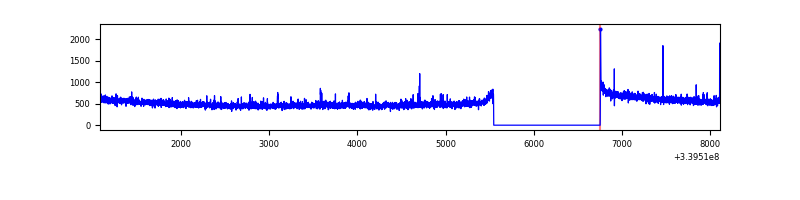 |
| B | 7034 | 5825 | 3 | 3 | 0.04% | 0.05% | 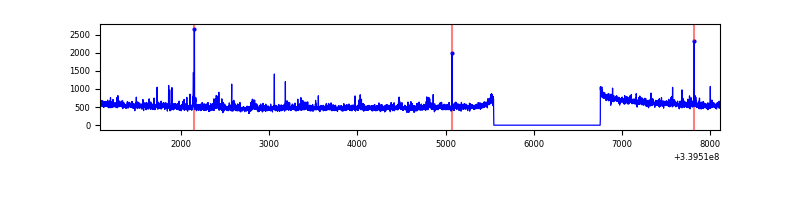 |
| C | 7034 | 5825 | 2 | 2 | 0.03% | 0.03% | 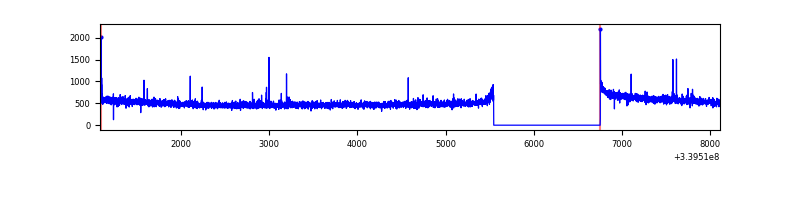 |
| D | 7034 | 5824 | 501 | 501 | 7.12% | 8.60% | 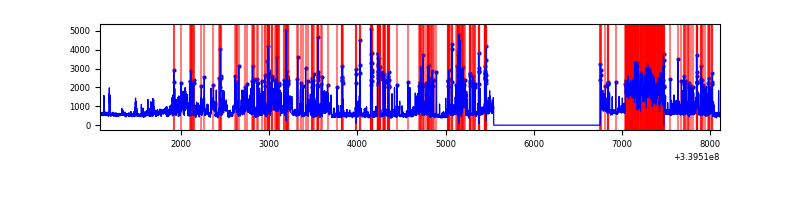 |
Top three noisy pixels from each quadrant. If the there are fewer than three noisy pixels in the level2.evt file, extra rows are filled as -1
| Pixel properties | Quadrant properties | ||||||
|---|---|---|---|---|---|---|---|
| Quadrant | DetID | PixID | Counts | Sigma | Mean | Median | Sigma |
| A | 12 | 189 | 26940 | 170.31 | 772 | 757 | 153.7 |
| A | 14 | 235 | 11714 | 71.27 | 772 | 757 | 153.7 |
| A | 13 | 254 | 9765 | 58.59 | 772 | 757 | 153.7 |
| B | 3 | 112 | 78608 | 549.92 | 757 | 739 | 141.6 |
| B | 10 | 245 | 38214 | 264.65 | 757 | 739 | 141.6 |
| B | 12 | 111 | 16212 | 109.27 | 757 | 739 | 141.6 |
| C | 14 | 238 | 116919 | 685.06 | 730 | 736 | 169.6 |
| C | 15 | 208 | 33094 | 190.79 | 730 | 736 | 169.6 |
| C | 2 | 16 | 6022 | 31.17 | 730 | 736 | 169.6 |
| D | 1 | 52 | 2324542 | 13034.63 | 693 | 679 | 178.3 |
| D | 7 | 38 | 436118 | 2442.39 | 693 | 679 | 178.3 |
| D | 2 | 250 | 165600 | 925.05 | 693 | 679 | 178.3 |
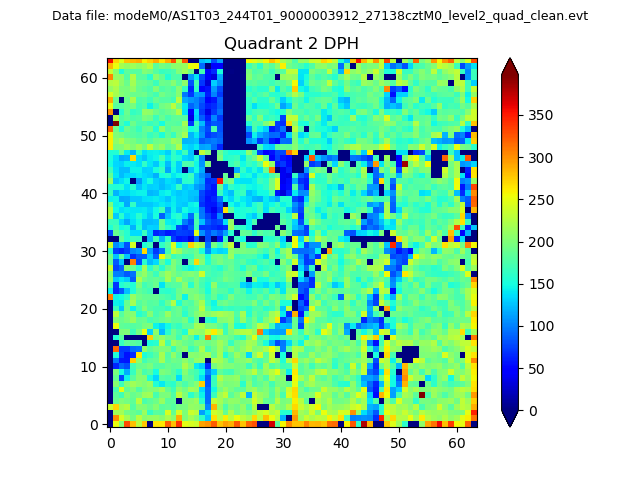
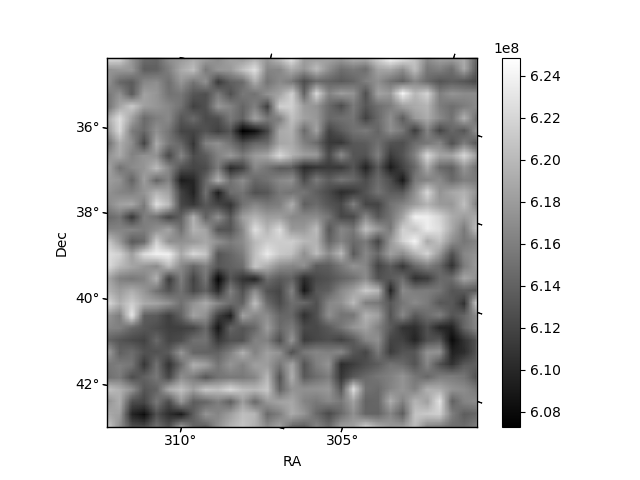
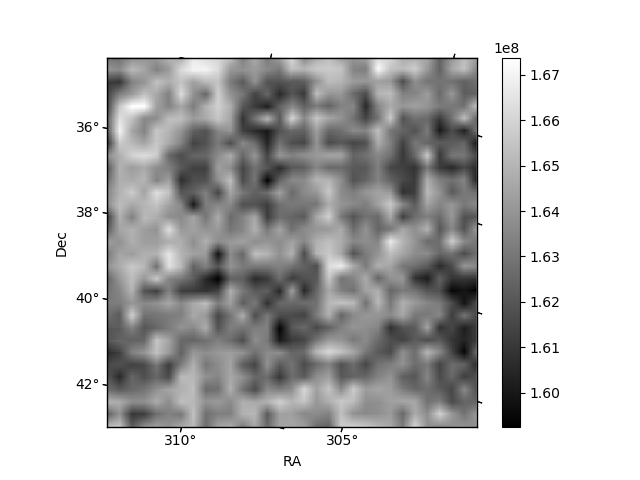
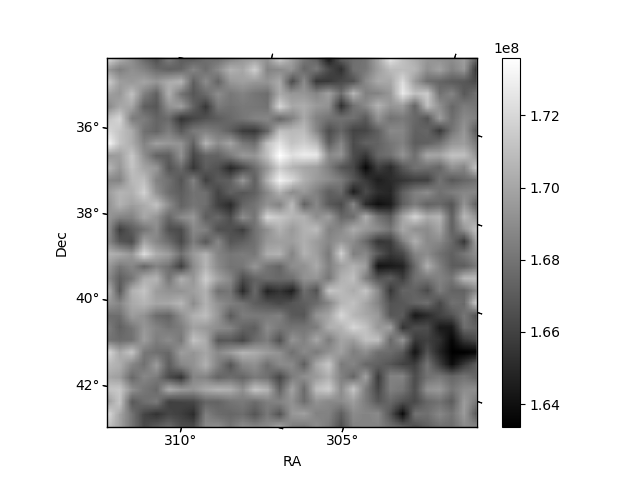
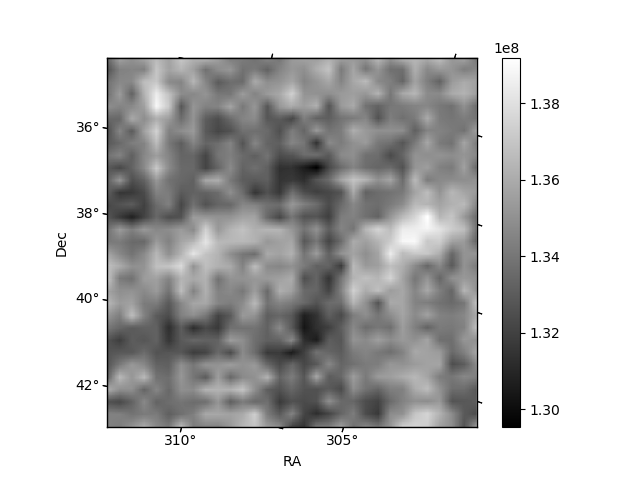
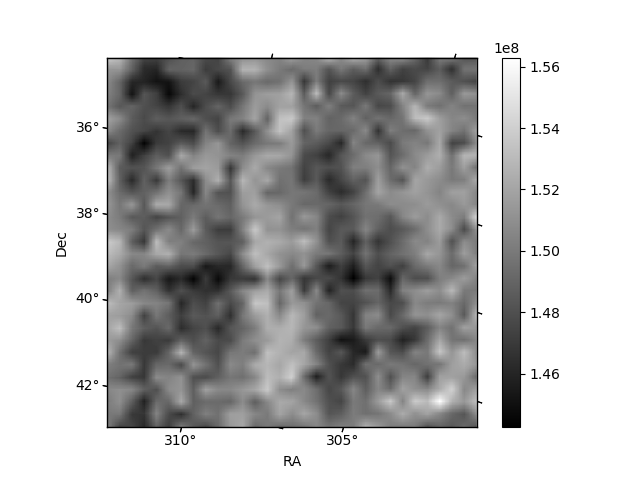
Histogram calculated using DETX and DETY for each event in the final _common_clean file
| Quadrant A | 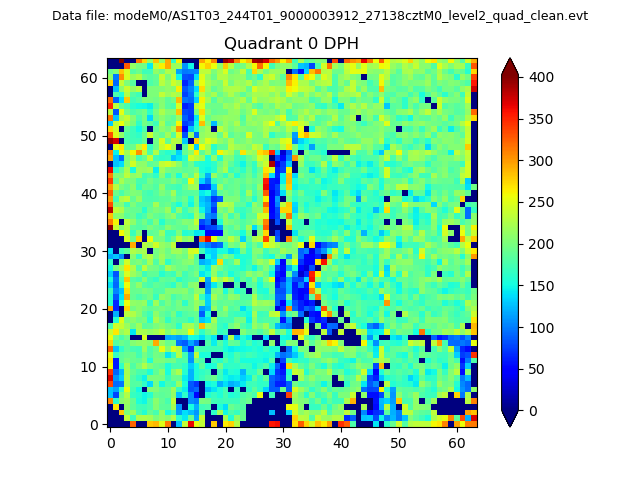 |
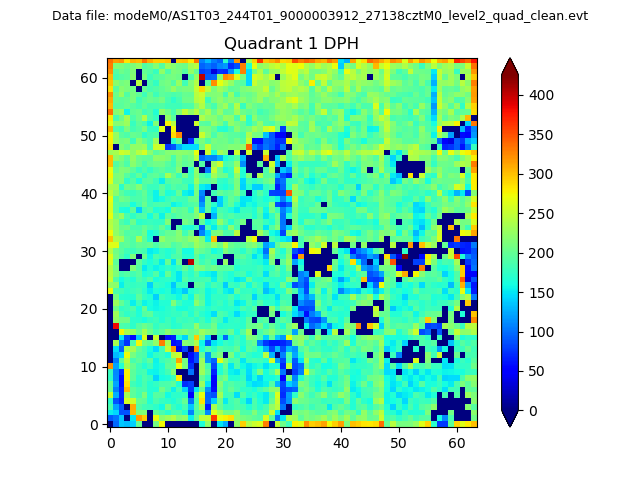 |
Quadrant B |
|---|---|---|---|
| Quadrant D | 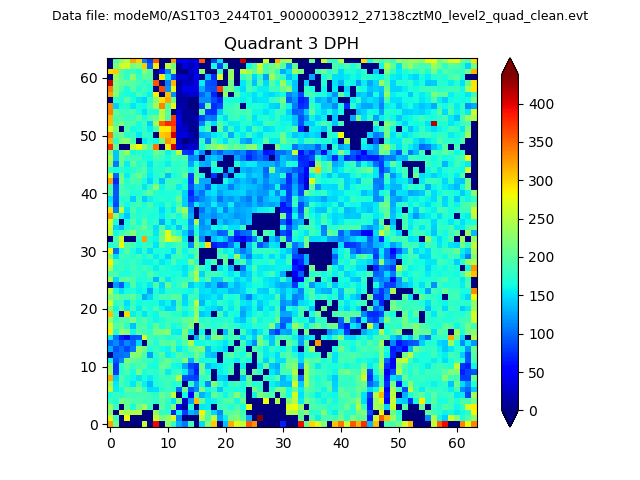 |
 |
Quadrant C |
| Plot type | Count rate plots | Images |
|---|---|---|
| Comparison with Poisson distribution Blue bars denote a histogram of data divided into 1 sec bins. Red curve is a Poisson curve with rate = median count rate of data. |
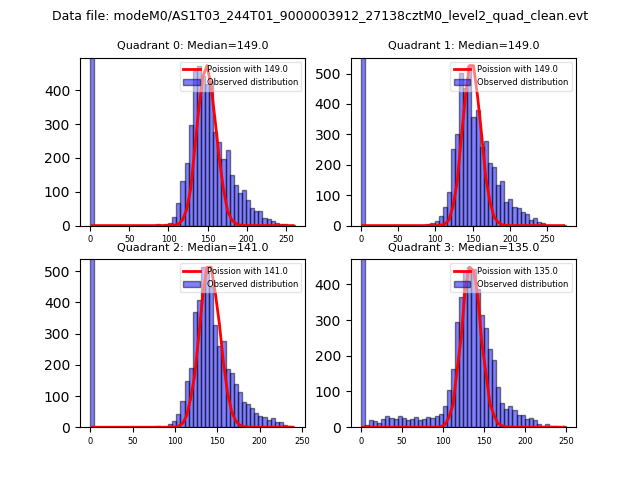 |
 |
| Quadrant-wise count rates Data is divided into 100 sec bins |
 |
|
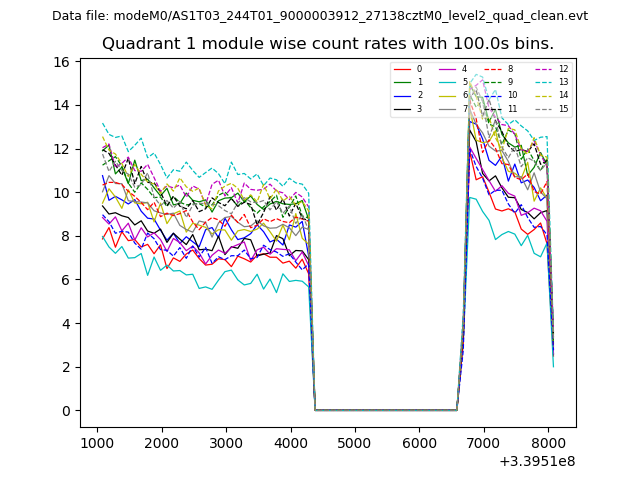
| Module-wise count rates for Quadrant A Data is divided into 100 sec bins |
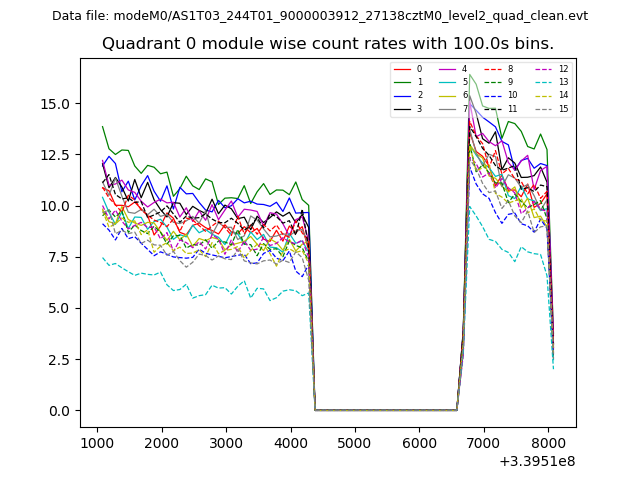 |
 |
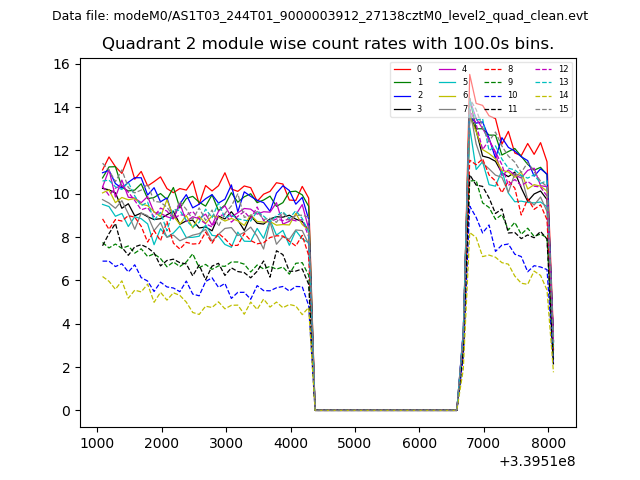
| Module-wise count rates for Quadrant B Data is divided into 100 sec bins |
 |
 |
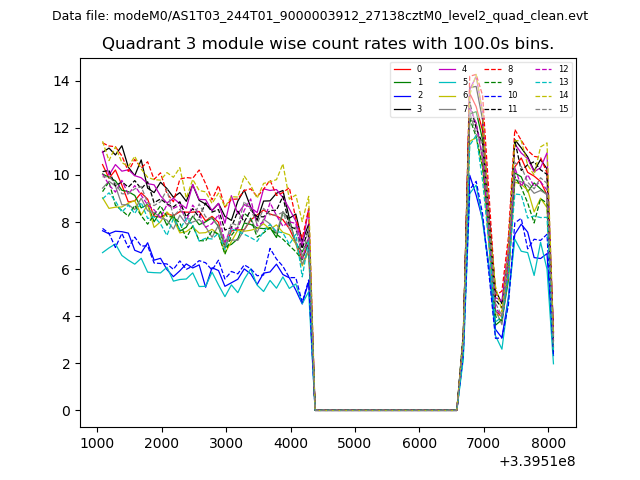
| Module-wise count rates for Quadrant C Data is divided into 100 sec bins |
 |
 |
| Module-wise count rates for Quadrant D Data is divided into 100 sec bins |
 |
 |
| Parameter | Plot |
|---|---|
| CZT HV Monitor | 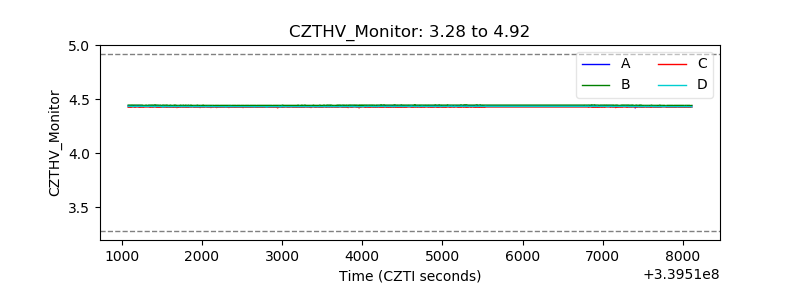 |
| D_VDD | 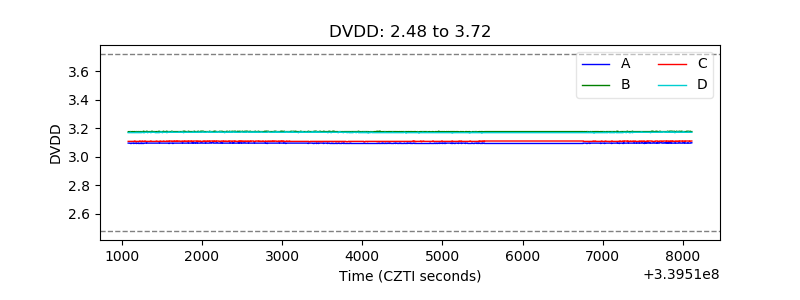 |
| Temperature 1 |  |
| Veto HV Monitor | 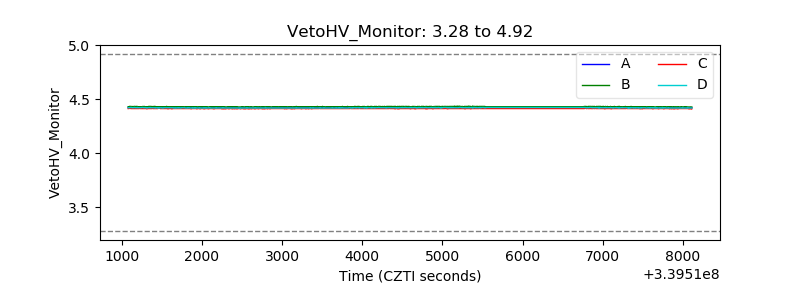 |
| Veto LLD | 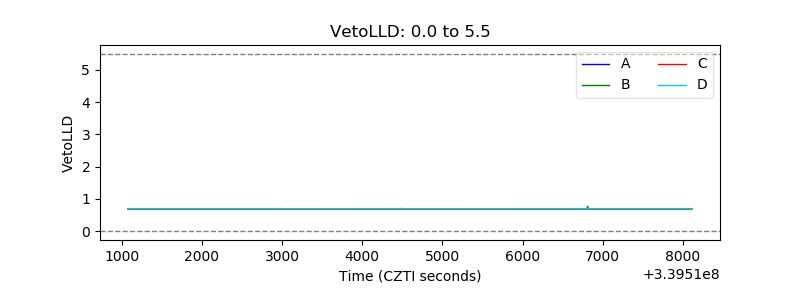 |
| Alpha Counter | 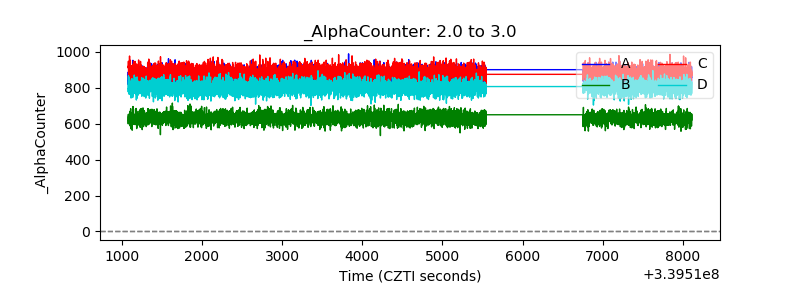 |
| _CPM_Rate |  |
| CZT Counter | 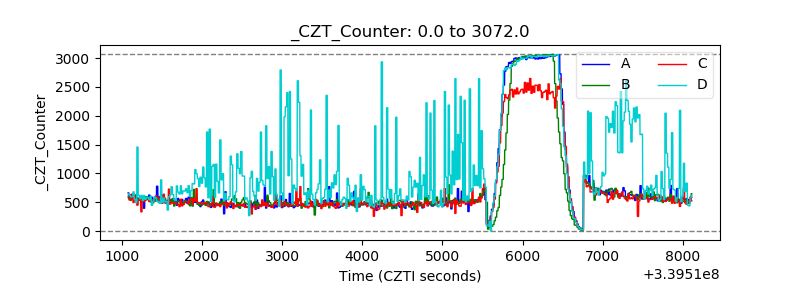 |
| +2.5 Volts monitor |  |
| +5 Volts monitor |  |
| _ROLL_ROT | 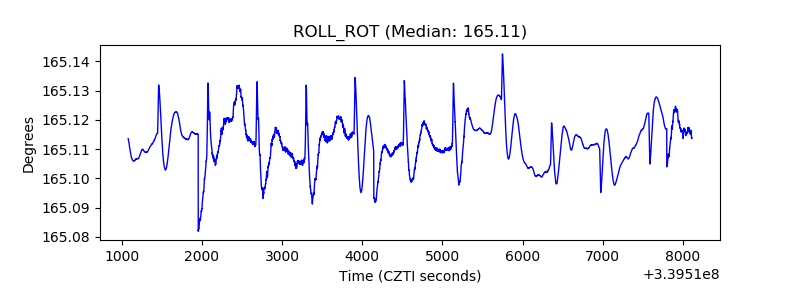 |
| _Roll_DEC | 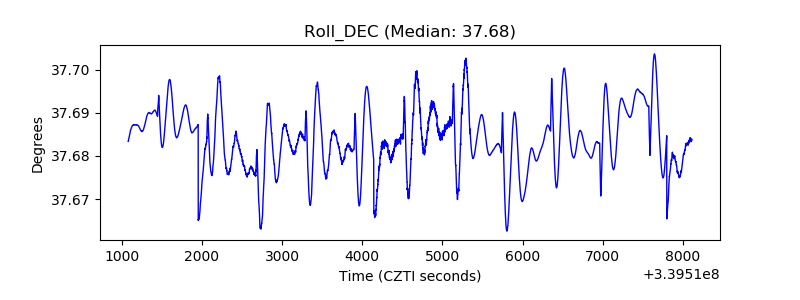 |
| _Roll_RA | 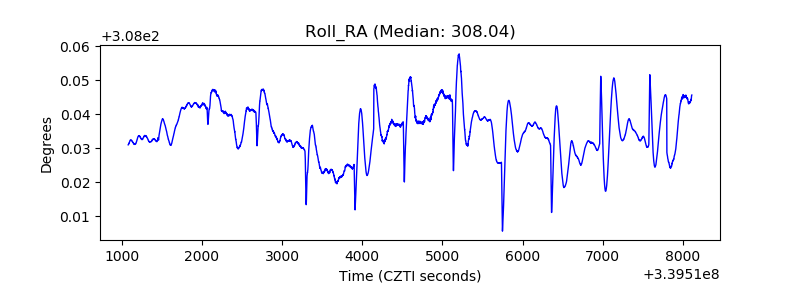 |
| Veto Counter | 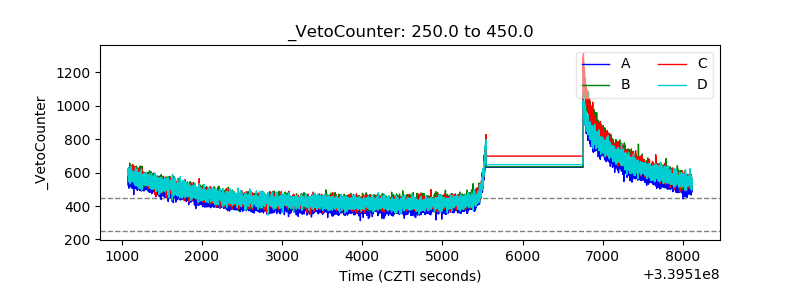 |