| Param | Original file | Final file |
|---|---|---|
| Filename | modeM0/AS1T03_244T01_9000003912_27139cztM0_level2.evt | modeM0/AS1T03_244T01_9000003912_27139cztM0_level2_quad_clean.evt |
| Size (bytes) | 559,895,040 | 104,843,520 |
| Size | 534.0 MB | 100.0 MB |
| Events in quadrant A | 3,213,530 | 733,772 |
| Events in quadrant B | 3,306,762 | 739,905 |
| Events in quadrant C | 3,195,563 | 697,882 |
| Events in quadrant D | 6,833,254 | 583,596 |
| Mode M9 | |||
|---|---|---|---|
| Quadrant | BADHDUFLAG | Total packets | Discarded packets |
| A | 0 | 13 | 0 |
| B | 0 | 13 | 0 |
| C | 0 | 13 | 0 |
| D | 0 | 13 | 0 |
| Mode M0 | |||
|---|---|---|---|
| Quadrant | BADHDUFLAG | Total packets | Discarded packets |
| A | 0 | 13352 | 0 |
| B | 0 | 13639 | 0 |
| C | 0 | 13178 | 0 |
| D | 0 | 24385 | 0 |
| Quadrant | Total seconds | Saturated seconds | Saturation percentage |
|---|---|---|---|
| A | 6008 | 74 | 1.231691% |
| B | 6009 | 77 | 1.281411% |
| C | 6009 | 107 | 1.780662% |
| D | 6009 | 1624 | 27.026127% |
Noise dominated data is calculated using 1-second bins in cleaned event files. If a bin has >2000 counts, and if more than 50% of those come from <1% of pixels, then it is considered to be noise-dominated and hence unusable.
| Quadrant | # 1 sec bins | Bins with >0 counts | Bins with >2000 counts | High rate bins dominated by noise | Noise dominated (total time) | Noise dominated (detector-on time) | Marked lightcurve |
|---|---|---|---|---|---|---|---|
| A | 7283 | 6009 | 2 | 2 | 0.03% | 0.03% | 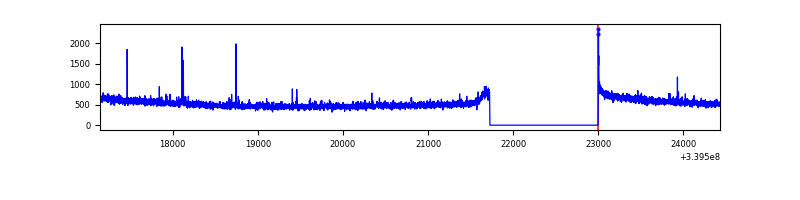 |
| B | 7284 | 6010 | 1 | 1 | 0.01% | 0.02% | 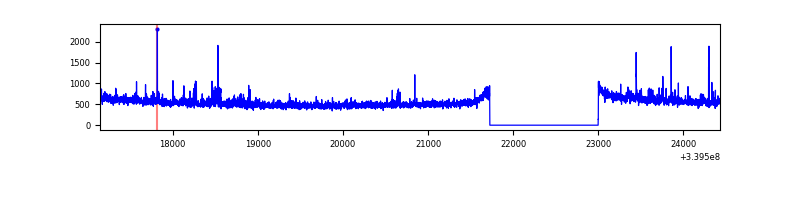 |
| C | 7284 | 6010 | 0 | 0 | 0.00% | 0.00% | 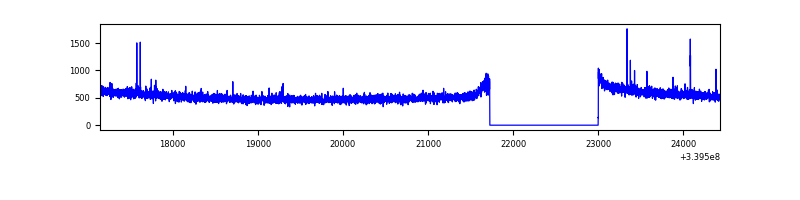 |
| D | 7284 | 6009 | 987 | 987 | 13.55% | 16.43% | 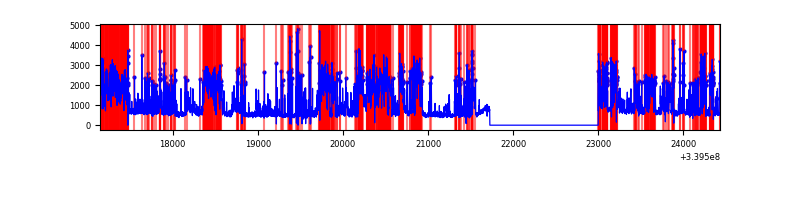 |
Top three noisy pixels from each quadrant. If the there are fewer than three noisy pixels in the level2.evt file, extra rows are filled as -1
| Pixel properties | Quadrant properties | ||||||
|---|---|---|---|---|---|---|---|
| Quadrant | DetID | PixID | Counts | Sigma | Mean | Median | Sigma |
| A | 13 | 248 | 14976 | 86.94 | 823 | 806 | 163.0 |
| A | 13 | 254 | 9868 | 55.6 | 823 | 806 | 163.0 |
| A | 12 | 189 | 9616 | 54.05 | 823 | 806 | 163.0 |
| B | 3 | 112 | 92491 | 616.61 | 808 | 791 | 148.7 |
| B | 12 | 111 | 16997 | 108.97 | 808 | 791 | 148.7 |
| B | 11 | 111 | 15193 | 96.84 | 808 | 791 | 148.7 |
| C | 14 | 238 | 126004 | 689.06 | 781 | 786 | 181.7 |
| C | 15 | 208 | 23164 | 123.14 | 781 | 786 | 181.7 |
| C | 13 | 61 | 5311 | 24.9 | 781 | 786 | 181.7 |
| D | 1 | 52 | 3684980 | 20873.33 | 678 | 667 | 176.5 |
| D | 7 | 38 | 336969 | 1905.31 | 678 | 667 | 176.5 |
| D | 2 | 250 | 151067 | 852.09 | 678 | 667 | 176.5 |
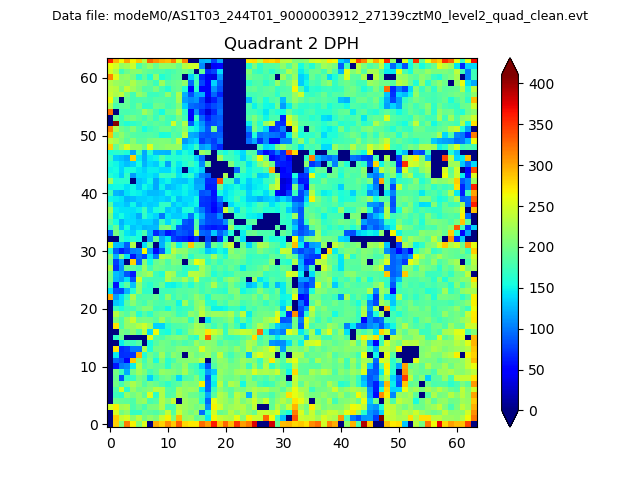
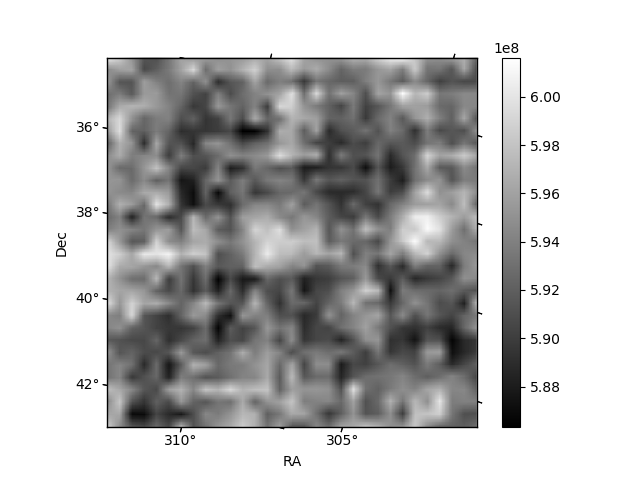
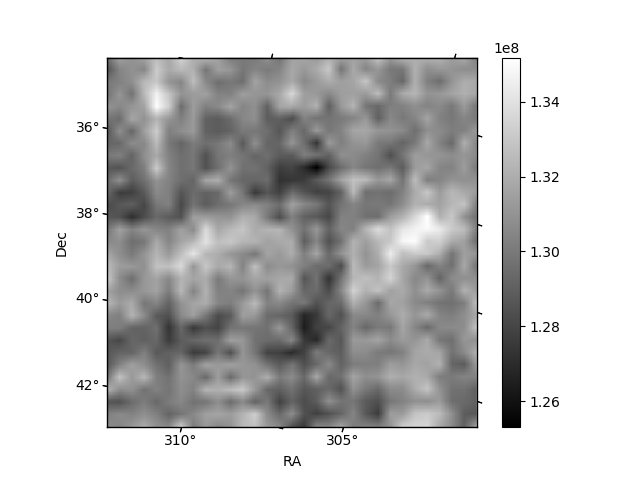
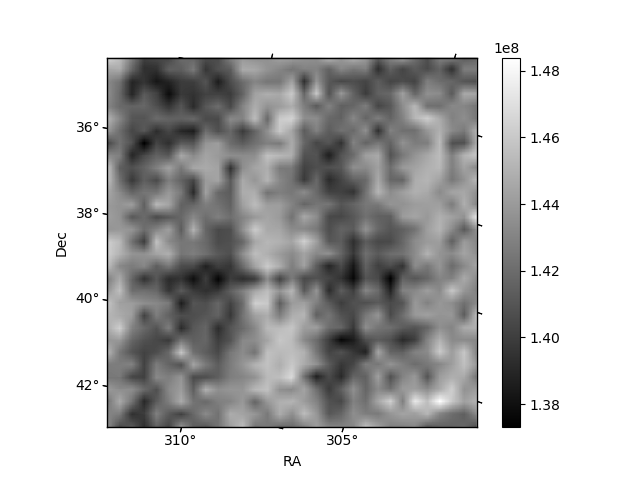
Histogram calculated using DETX and DETY for each event in the final _common_clean file
| Quadrant A | 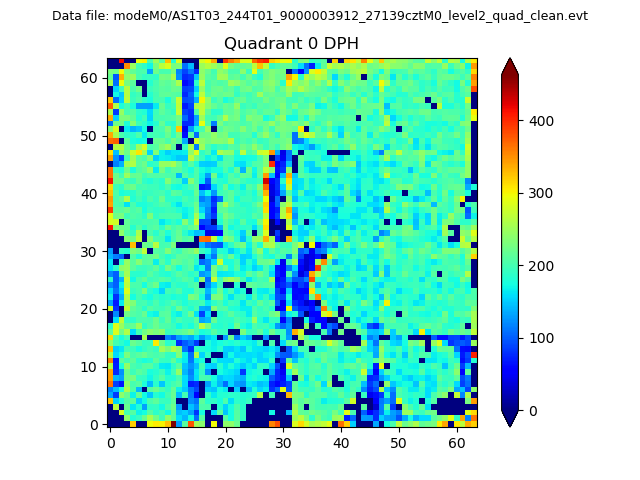 |
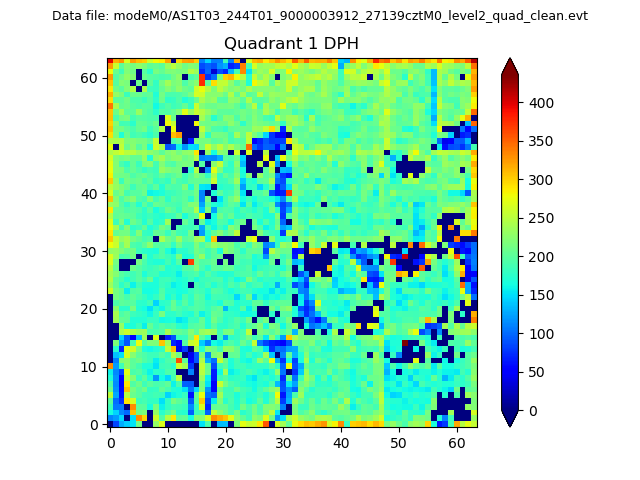 |
Quadrant B |
|---|---|---|---|
| Quadrant D | 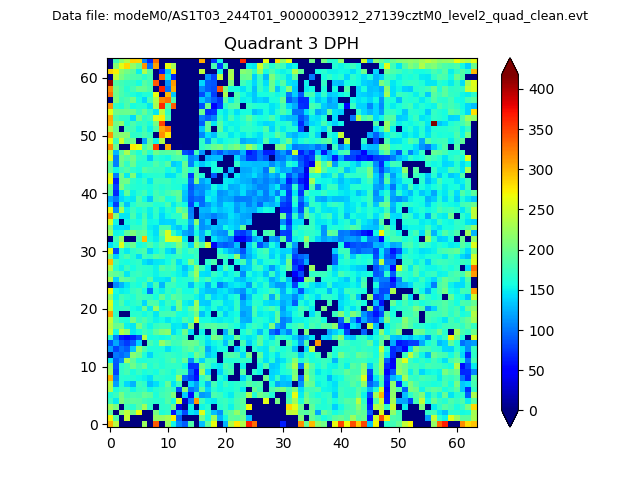 |
 |
Quadrant C |
| Plot type | Count rate plots | Images |
|---|---|---|
| Comparison with Poisson distribution Blue bars denote a histogram of data divided into 1 sec bins. Red curve is a Poisson curve with rate = median count rate of data. |
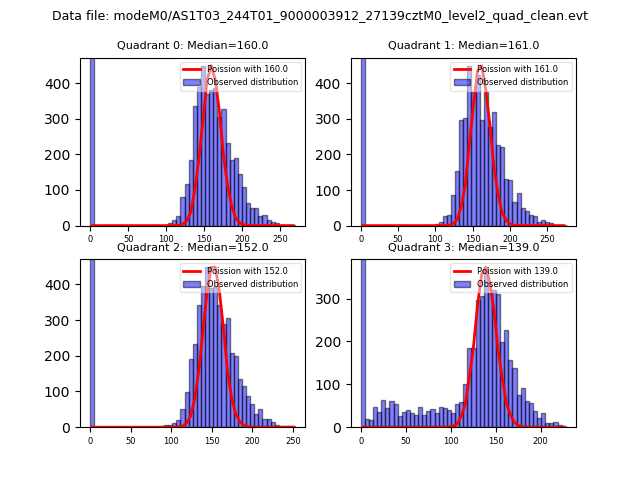 |
 |
| Quadrant-wise count rates Data is divided into 100 sec bins |
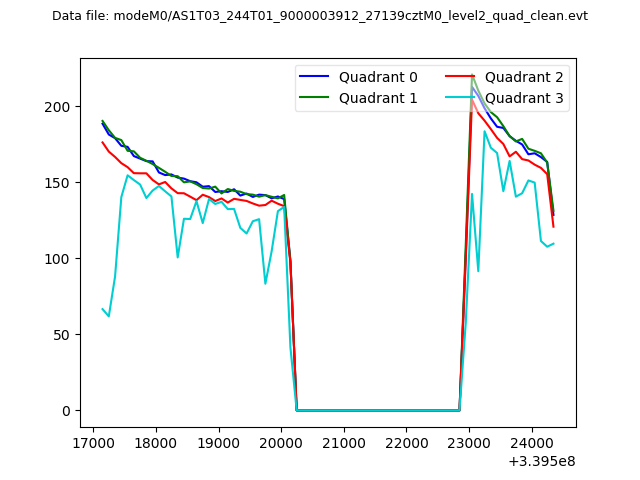 |
|
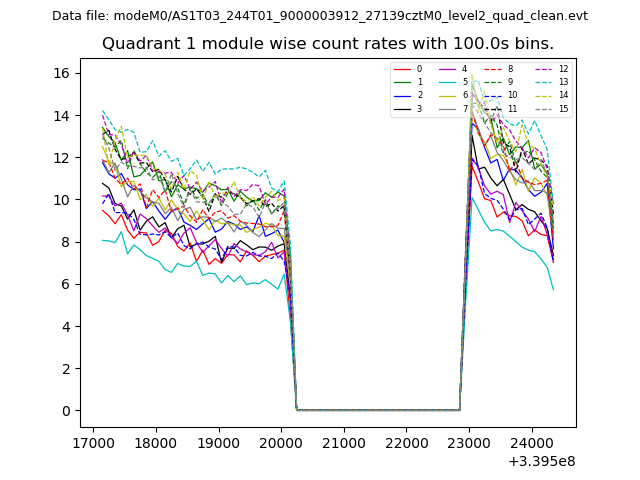
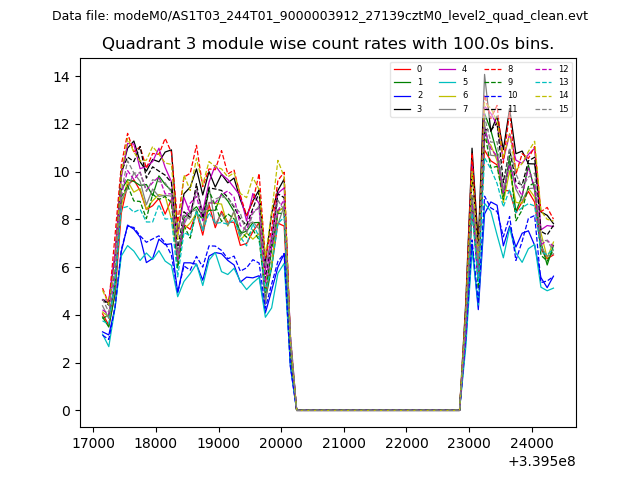
| Module-wise count rates for Quadrant A Data is divided into 100 sec bins |
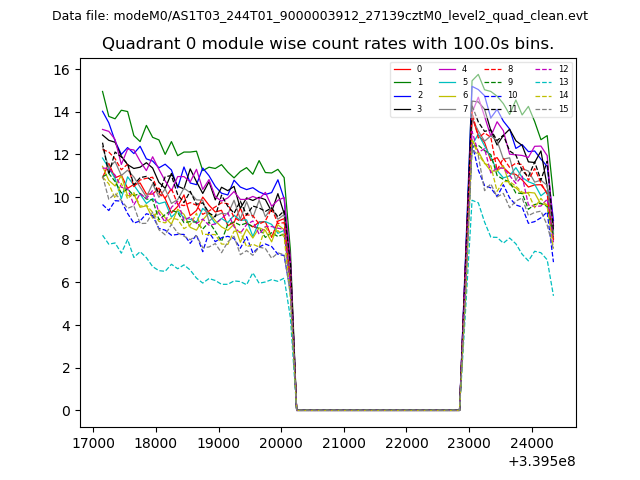 |
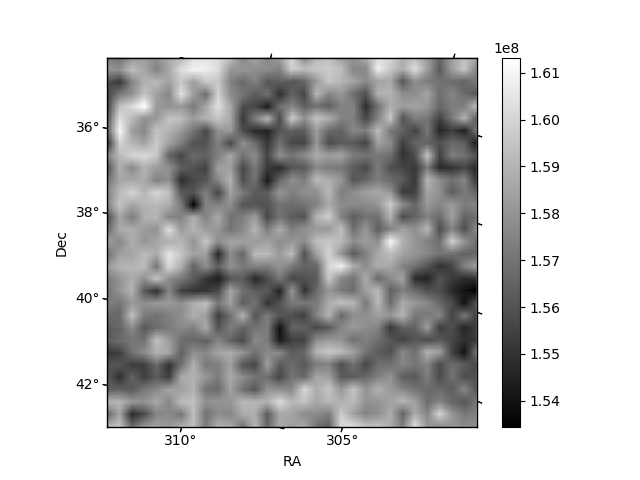 |
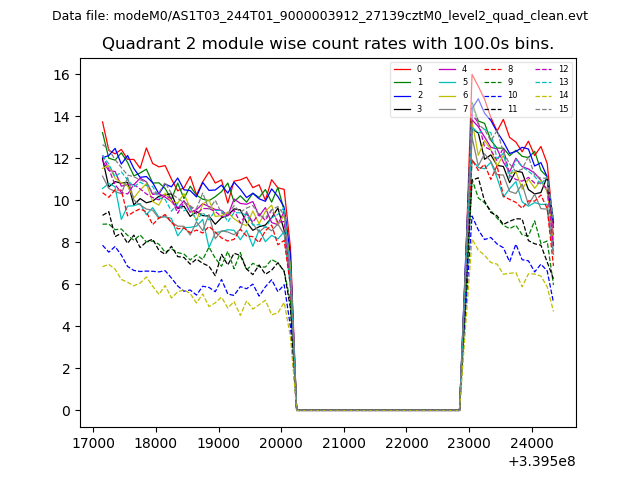
| Module-wise count rates for Quadrant B Data is divided into 100 sec bins |
 |
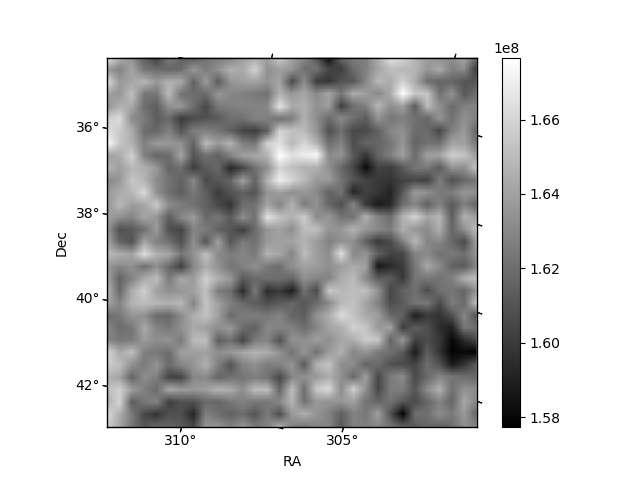 |
| Module-wise count rates for Quadrant C Data is divided into 100 sec bins |
 |
 |
| Module-wise count rates for Quadrant D Data is divided into 100 sec bins |
 |
 |
| Parameter | Plot |
|---|---|
| CZT HV Monitor | 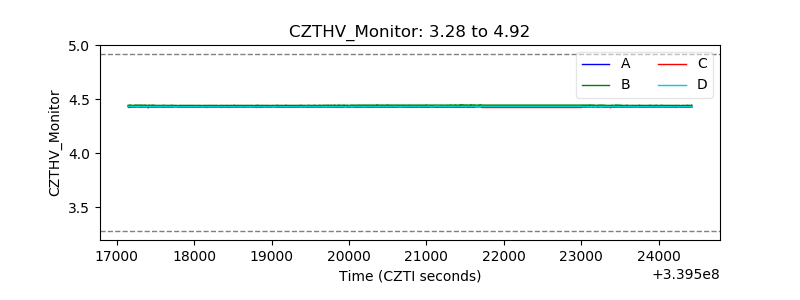 |
| D_VDD | 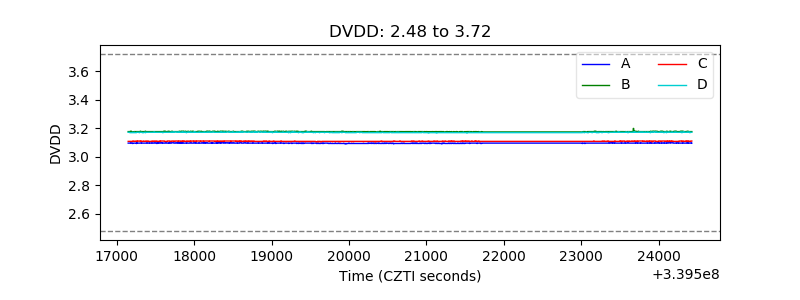 |
| Temperature 1 | 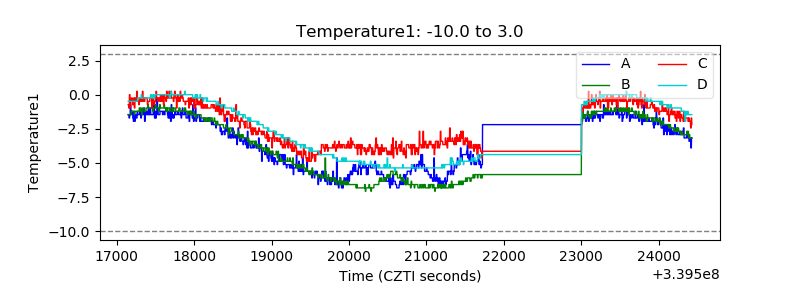 |
| Veto HV Monitor | 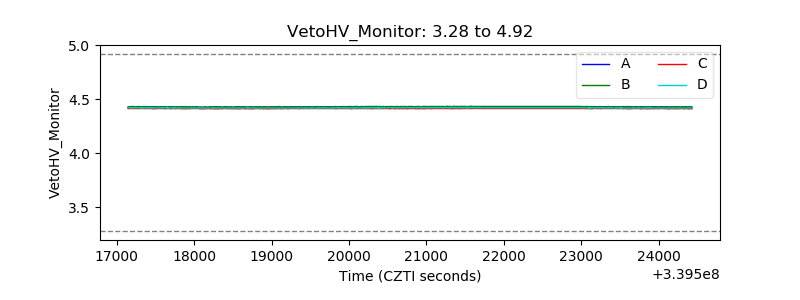 |
| Veto LLD | 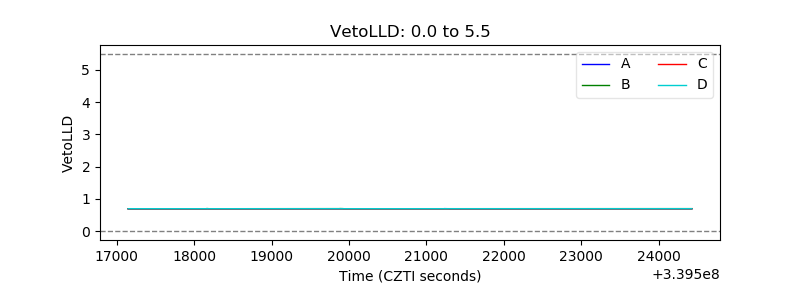 |
| Alpha Counter | 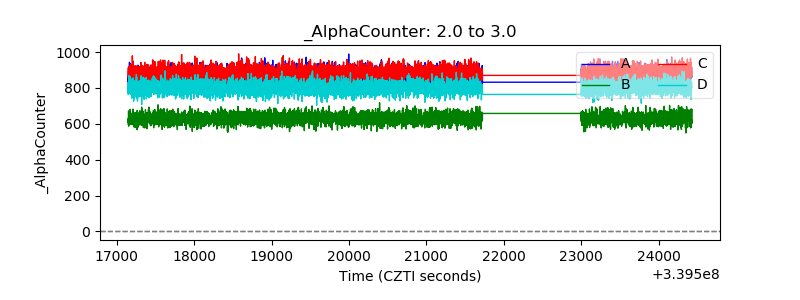 |
| _CPM_Rate | 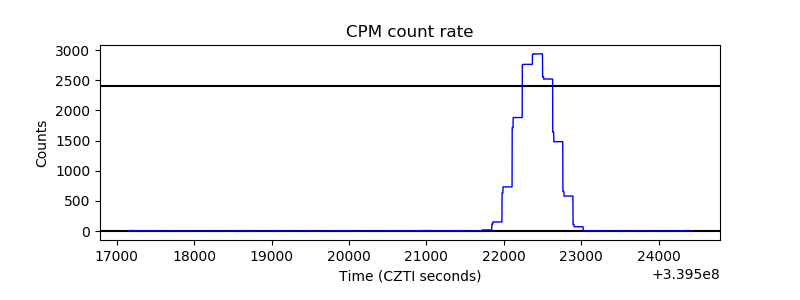 |
| CZT Counter | 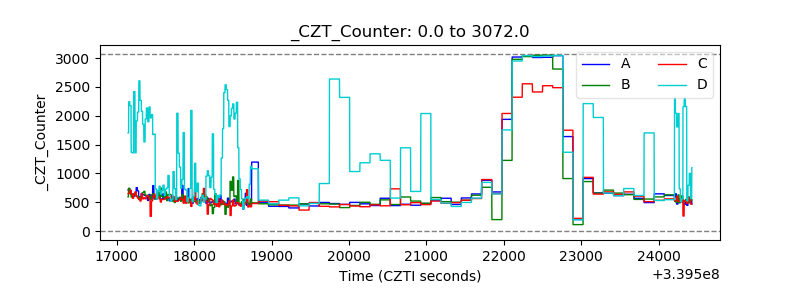 |
| +2.5 Volts monitor |  |
| +5 Volts monitor |  |
| _ROLL_ROT | 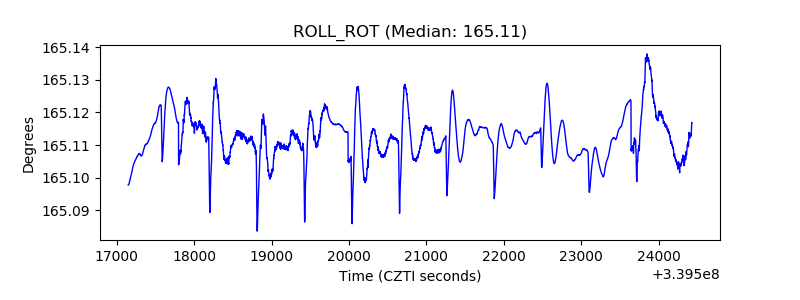 |
| _Roll_DEC | 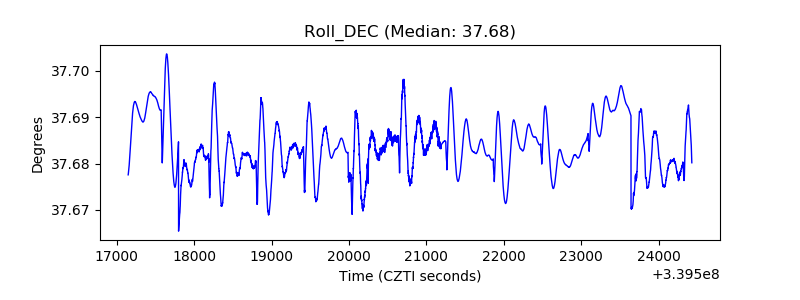 |
| _Roll_RA | 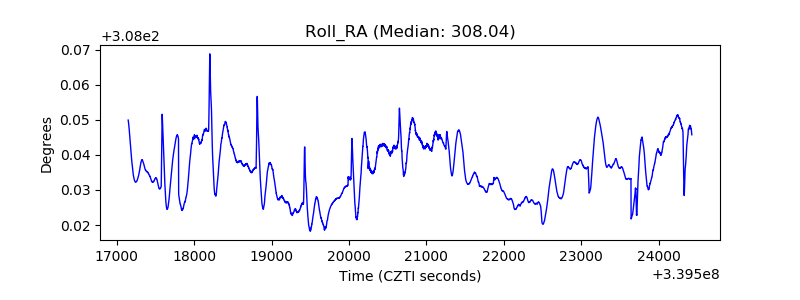 |
| Veto Counter | 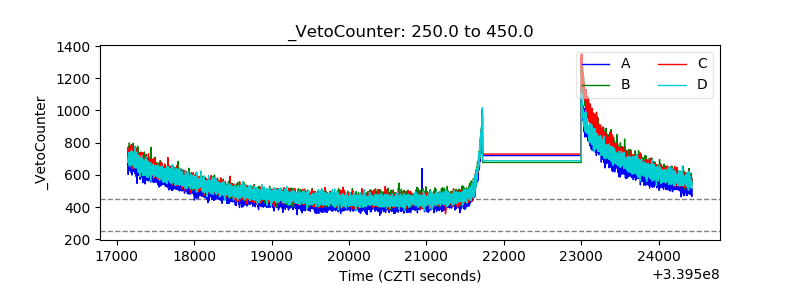 |