| Param | Original file | Final file |
|---|---|---|
| Filename | modeM0/AS1T03_244T01_9000003912_27140cztM0_level2.evt | modeM0/AS1T03_244T01_9000003912_27140cztM0_level2_quad_clean.evt |
| Size (bytes) | 546,246,720 | 106,441,920 |
| Size | 520.9 MB | 101.5 MB |
| Events in quadrant A | 3,383,543 | 728,213 |
| Events in quadrant B | 3,519,766 | 738,270 |
| Events in quadrant C | 3,435,654 | 696,940 |
| Events in quadrant D | 5,782,628 | 626,058 |
| Mode M9 | |||
|---|---|---|---|
| Quadrant | BADHDUFLAG | Total packets | Discarded packets |
| A | 0 | 13 | 0 |
| B | 0 | 13 | 0 |
| C | 0 | 13 | 0 |
| D | 0 | 13 | 0 |
| Mode M0 | |||
|---|---|---|---|
| Quadrant | BADHDUFLAG | Total packets | Discarded packets |
| A | 0 | 13914 | 0 |
| B | 0 | 14380 | 0 |
| C | 0 | 14046 | 0 |
| D | 0 | 21417 | 0 |
| Quadrant | Total seconds | Saturated seconds | Saturation percentage |
|---|---|---|---|
| A | 6218 | 74 | 1.190093% |
| B | 6219 | 78 | 1.254221% |
| C | 6219 | 146 | 2.347644% |
| D | 6219 | 996 | 16.015437% |
Noise dominated data is calculated using 1-second bins in cleaned event files. If a bin has >2000 counts, and if more than 50% of those come from <1% of pixels, then it is considered to be noise-dominated and hence unusable.
| Quadrant | # 1 sec bins | Bins with >0 counts | Bins with >2000 counts | High rate bins dominated by noise | Noise dominated (total time) | Noise dominated (detector-on time) | Marked lightcurve |
|---|---|---|---|---|---|---|---|
| A | 7563 | 6219 | 6 | 6 | 0.08% | 0.10% | 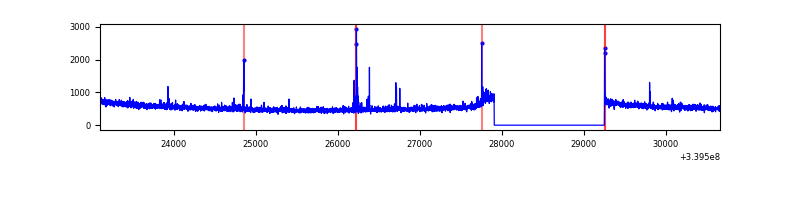 |
| B | 7564 | 6220 | 5 | 5 | 0.07% | 0.08% | 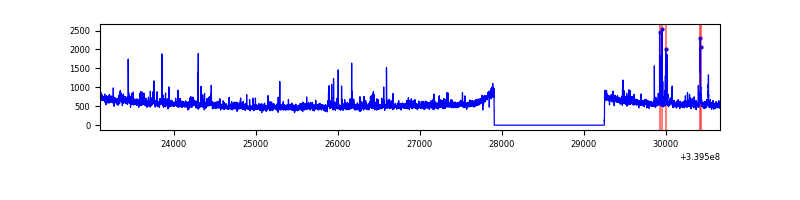 |
| C | 7564 | 6220 | 8 | 8 | 0.11% | 0.13% | 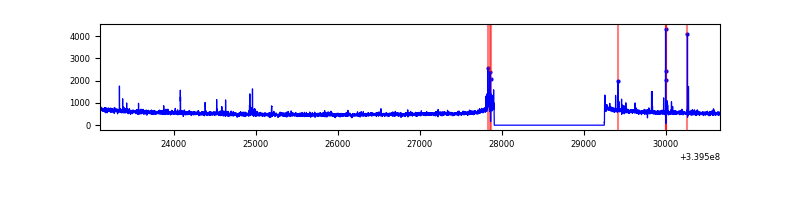 |
| D | 7564 | 6220 | 577 | 577 | 7.63% | 9.28% | 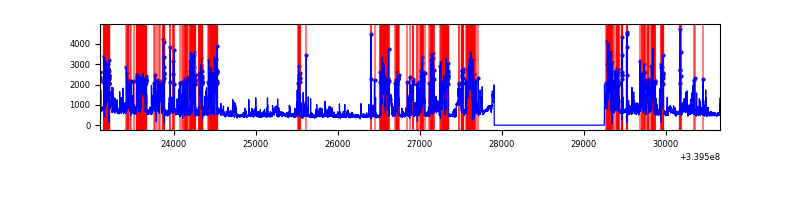 |
Top three noisy pixels from each quadrant. If the there are fewer than three noisy pixels in the level2.evt file, extra rows are filled as -1
| Pixel properties | Quadrant properties | ||||||
|---|---|---|---|---|---|---|---|
| Quadrant | DetID | PixID | Counts | Sigma | Mean | Median | Sigma |
| A | 14 | 235 | 62047 | 364.35 | 855 | 839 | 168.0 |
| A | 13 | 254 | 10767 | 59.1 | 855 | 839 | 168.0 |
| A | 8 | 192 | 9655 | 52.48 | 855 | 839 | 168.0 |
| B | 3 | 112 | 91808 | 586.4 | 846 | 826 | 155.2 |
| B | 10 | 246 | 61012 | 387.91 | 846 | 826 | 155.2 |
| B | 10 | 245 | 21998 | 136.46 | 846 | 826 | 155.2 |
| C | 14 | 238 | 130838 | 683.04 | 819 | 825 | 190.3 |
| C | 2 | 16 | 79562 | 413.66 | 819 | 825 | 190.3 |
| C | 15 | 208 | 31696 | 162.19 | 819 | 825 | 190.3 |
| D | 1 | 52 | 2546362 | 13243.33 | 751 | 739 | 192.2 |
| D | 7 | 38 | 160145 | 829.29 | 751 | 739 | 192.2 |
| D | 2 | 250 | 157610 | 816.1 | 751 | 739 | 192.2 |
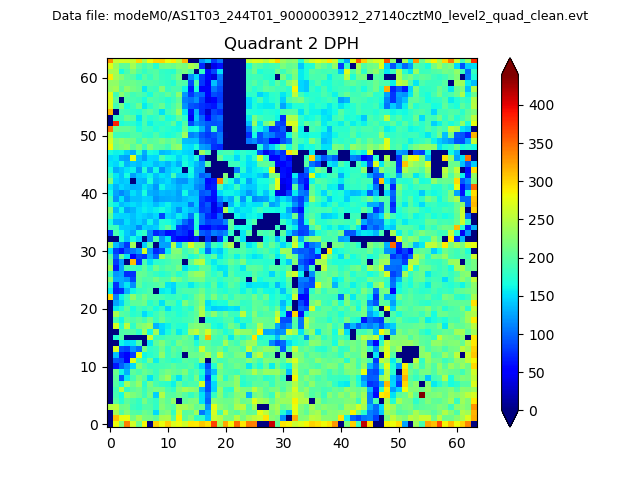
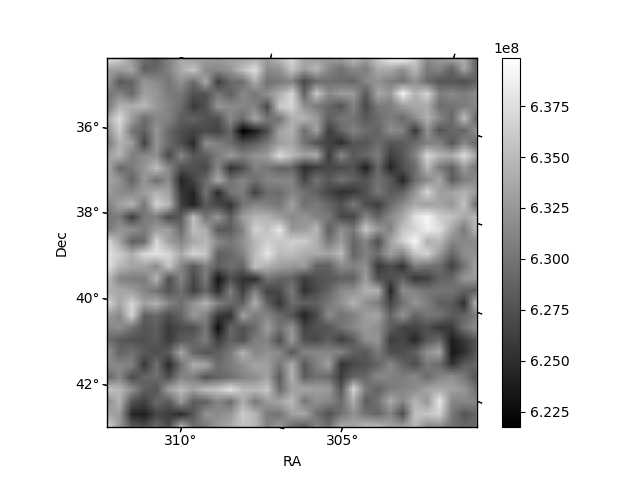
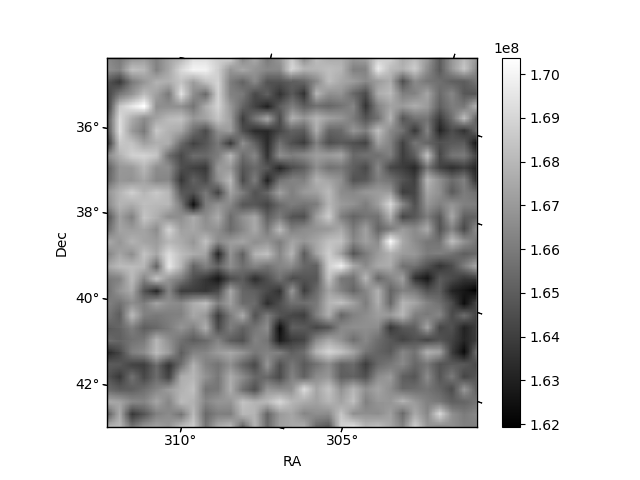
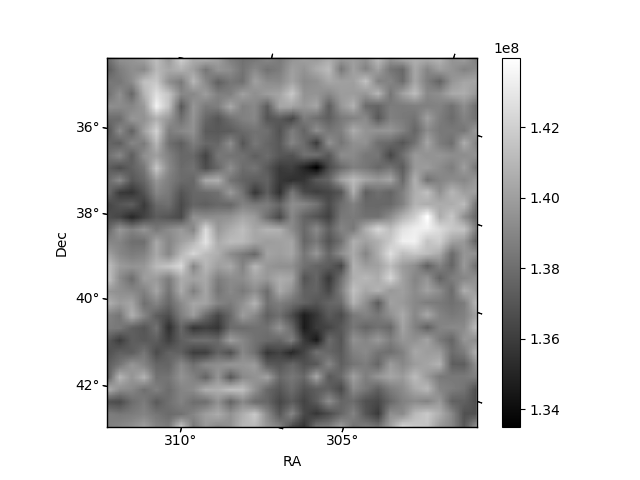
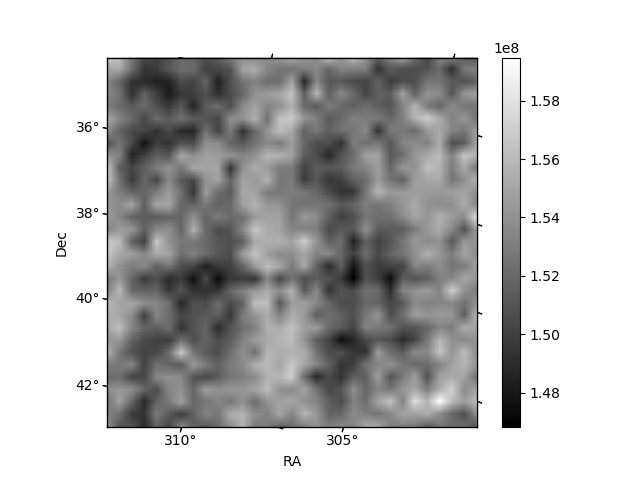
Histogram calculated using DETX and DETY for each event in the final _common_clean file
| Quadrant A | 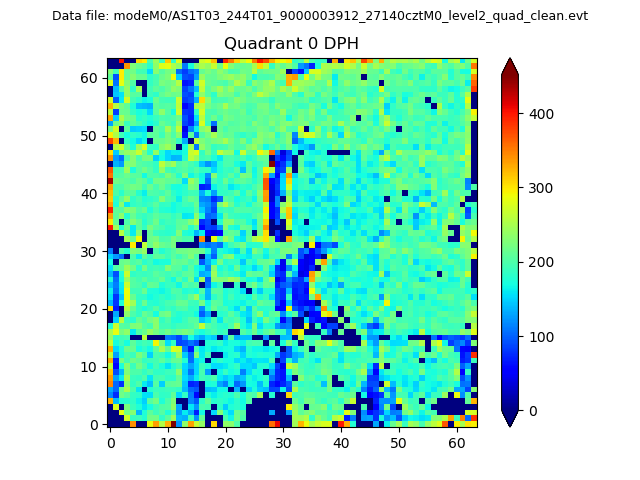 |
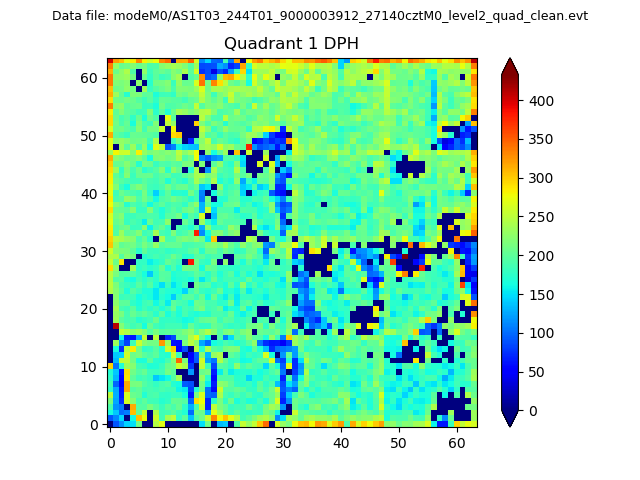 |
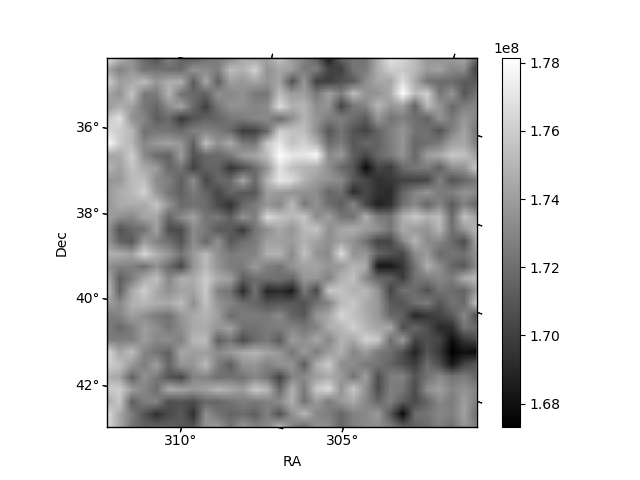
Quadrant B |
|---|---|---|---|
| Quadrant D | 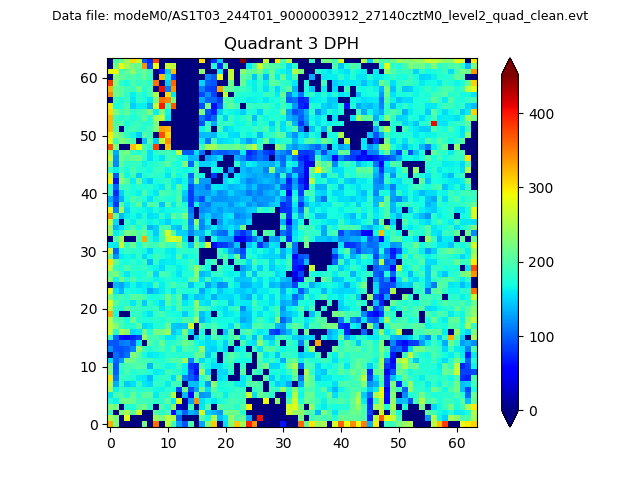 |
 |
Quadrant C |
| Plot type | Count rate plots | Images |
|---|---|---|
| Comparison with Poisson distribution Blue bars denote a histogram of data divided into 1 sec bins. Red curve is a Poisson curve with rate = median count rate of data. |
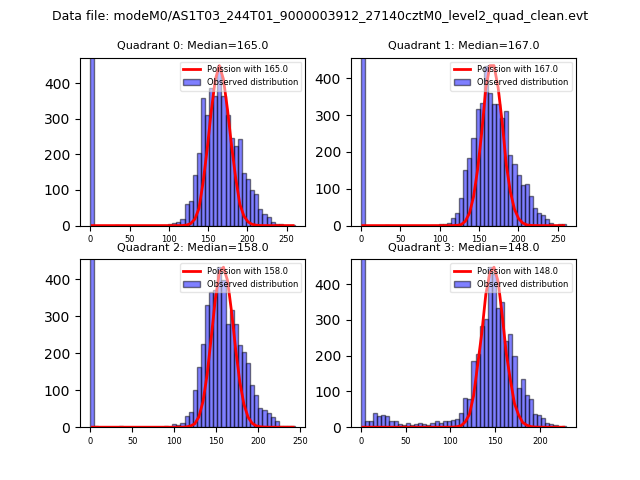 |
 |
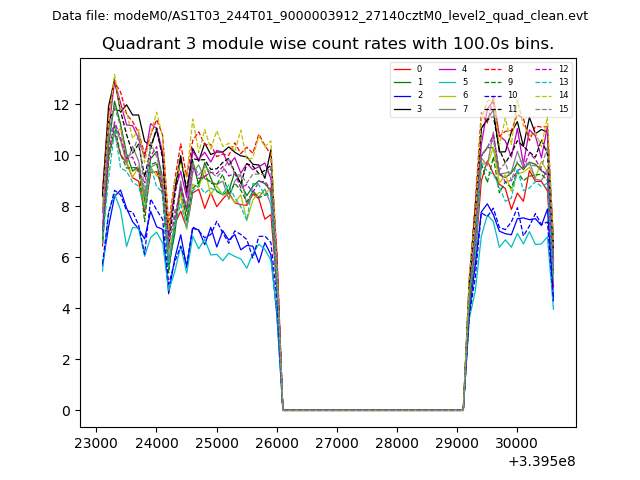
| Quadrant-wise count rates Data is divided into 100 sec bins |
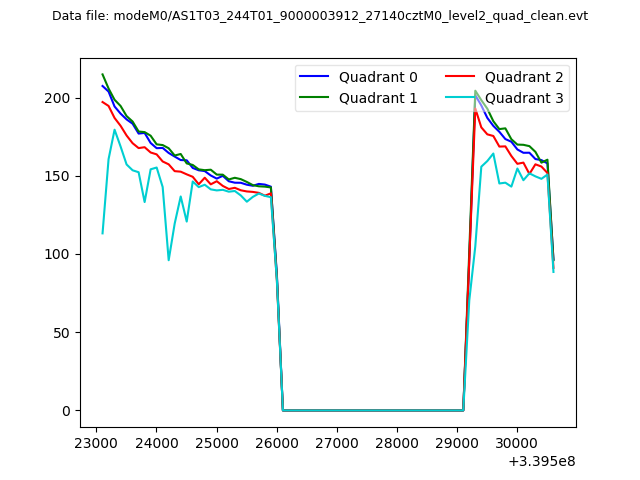 |
|
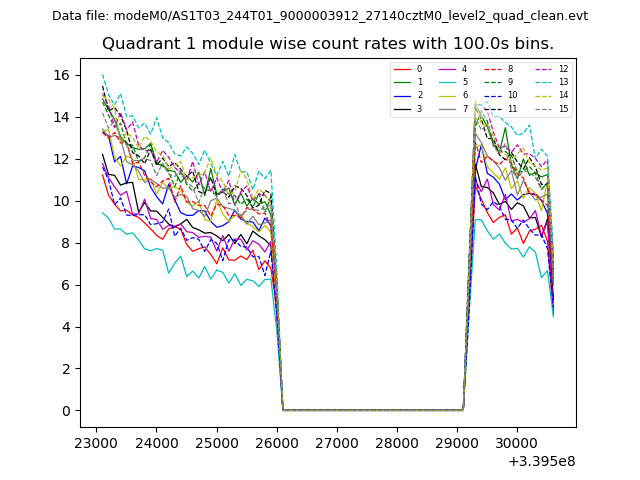
| Module-wise count rates for Quadrant A Data is divided into 100 sec bins |
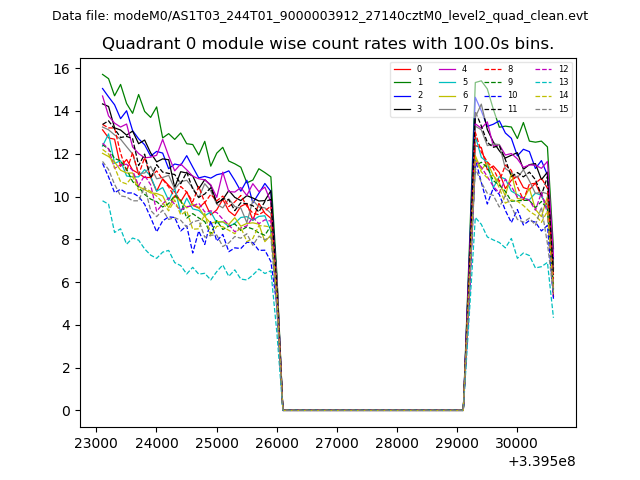 |
 |
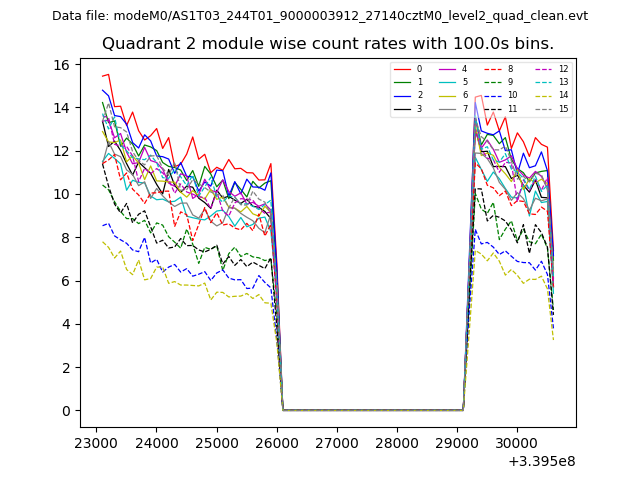
| Module-wise count rates for Quadrant B Data is divided into 100 sec bins |
 |
 |
| Module-wise count rates for Quadrant C Data is divided into 100 sec bins |
 |
 |
| Module-wise count rates for Quadrant D Data is divided into 100 sec bins |
 |
 |
| Parameter | Plot |
|---|---|
| CZT HV Monitor | 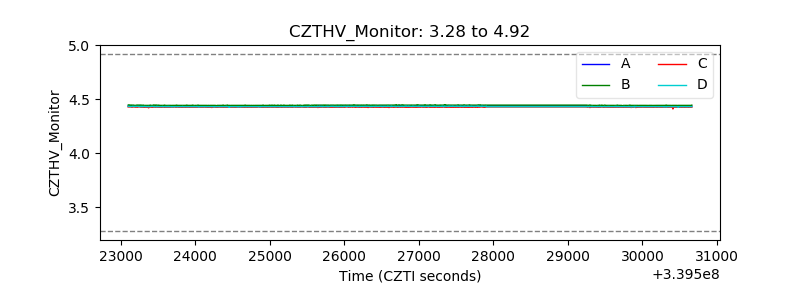 |
| D_VDD | 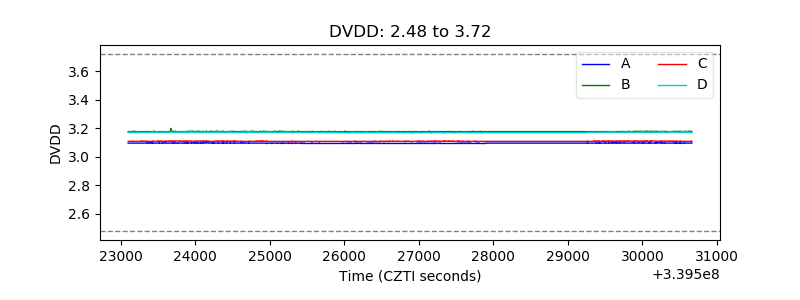 |
| Temperature 1 | 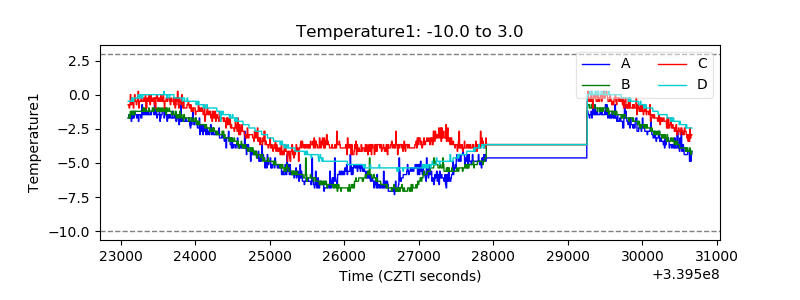 |
| Veto HV Monitor | 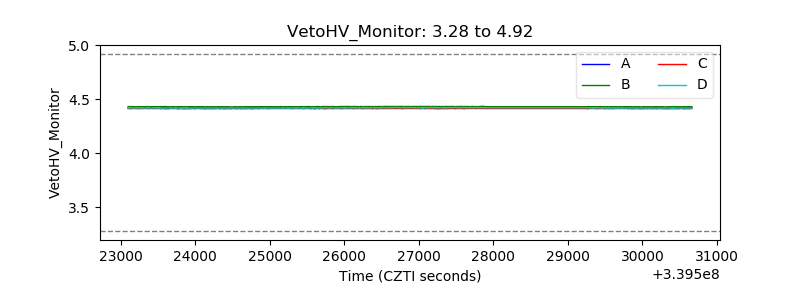 |
| Veto LLD | 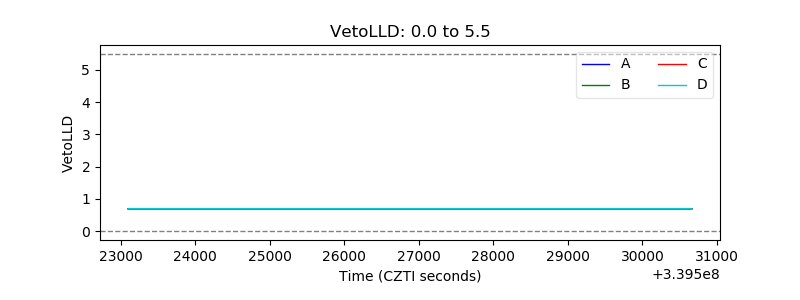 |
| Alpha Counter | 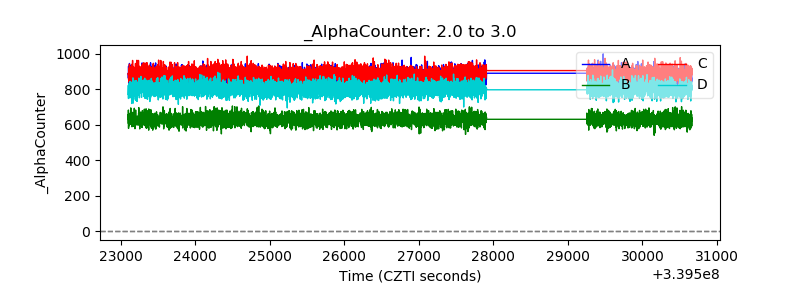 |
| _CPM_Rate | 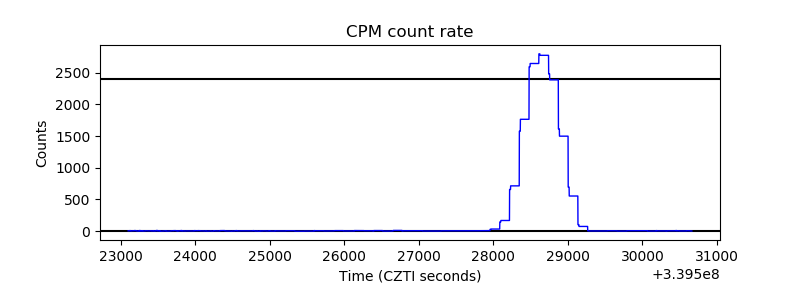 |
| CZT Counter |  |
| +2.5 Volts monitor |  |
| +5 Volts monitor |  |
| _ROLL_ROT | 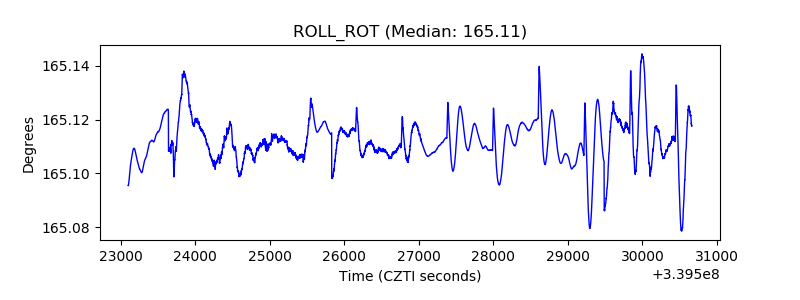 |
| _Roll_DEC | 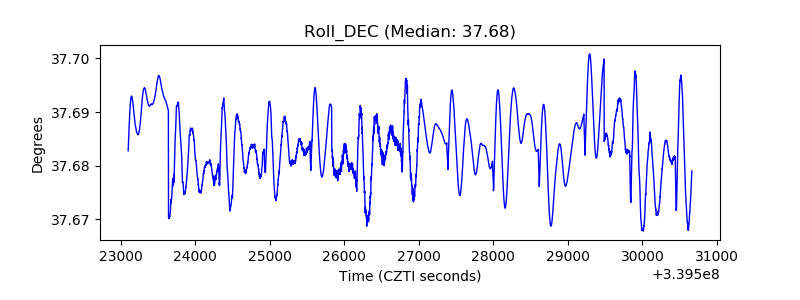 |
| _Roll_RA | 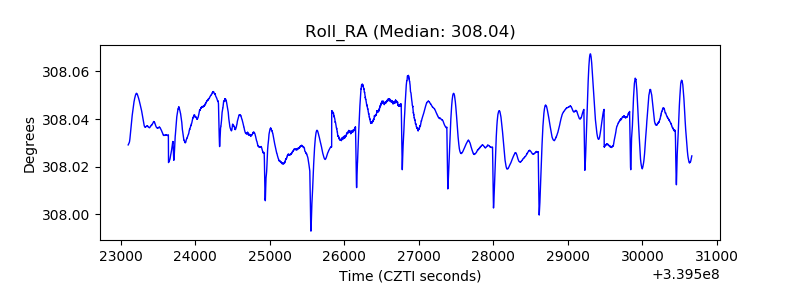 |
| Veto Counter | 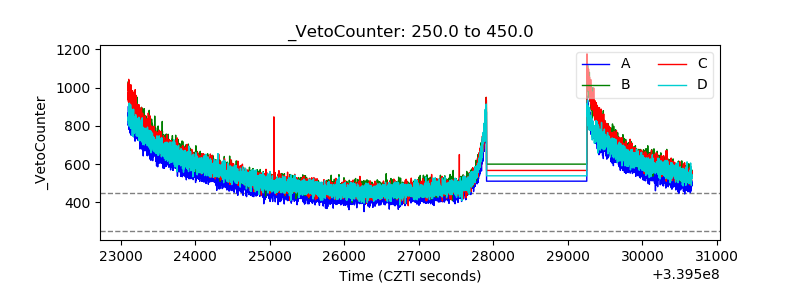 |