| Param | Original file | Final file |
|---|---|---|
| Filename | modeM0/AS1T03_244T01_9000003912_27141cztM0_level2.evt | modeM0/AS1T03_244T01_9000003912_27141cztM0_level2_quad_clean.evt |
| Size (bytes) | 521,498,880 | 96,906,240 |
| Size | 497.3 MB | 92.4 MB |
| Events in quadrant A | 3,308,698 | 648,248 |
| Events in quadrant B | 3,492,691 | 660,248 |
| Events in quadrant C | 3,475,116 | 623,963 |
| Events in quadrant D | 5,097,208 | 569,921 |
| Mode M9 | |||
|---|---|---|---|
| Quadrant | BADHDUFLAG | Total packets | Discarded packets |
| A | 0 | 15 | 0 |
| B | 0 | 16 | 0 |
| C | 0 | 16 | 0 |
| D | 0 | 16 | 0 |
| Mode M0 | |||
|---|---|---|---|
| Quadrant | BADHDUFLAG | Total packets | Discarded packets |
| A | 0 | 13649 | 0 |
| B | 0 | 14208 | 0 |
| C | 0 | 14101 | 0 |
| D | 0 | 19303 | 0 |
| Quadrant | Total seconds | Saturated seconds | Saturation percentage |
|---|---|---|---|
| A | 6192 | 56 | 0.904393% |
| B | 6192 | 65 | 1.049742% |
| C | 6192 | 119 | 1.921835% |
| D | 6191 | 496 | 8.011630% |
Noise dominated data is calculated using 1-second bins in cleaned event files. If a bin has >2000 counts, and if more than 50% of those come from <1% of pixels, then it is considered to be noise-dominated and hence unusable.
| Quadrant | # 1 sec bins | Bins with >0 counts | Bins with >2000 counts | High rate bins dominated by noise | Noise dominated (total time) | Noise dominated (detector-on time) | Marked lightcurve |
|---|---|---|---|---|---|---|---|
| A | 7547 | 6193 | 10 | 10 | 0.13% | 0.16% | 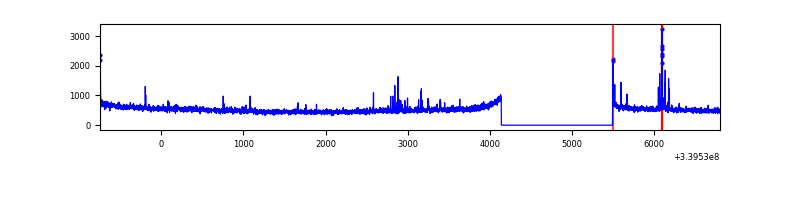 |
| B | 7547 | 6193 | 25 | 25 | 0.33% | 0.40% | 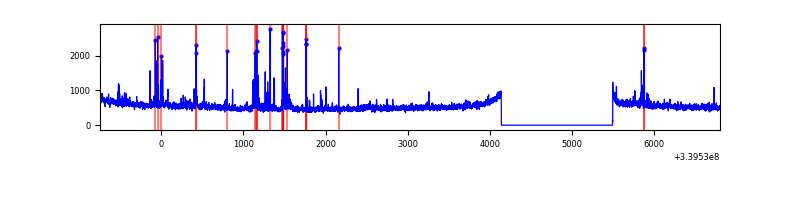 |
| C | 7547 | 6193 | 17 | 17 | 0.23% | 0.27% | 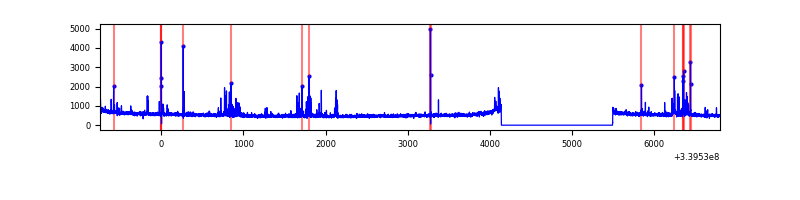 |
| D | 7546 | 6192 | 343 | 343 | 4.55% | 5.54% | 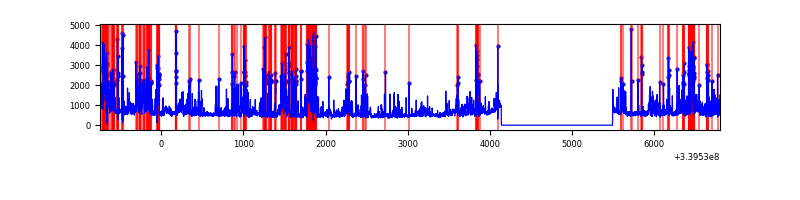 |
Top three noisy pixels from each quadrant. If the there are fewer than three noisy pixels in the level2.evt file, extra rows are filled as -1
| Pixel properties | Quadrant properties | ||||||
|---|---|---|---|---|---|---|---|
| Quadrant | DetID | PixID | Counts | Sigma | Mean | Median | Sigma |
| A | 13 | 248 | 47512 | 286.77 | 825 | 812 | 162.8 |
| A | 14 | 235 | 43107 | 259.72 | 825 | 812 | 162.8 |
| A | 8 | 192 | 18046 | 105.83 | 825 | 812 | 162.8 |
| B | 10 | 246 | 153057 | 993.9 | 823 | 803 | 153.2 |
| B | 3 | 112 | 60952 | 392.65 | 823 | 803 | 153.2 |
| B | 10 | 245 | 31244 | 198.72 | 823 | 803 | 153.2 |
| C | 2 | 16 | 216669 | 1162.78 | 797 | 803 | 185.6 |
| C | 14 | 238 | 127205 | 680.88 | 797 | 803 | 185.6 |
| C | 15 | 208 | 20988 | 108.73 | 797 | 803 | 185.6 |
| D | 1 | 52 | 1748127 | 9035.13 | 767 | 753 | 193.4 |
| D | 7 | 38 | 248256 | 1279.76 | 767 | 753 | 193.4 |
| D | 2 | 250 | 163344 | 840.71 | 767 | 753 | 193.4 |
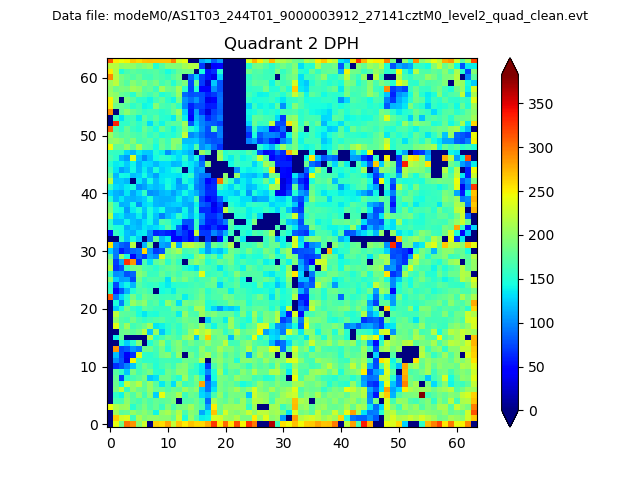
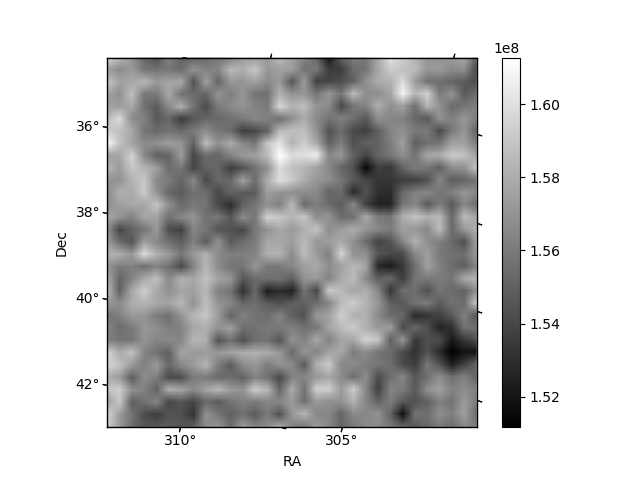
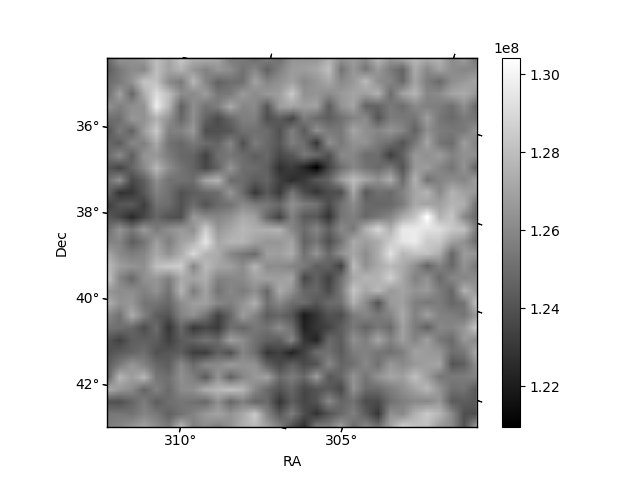
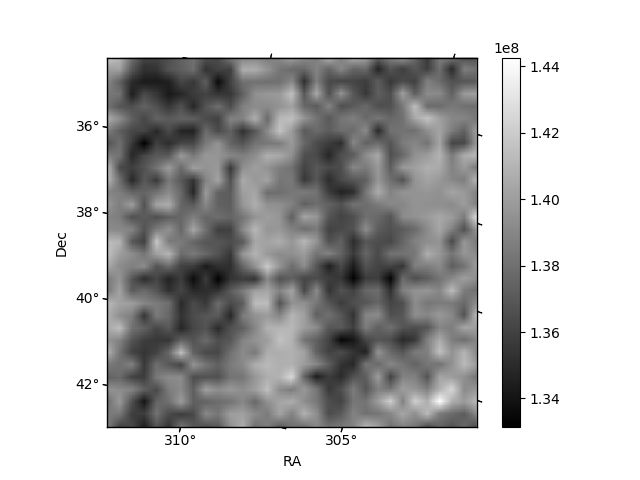
Histogram calculated using DETX and DETY for each event in the final _common_clean file
| Quadrant A | 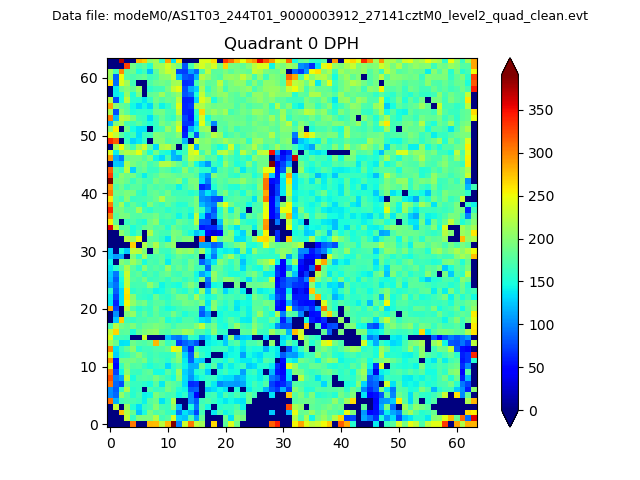 |
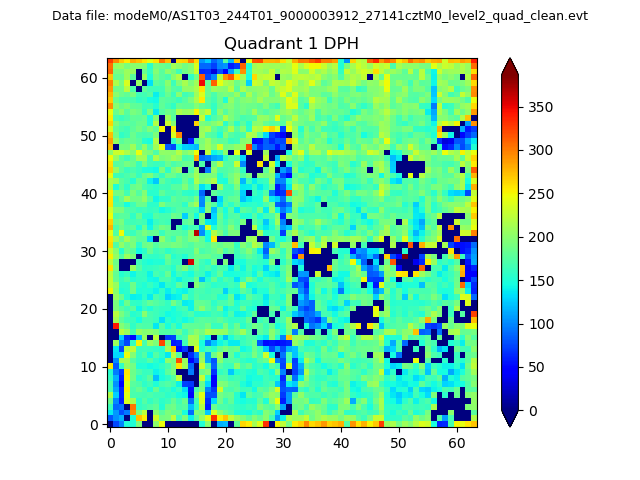 |
Quadrant B |
|---|---|---|---|
| Quadrant D | 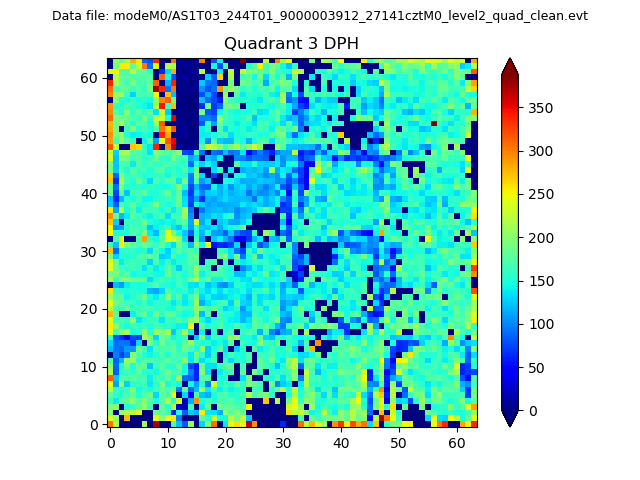 |
 |
Quadrant C |
| Plot type | Count rate plots | Images |
|---|---|---|
| Comparison with Poisson distribution Blue bars denote a histogram of data divided into 1 sec bins. Red curve is a Poisson curve with rate = median count rate of data. |
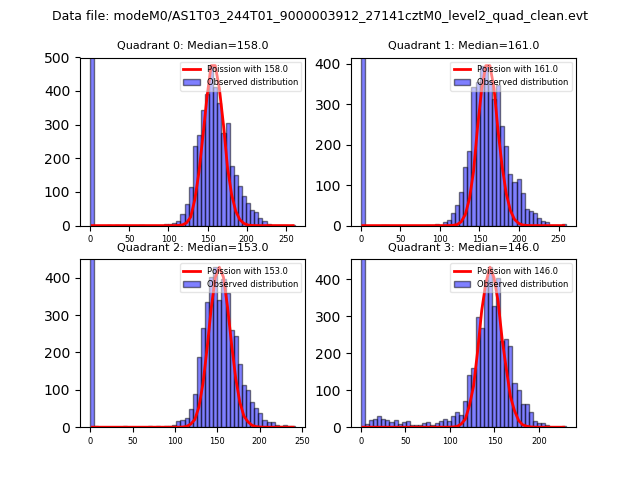 |
 |
| Quadrant-wise count rates Data is divided into 100 sec bins |
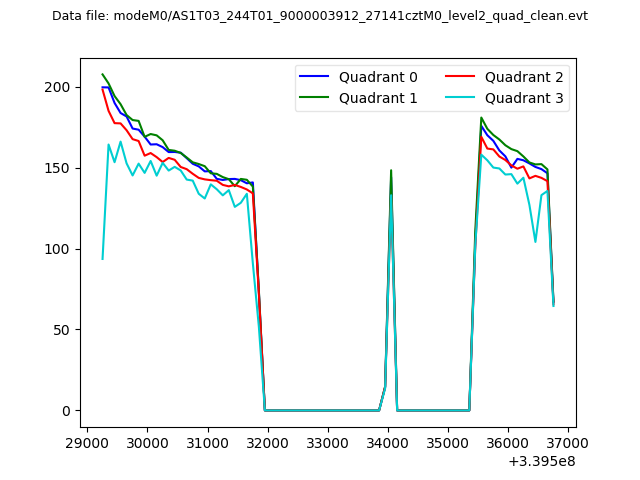 |
|
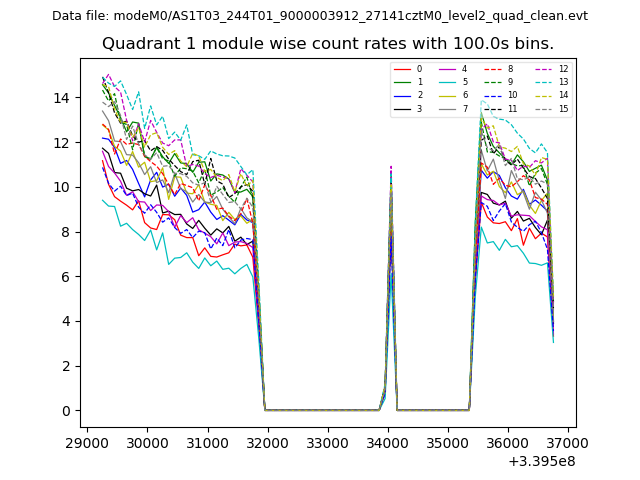
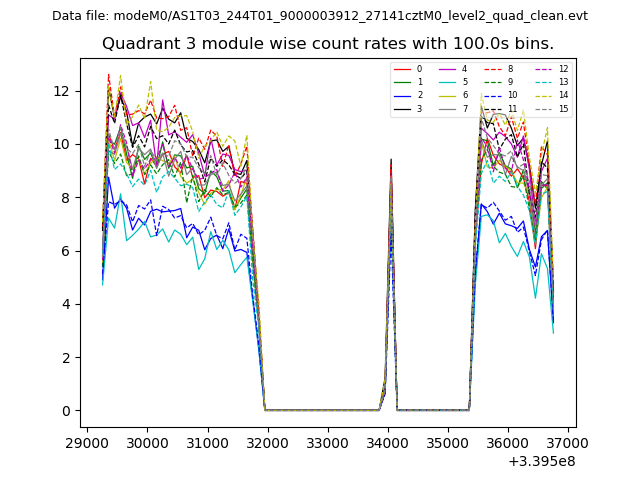
| Module-wise count rates for Quadrant A Data is divided into 100 sec bins |
 |
 |
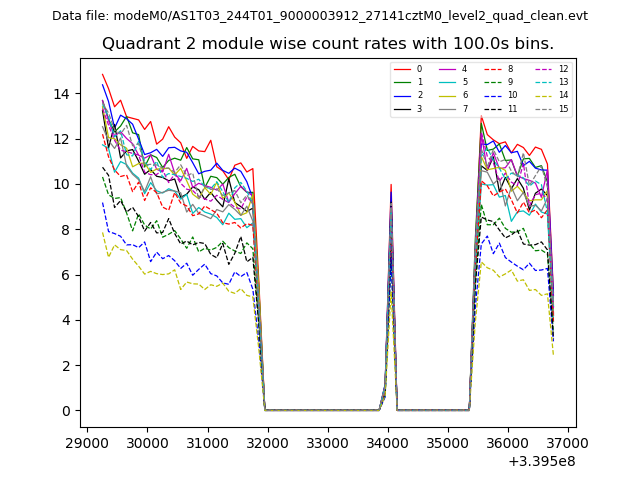
| Module-wise count rates for Quadrant B Data is divided into 100 sec bins |
 |
 |
| Module-wise count rates for Quadrant C Data is divided into 100 sec bins |
 |
 |
| Module-wise count rates for Quadrant D Data is divided into 100 sec bins |
 |
 |
| Parameter | Plot |
|---|---|
| CZT HV Monitor | 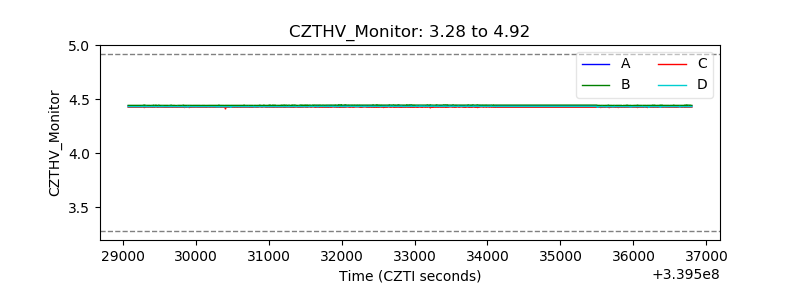 |
| D_VDD | 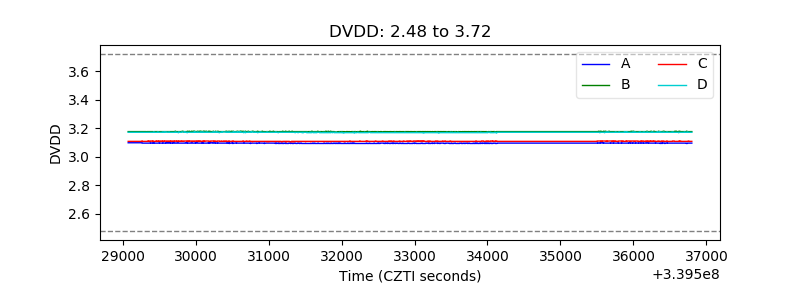 |
| Temperature 1 | 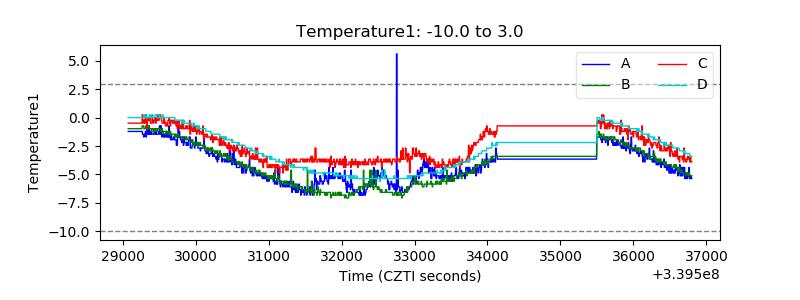 |
| Veto HV Monitor | 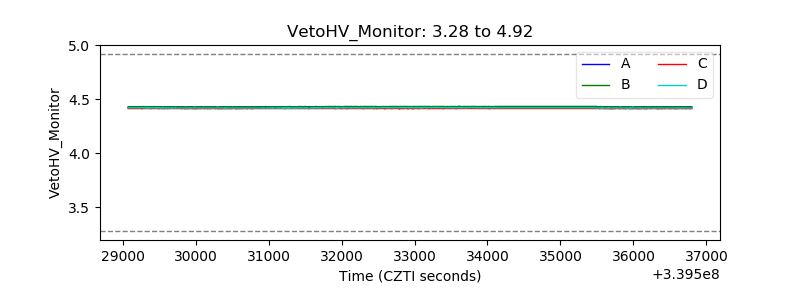 |
| Veto LLD | 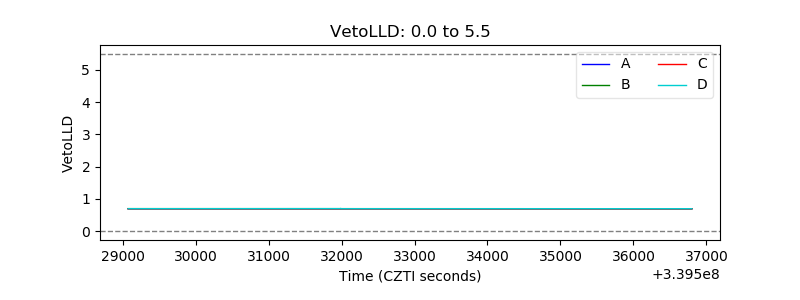 |
| Alpha Counter | 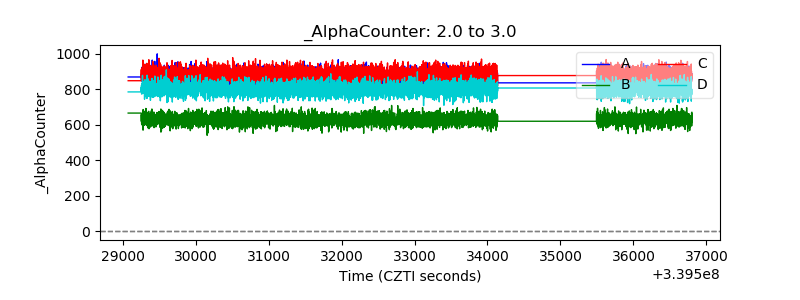 |
| _CPM_Rate | 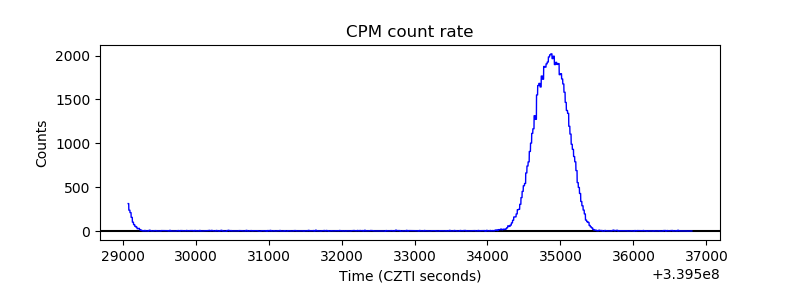 |
| CZT Counter | 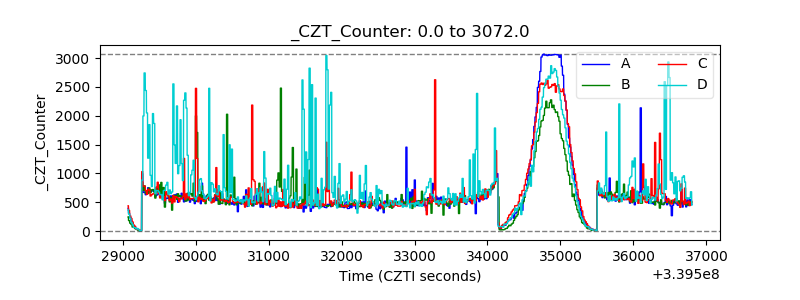 |
| +2.5 Volts monitor |  |
| +5 Volts monitor |  |
| _ROLL_ROT |  |
| _Roll_DEC | 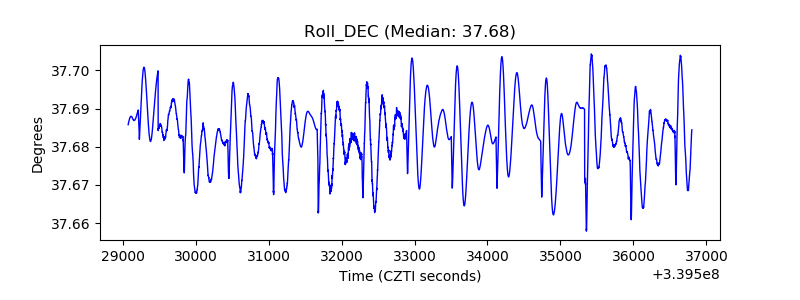 |
| _Roll_RA | 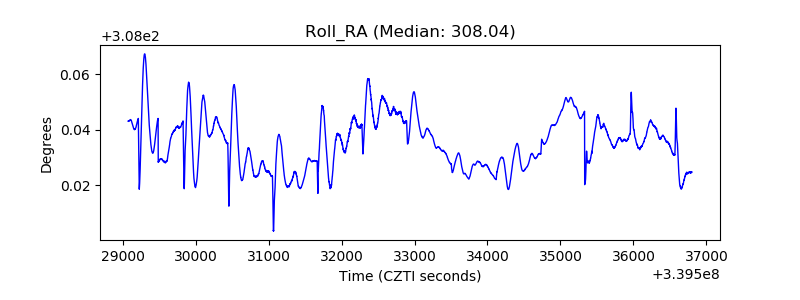 |
| Veto Counter |  |