| Param | Original file | Final file |
|---|---|---|
| Filename | modeM0/AS1T03_244T01_9000003912_27142cztM0_level2.evt | modeM0/AS1T03_244T01_9000003912_27142cztM0_level2_quad_clean.evt |
| Size (bytes) | 513,132,480 | 96,042,240 |
| Size | 489.4 MB | 91.6 MB |
| Events in quadrant A | 3,278,714 | 630,329 |
| Events in quadrant B | 3,732,530 | 639,270 |
| Events in quadrant C | 3,482,806 | 612,617 |
| Events in quadrant D | 4,610,143 | 578,040 |
| Mode M9 | |||
|---|---|---|---|
| Quadrant | BADHDUFLAG | Total packets | Discarded packets |
| A | 0 | 16 | 0 |
| B | 0 | 17 | 0 |
| C | 0 | 17 | 0 |
| D | 0 | 17 | 0 |
| Mode M0 | |||
|---|---|---|---|
| Quadrant | BADHDUFLAG | Total packets | Discarded packets |
| A | 0 | 13768 | 0 |
| B | 0 | 15081 | 0 |
| C | 0 | 14344 | 0 |
| D | 0 | 18050 | 0 |
| Quadrant | Total seconds | Saturated seconds | Saturation percentage |
|---|---|---|---|
| A | 6421 | 49 | 0.763121% |
| B | 6421 | 125 | 1.946737% |
| C | 6421 | 146 | 2.273789% |
| D | 6421 | 346 | 5.388569% |
Noise dominated data is calculated using 1-second bins in cleaned event files. If a bin has >2000 counts, and if more than 50% of those come from <1% of pixels, then it is considered to be noise-dominated and hence unusable.
| Quadrant | # 1 sec bins | Bins with >0 counts | Bins with >2000 counts | High rate bins dominated by noise | Noise dominated (total time) | Noise dominated (detector-on time) | Marked lightcurve |
|---|---|---|---|---|---|---|---|
| A | 7586 | 6422 | 11 | 11 | 0.15% | 0.17% | 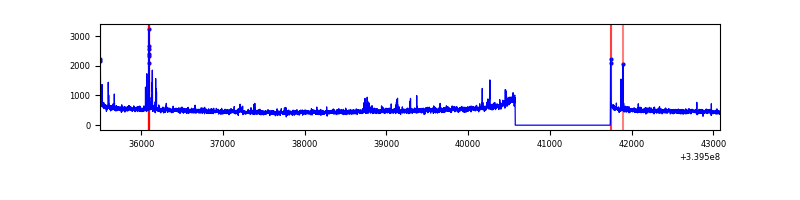 |
| B | 7586 | 6422 | 83 | 83 | 1.09% | 1.29% | 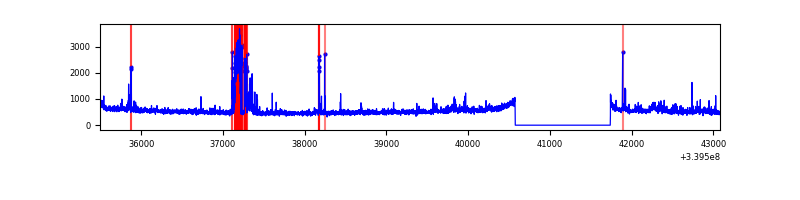 |
| C | 7586 | 6422 | 31 | 31 | 0.41% | 0.48% | 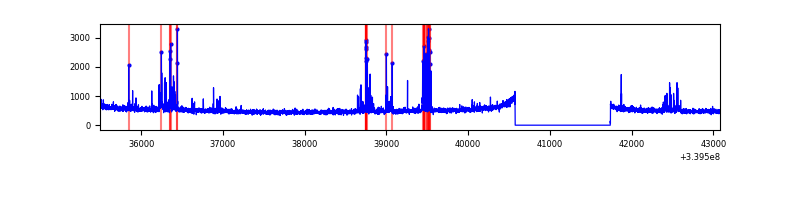 |
| D | 7586 | 6422 | 230 | 230 | 3.03% | 3.58% | 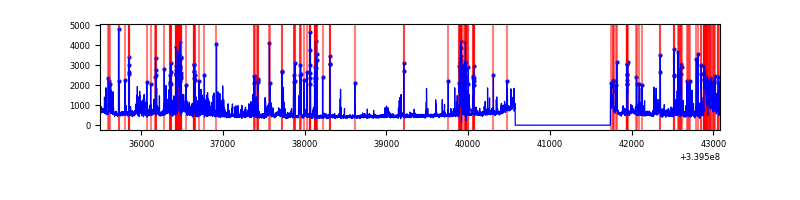 |
Top three noisy pixels from each quadrant. If the there are fewer than three noisy pixels in the level2.evt file, extra rows are filled as -1
| Pixel properties | Quadrant properties | ||||||
|---|---|---|---|---|---|---|---|
| Quadrant | DetID | PixID | Counts | Sigma | Mean | Median | Sigma |
| A | 13 | 248 | 52710 | 317.34 | 819 | 804 | 163.6 |
| A | 14 | 235 | 45479 | 273.13 | 819 | 804 | 163.6 |
| A | 8 | 192 | 18118 | 105.85 | 819 | 804 | 163.6 |
| B | 10 | 245 | 312649 | 2037.53 | 817 | 797 | 153.1 |
| B | 3 | 112 | 135640 | 881.01 | 817 | 797 | 153.1 |
| B | 0 | 189 | 22964 | 144.83 | 817 | 797 | 153.1 |
| C | 15 | 208 | 171728 | 916.8 | 794 | 800 | 186.4 |
| C | 14 | 238 | 127658 | 680.43 | 794 | 800 | 186.4 |
| C | 2 | 16 | 91480 | 486.38 | 794 | 800 | 186.4 |
| D | 1 | 52 | 1142897 | 5786.82 | 775 | 760 | 197.4 |
| D | 7 | 38 | 261833 | 1322.77 | 775 | 760 | 197.4 |
| D | 12 | 233 | 163724 | 825.68 | 775 | 760 | 197.4 |
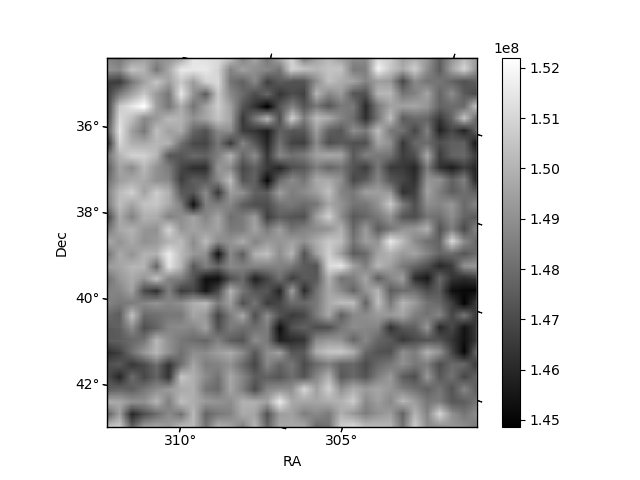
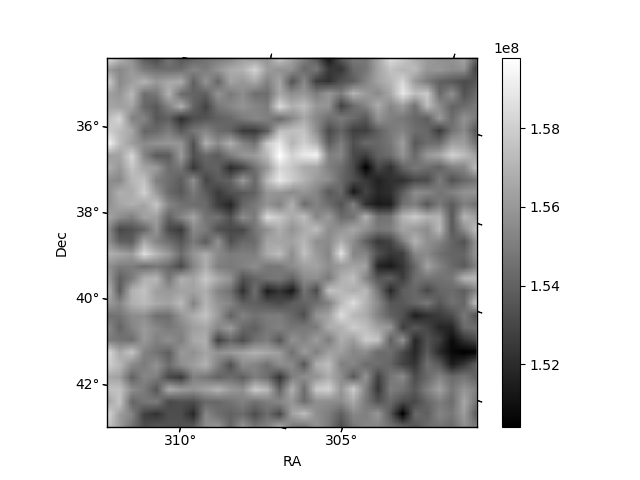
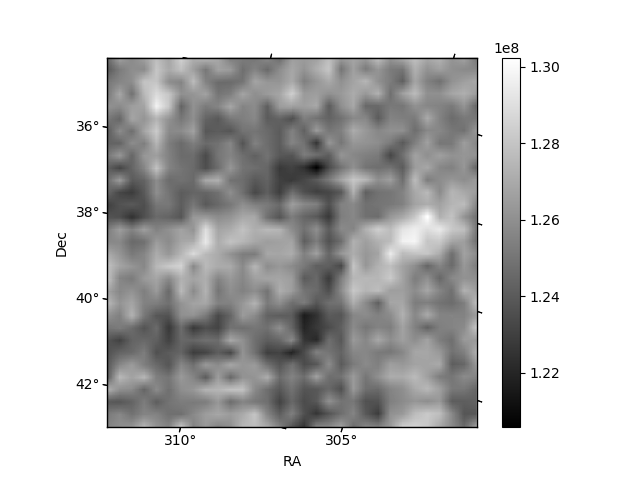
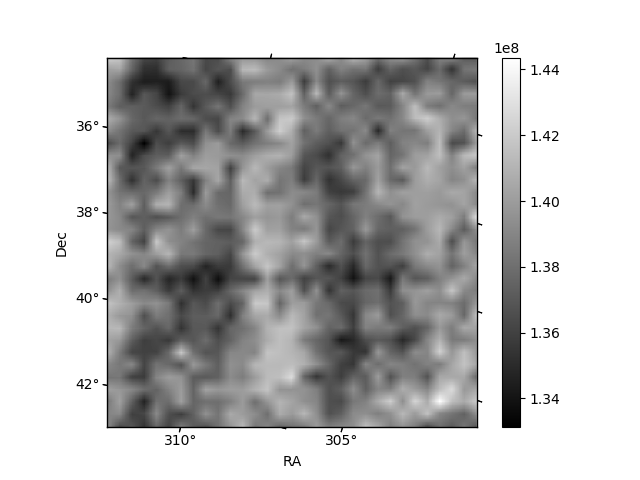
Histogram calculated using DETX and DETY for each event in the final _common_clean file
| Quadrant A | 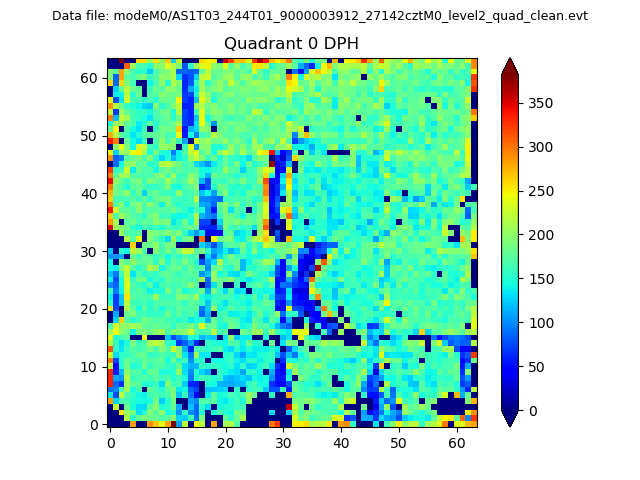 |
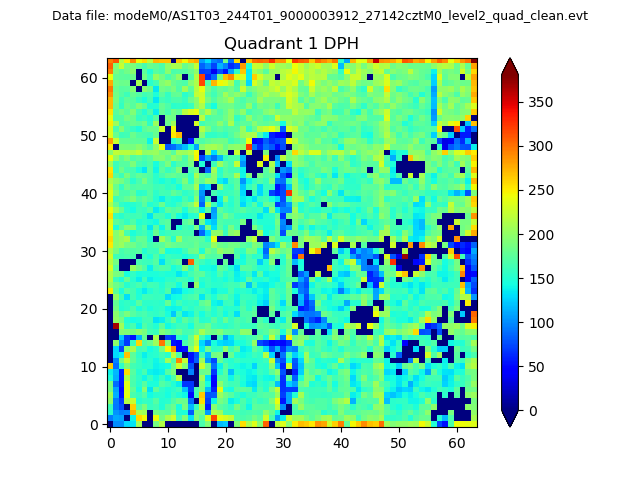 |
Quadrant B |
|---|---|---|---|
| Quadrant D | 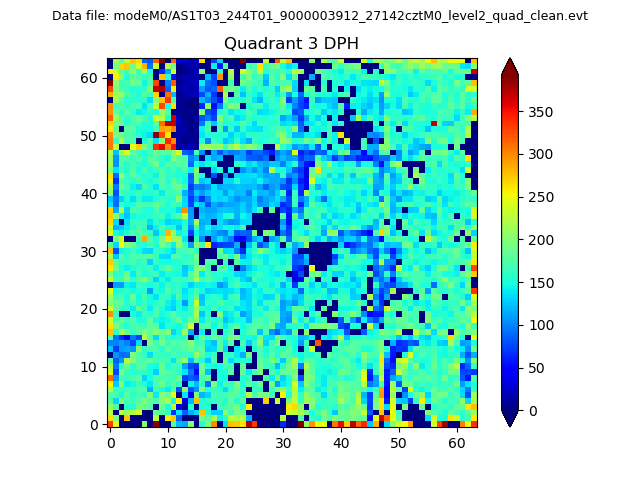 |
 |
Quadrant C |
| Plot type | Count rate plots | Images |
|---|---|---|
| Comparison with Poisson distribution Blue bars denote a histogram of data divided into 1 sec bins. Red curve is a Poisson curve with rate = median count rate of data. |
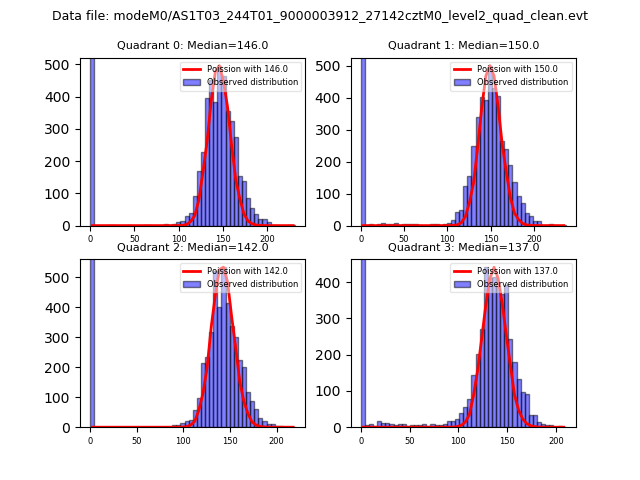 |
 |
| Quadrant-wise count rates Data is divided into 100 sec bins |
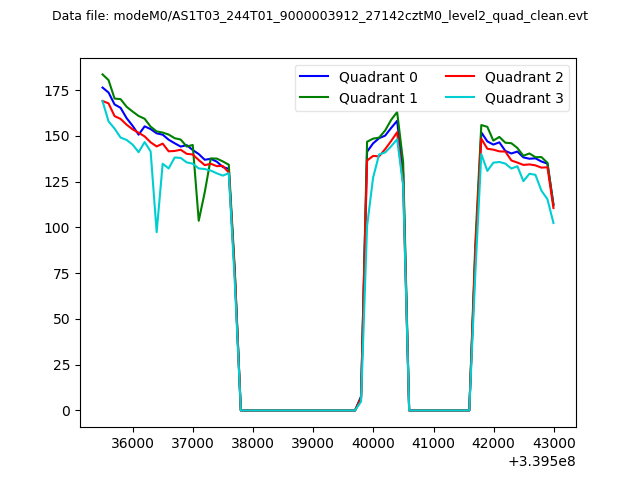 |
|
| Module-wise count rates for Quadrant A Data is divided into 100 sec bins |
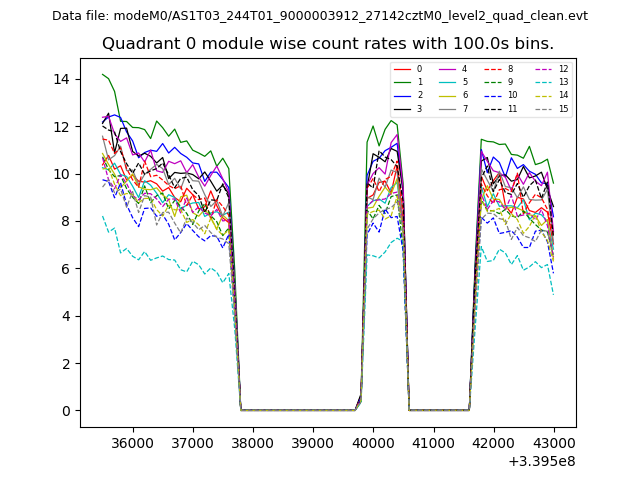 |
 |
| Module-wise count rates for Quadrant B Data is divided into 100 sec bins |
 |
 |
| Module-wise count rates for Quadrant C Data is divided into 100 sec bins |
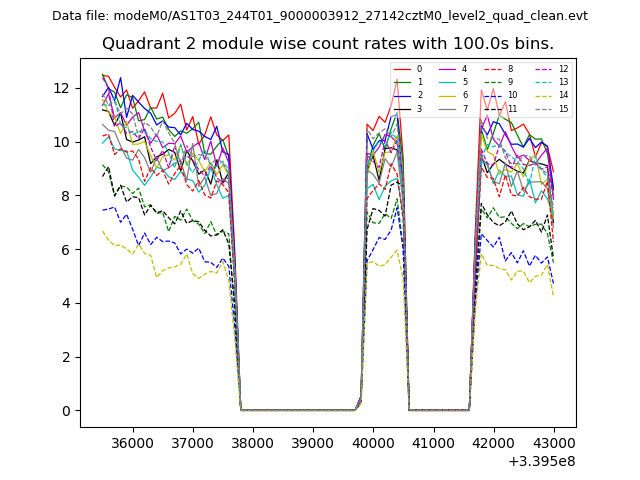 |
 |
| Module-wise count rates for Quadrant D Data is divided into 100 sec bins |
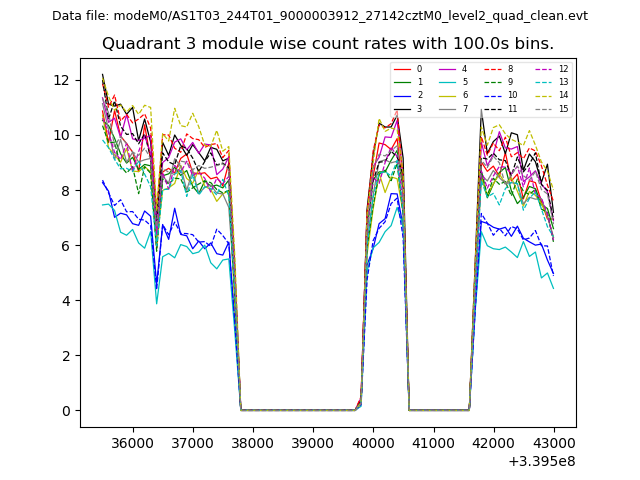 |
 |
| Parameter | Plot |
|---|---|
| CZT HV Monitor | 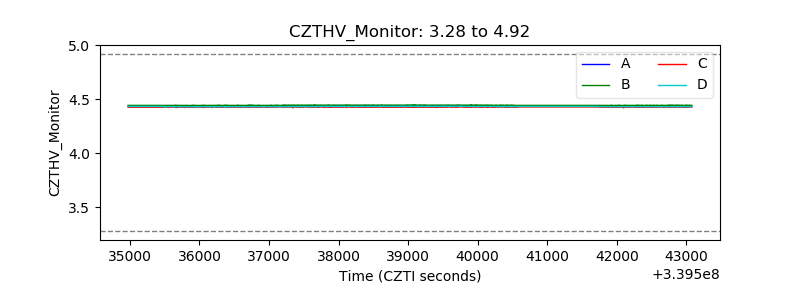 |
| D_VDD | 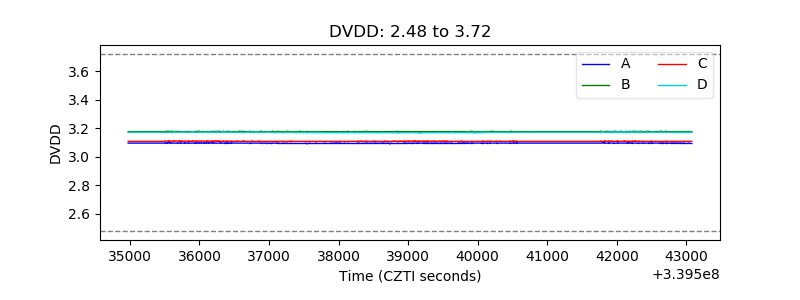 |
| Temperature 1 | 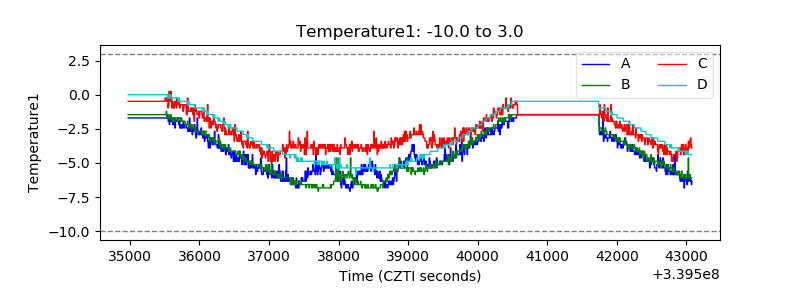 |
| Veto HV Monitor | 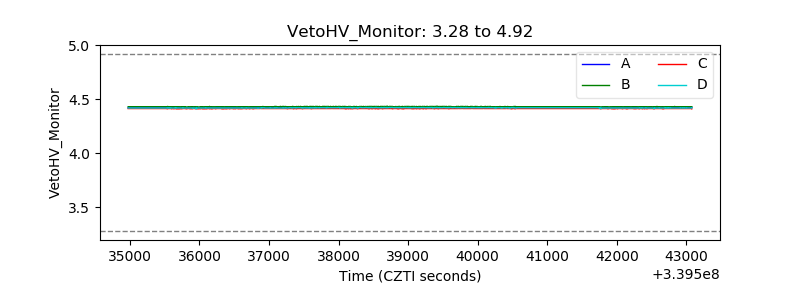 |
| Veto LLD | 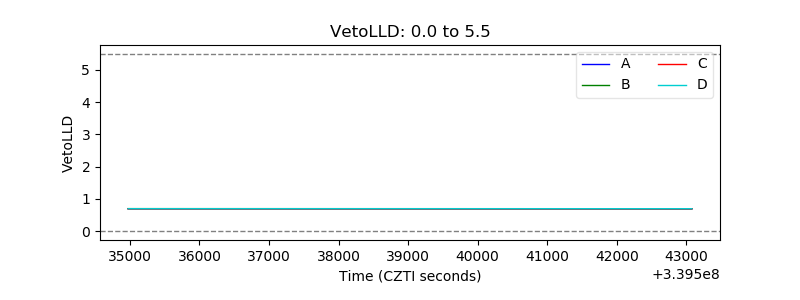 |
| Alpha Counter |  |
| _CPM_Rate | 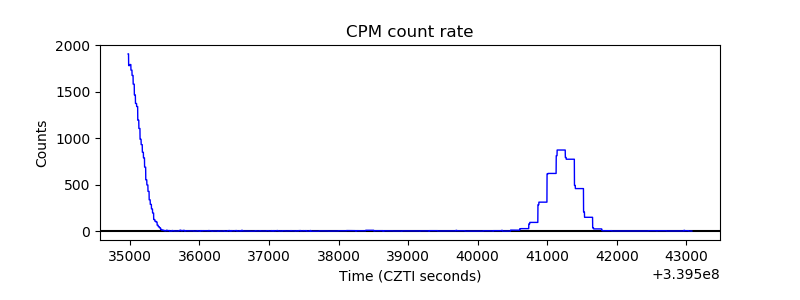 |
| CZT Counter |  |
| +2.5 Volts monitor | 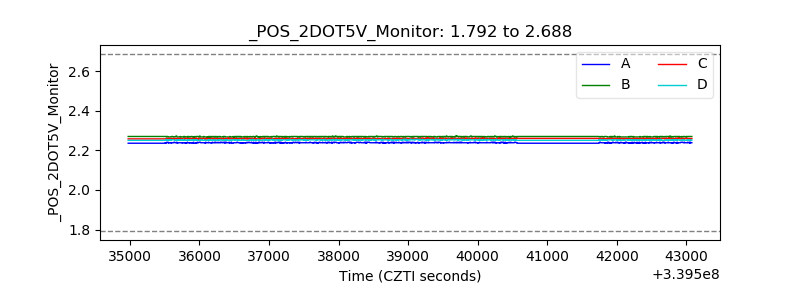 |
| +5 Volts monitor |  |
| _ROLL_ROT | 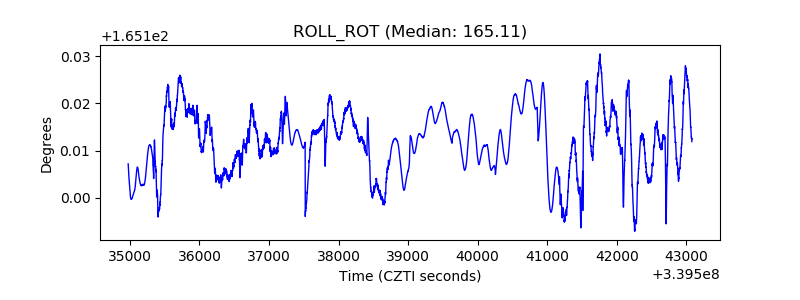 |
| _Roll_DEC | 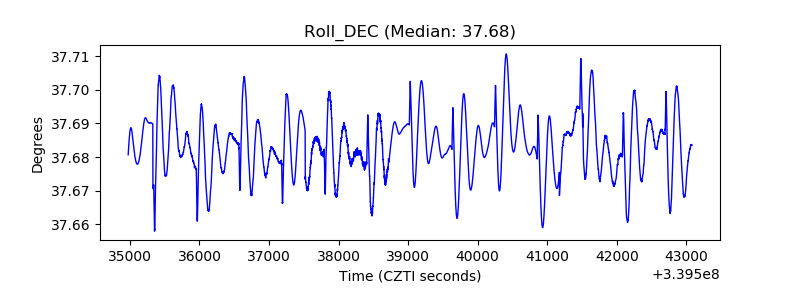 |
| _Roll_RA | 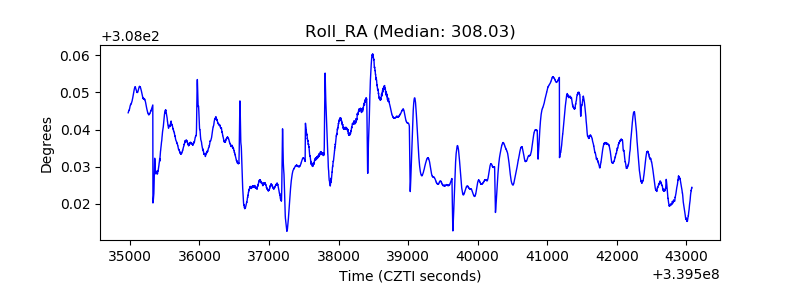 |
| Veto Counter | 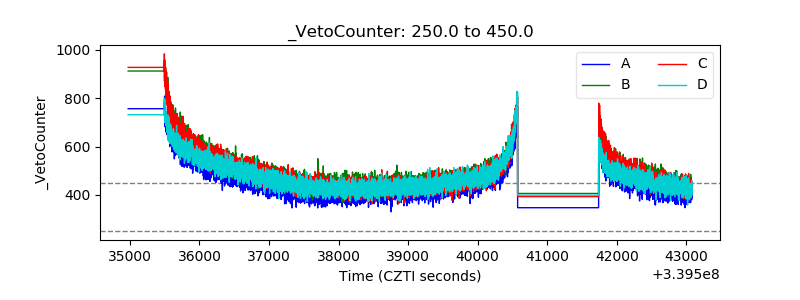 |