| Param | Original file | Final file |
|---|---|---|
| Filename | modeM0/AS1T03_244T01_9000003912_27144cztM0_level2.evt | modeM0/AS1T03_244T01_9000003912_27144cztM0_level2_quad_clean.evt |
| Size (bytes) | 514,388,160 | 99,725,760 |
| Size | 490.6 MB | 95.1 MB |
| Events in quadrant A | 3,462,380 | 638,646 |
| Events in quadrant B | 3,632,509 | 649,147 |
| Events in quadrant C | 3,523,218 | 621,523 |
| Events in quadrant D | 4,465,652 | 603,599 |
| Mode M9 | |||
|---|---|---|---|
| Quadrant | BADHDUFLAG | Total packets | Discarded packets |
| A | 0 | 7 | 0 |
| B | 0 | 8 | 0 |
| C | 0 | 8 | 0 |
| D | 0 | 8 | 0 |
| Mode M0 | |||
|---|---|---|---|
| Quadrant | BADHDUFLAG | Total packets | Discarded packets |
| A | 0 | 15048 | 0 |
| B | 0 | 15397 | 0 |
| C | 0 | 15096 | 0 |
| D | 0 | 18433 | 0 |
| Quadrant | Total seconds | Saturated seconds | Saturation percentage |
|---|---|---|---|
| A | 7290 | 37 | 0.507545% |
| B | 7290 | 54 | 0.740741% |
| C | 7290 | 61 | 0.836763% |
| D | 7290 | 172 | 2.359396% |
Noise dominated data is calculated using 1-second bins in cleaned event files. If a bin has >2000 counts, and if more than 50% of those come from <1% of pixels, then it is considered to be noise-dominated and hence unusable.
| Quadrant | # 1 sec bins | Bins with >0 counts | Bins with >2000 counts | High rate bins dominated by noise | Noise dominated (total time) | Noise dominated (detector-on time) | Marked lightcurve |
|---|---|---|---|---|---|---|---|
| A | 7710 | 7292 | 3 | 3 | 0.04% | 0.04% | 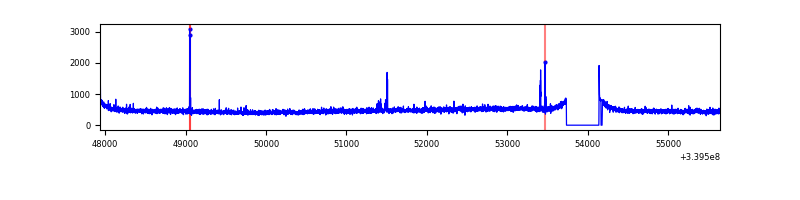 |
| B | 7710 | 7292 | 1 | 1 | 0.01% | 0.01% | 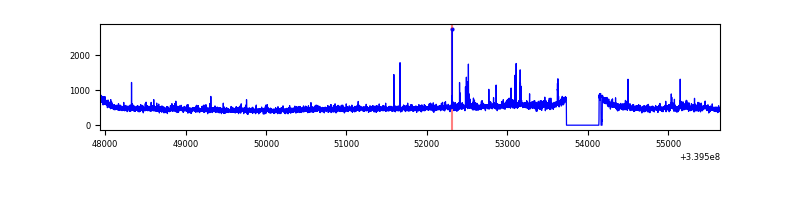 |
| C | 7710 | 7292 | 1 | 1 | 0.01% | 0.01% | 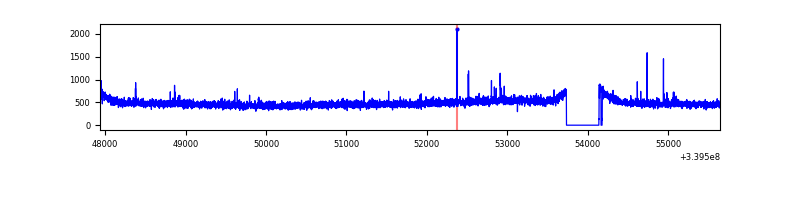 |
| D | 7710 | 7292 | 113 | 113 | 1.47% | 1.55% | 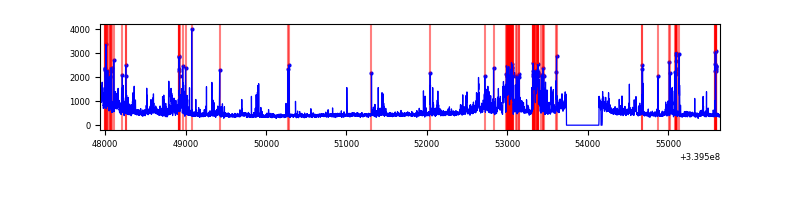 |
Top three noisy pixels from each quadrant. If the there are fewer than three noisy pixels in the level2.evt file, extra rows are filled as -1
| Pixel properties | Quadrant properties | ||||||
|---|---|---|---|---|---|---|---|
| Quadrant | DetID | PixID | Counts | Sigma | Mean | Median | Sigma |
| A | 14 | 235 | 27353 | 148.5 | 883 | 862 | 178.4 |
| A | 13 | 254 | 13156 | 68.91 | 883 | 862 | 178.4 |
| A | 8 | 192 | 11969 | 62.26 | 883 | 862 | 178.4 |
| B | 3 | 112 | 51060 | 296.35 | 883 | 859 | 169.4 |
| B | 3 | 64 | 47130 | 273.15 | 883 | 859 | 169.4 |
| B | 15 | 33 | 24862 | 141.7 | 883 | 859 | 169.4 |
| C | 14 | 238 | 136140 | 667.65 | 856 | 862 | 202.6 |
| C | 15 | 208 | 26442 | 126.25 | 856 | 862 | 202.6 |
| C | 2 | 16 | 12684 | 58.35 | 856 | 862 | 202.6 |
| D | 7 | 38 | 314774 | 1441.1 | 851 | 831 | 217.8 |
| D | 12 | 233 | 309528 | 1417.02 | 851 | 831 | 217.8 |
| D | 1 | 52 | 285151 | 1305.12 | 851 | 831 | 217.8 |
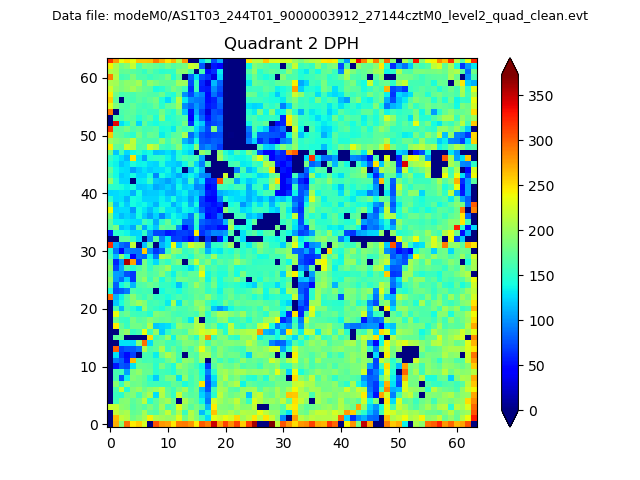
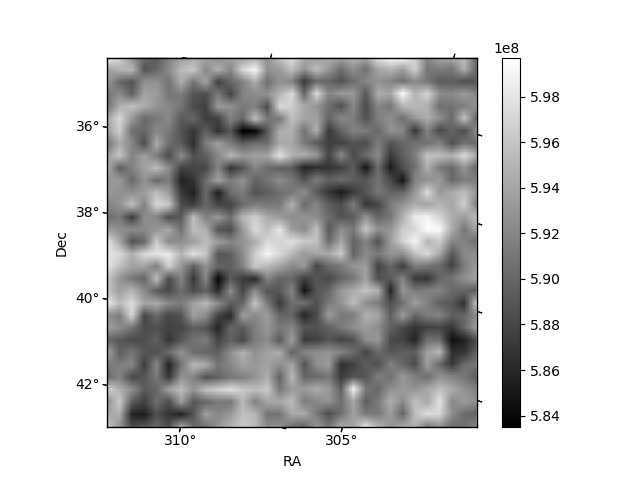
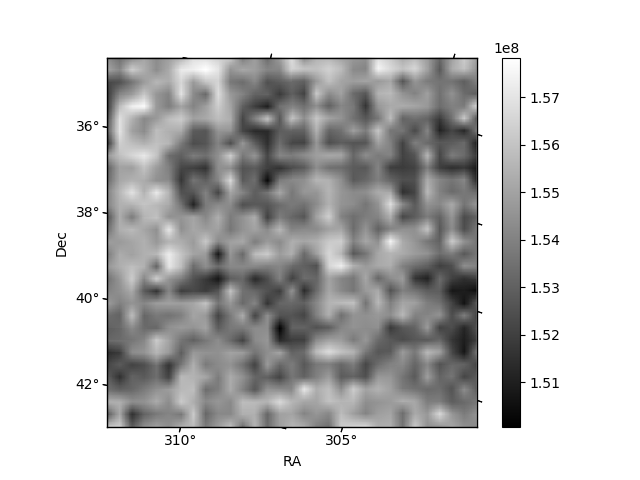
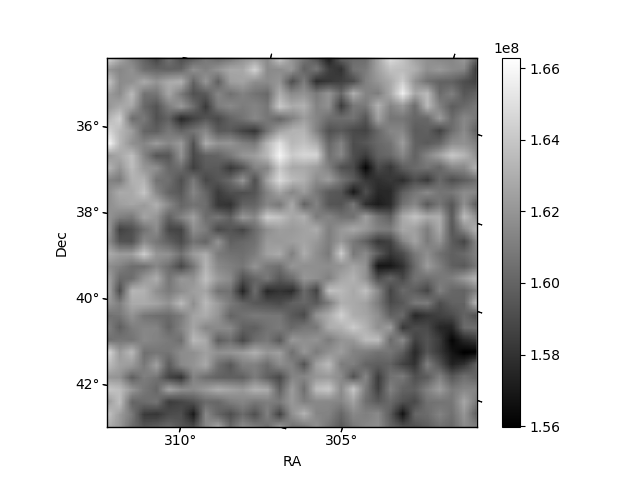
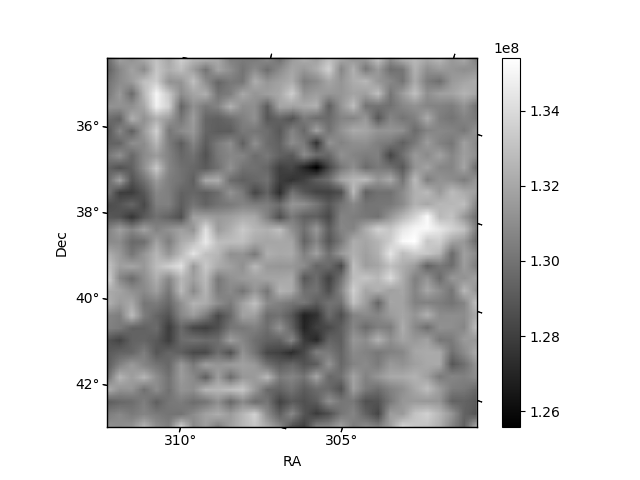
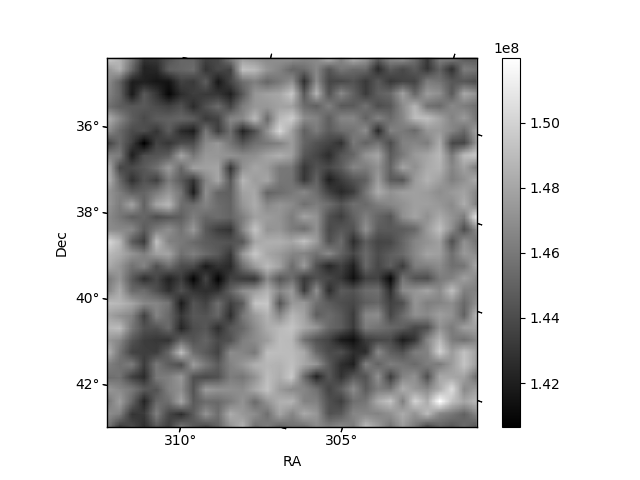
Histogram calculated using DETX and DETY for each event in the final _common_clean file
| Quadrant A | 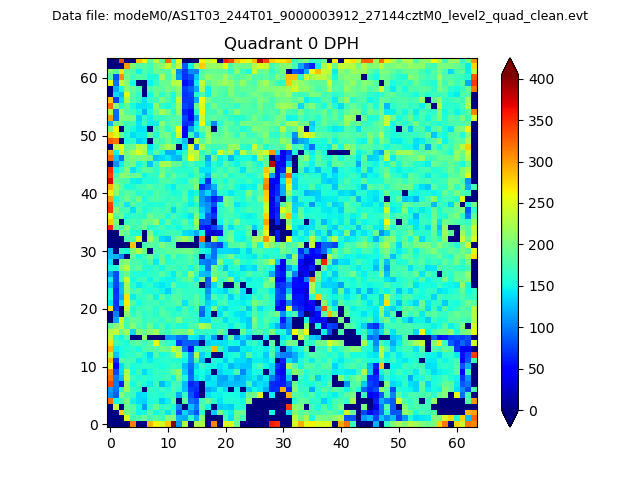 |
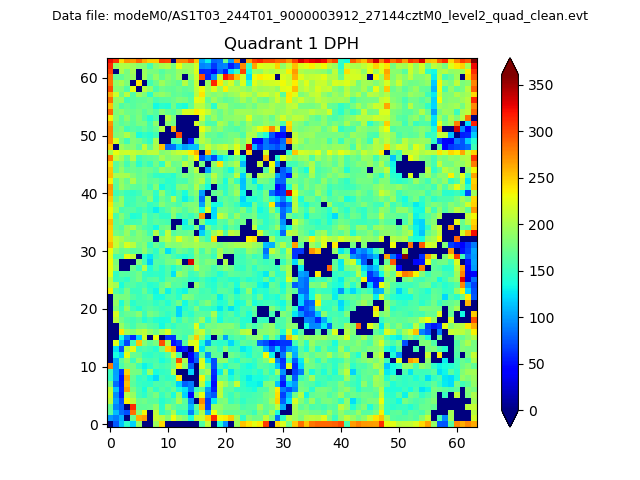 |
Quadrant B |
|---|---|---|---|
| Quadrant D | 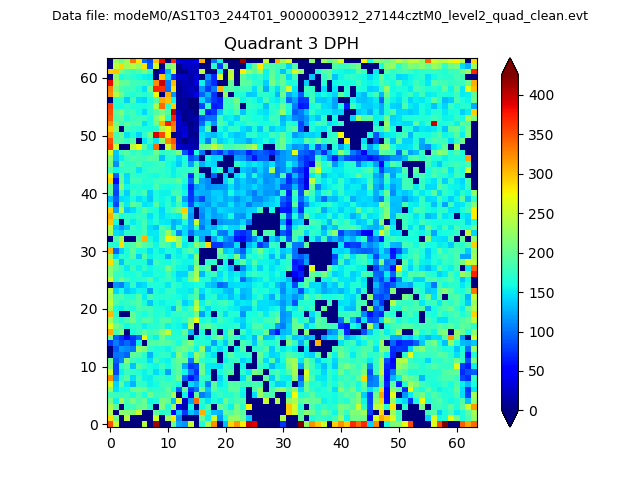 |
 |
Quadrant C |
| Plot type | Count rate plots | Images |
|---|---|---|
| Comparison with Poisson distribution Blue bars denote a histogram of data divided into 1 sec bins. Red curve is a Poisson curve with rate = median count rate of data. |
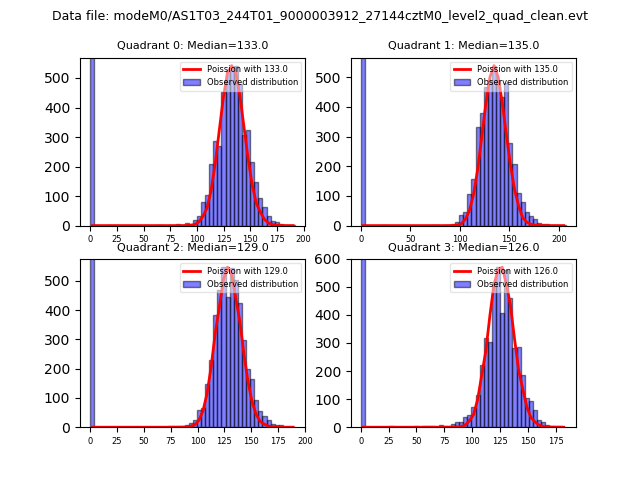 |
 |
| Quadrant-wise count rates Data is divided into 100 sec bins |
 |
|
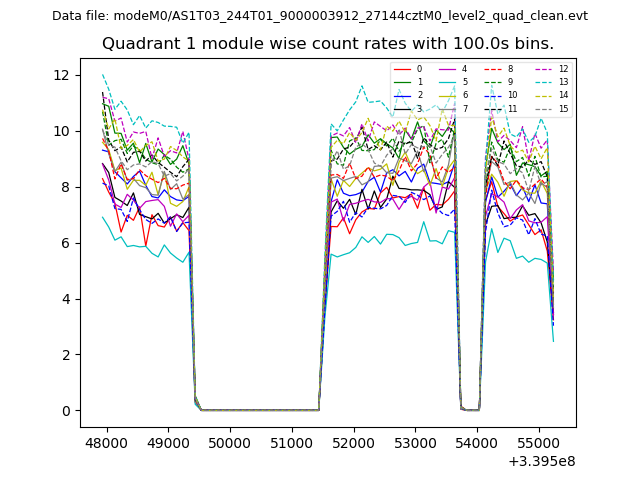
| Module-wise count rates for Quadrant A Data is divided into 100 sec bins |
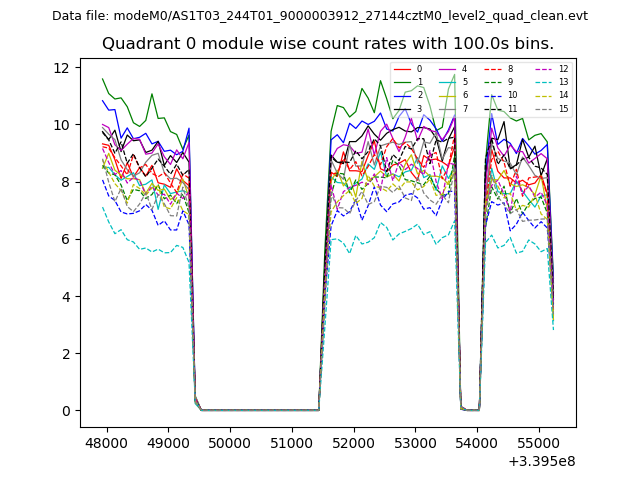 |
 |
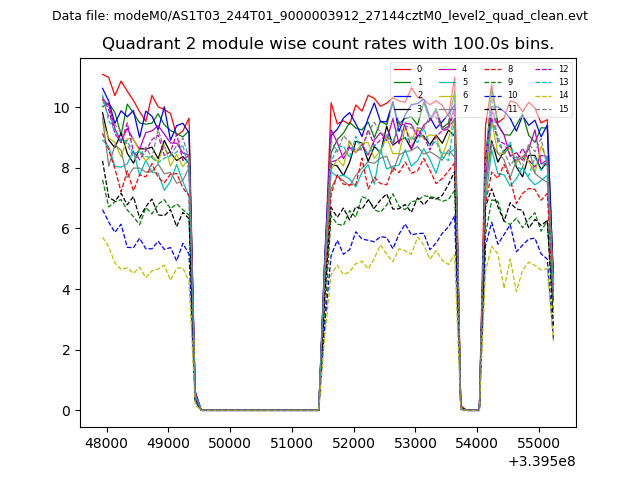
| Module-wise count rates for Quadrant B Data is divided into 100 sec bins |
 |
 |
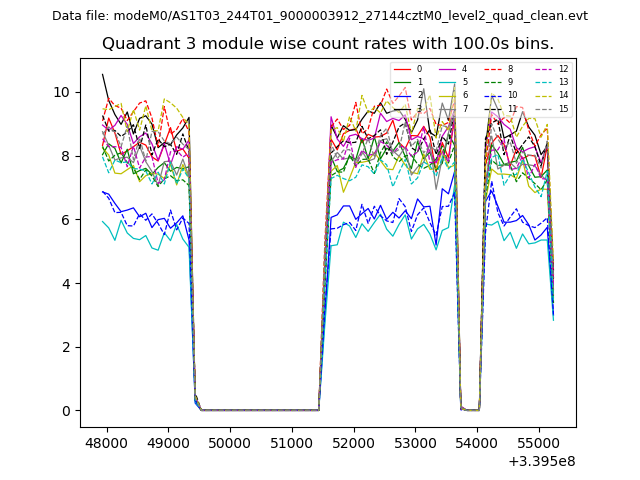
| Module-wise count rates for Quadrant C Data is divided into 100 sec bins |
 |
 |
| Module-wise count rates for Quadrant D Data is divided into 100 sec bins |
 |
 |
| Parameter | Plot |
|---|---|
| CZT HV Monitor |  |
| D_VDD | 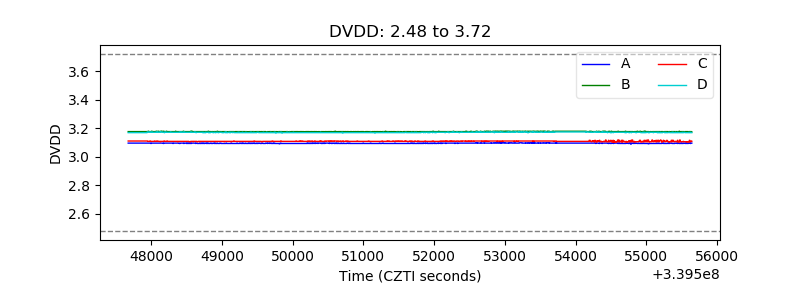 |
| Temperature 1 | 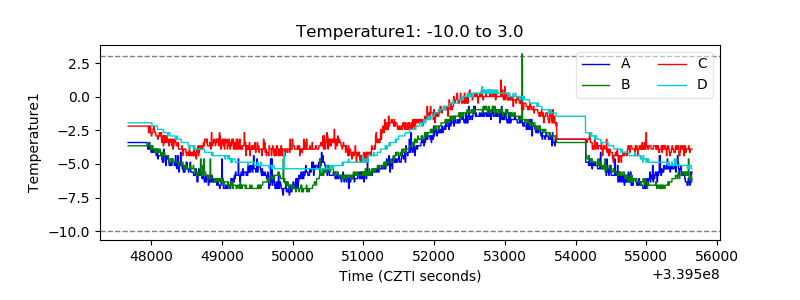 |
| Veto HV Monitor | 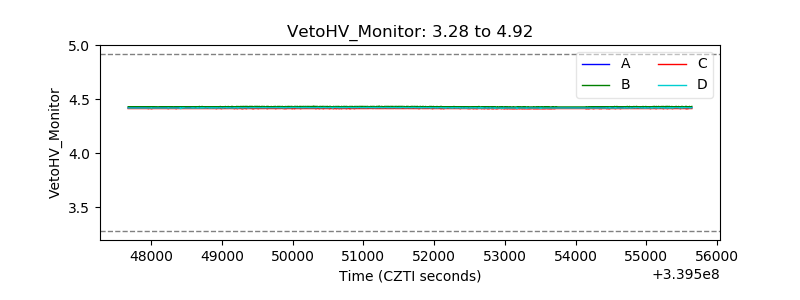 |
| Veto LLD | 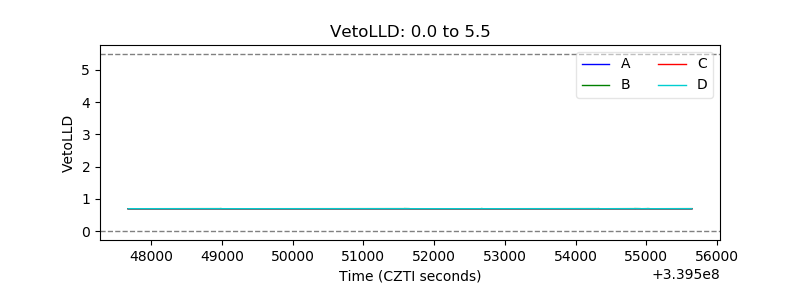 |
| Alpha Counter |  |
| _CPM_Rate |  |
| CZT Counter | 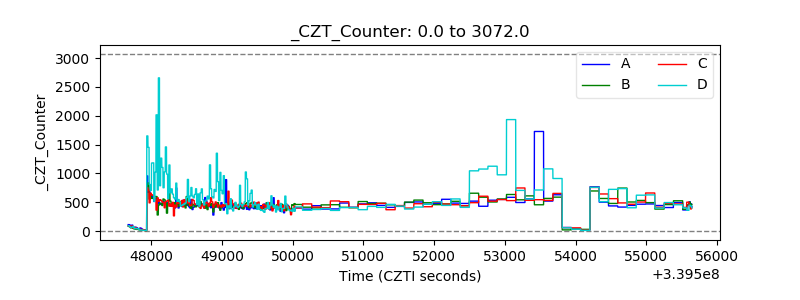 |
| +2.5 Volts monitor |  |
| +5 Volts monitor |  |
| _ROLL_ROT | 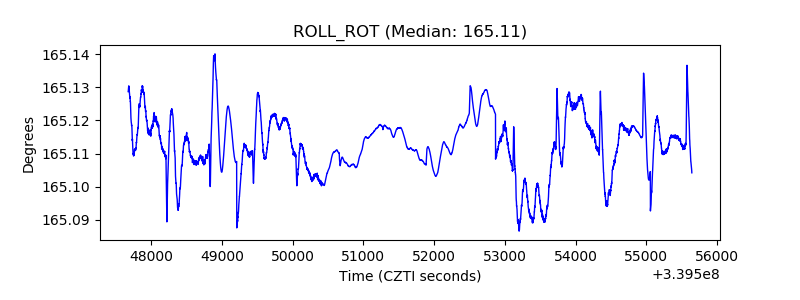 |
| _Roll_DEC | 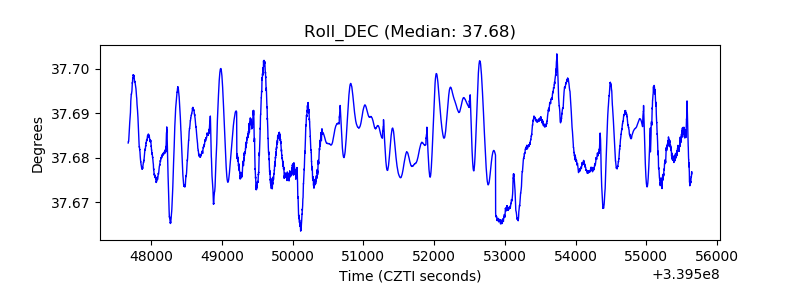 |
| _Roll_RA | 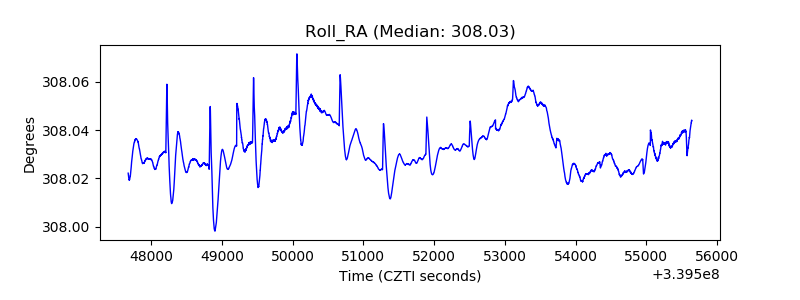 |
| Veto Counter | 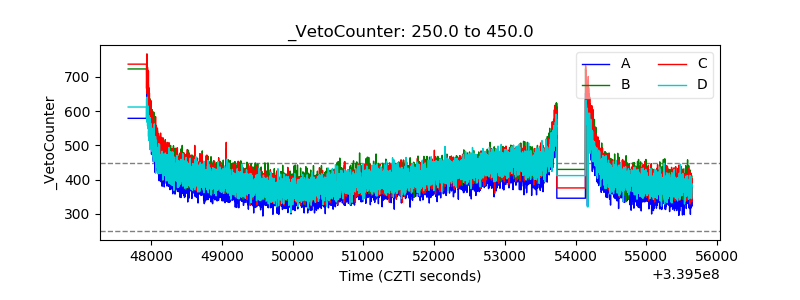 |