| Param | Original file | Final file |
|---|---|---|
| Filename | modeM0/AS1T03_244T01_9000003912_27145cztM0_level2.evt | modeM0/AS1T03_244T01_9000003912_27145cztM0_level2_quad_clean.evt |
| Size (bytes) | 213,278,400 | 31,233,600 |
| Size | 203.4 MB | 29.8 MB |
| Events in quadrant A | 1,463,676 | 181,453 |
| Events in quadrant B | 1,596,731 | 185,113 |
| Events in quadrant C | 1,522,429 | 177,910 |
| Events in quadrant D | 1,657,519 | 173,861 |
| Mode M9 | |||
|---|---|---|---|
| Quadrant | BADHDUFLAG | Total packets | Discarded packets |
| A | 0 | 5 | 0 |
| B | 0 | 5 | 0 |
| C | 0 | 5 | 0 |
| D | 0 | 5 | 0 |
| Mode M0 | |||
|---|---|---|---|
| Quadrant | BADHDUFLAG | Total packets | Discarded packets |
| A | 0 | 6617 | 0 |
| B | 0 | 6821 | 0 |
| C | 0 | 6666 | 0 |
| D | 0 | 7288 | 0 |
| Quadrant | Total seconds | Saturated seconds | Saturation percentage |
|---|---|---|---|
| A | 3195 | 20 | 0.625978% |
| B | 3196 | 41 | 1.282854% |
| C | 3196 | 34 | 1.063830% |
| D | 3196 | 37 | 1.157697% |
Noise dominated data is calculated using 1-second bins in cleaned event files. If a bin has >2000 counts, and if more than 50% of those come from <1% of pixels, then it is considered to be noise-dominated and hence unusable.
| Quadrant | # 1 sec bins | Bins with >0 counts | Bins with >2000 counts | High rate bins dominated by noise | Noise dominated (total time) | Noise dominated (detector-on time) | Marked lightcurve |
|---|---|---|---|---|---|---|---|
| A | 3615 | 3197 | 0 | 0 | 0.00% | 0.00% | 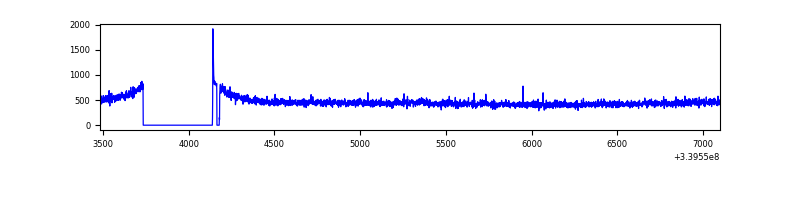 |
| B | 3616 | 3198 | 4 | 4 | 0.11% | 0.13% | 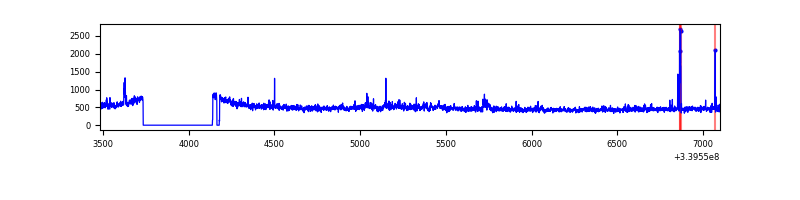 |
| C | 3616 | 3198 | 0 | 0 | 0.00% | 0.00% | 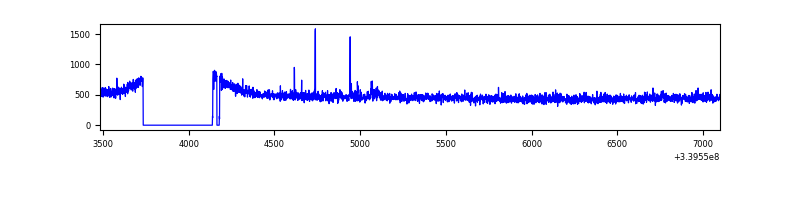 |
| D | 3616 | 3198 | 26 | 26 | 0.72% | 0.81% | 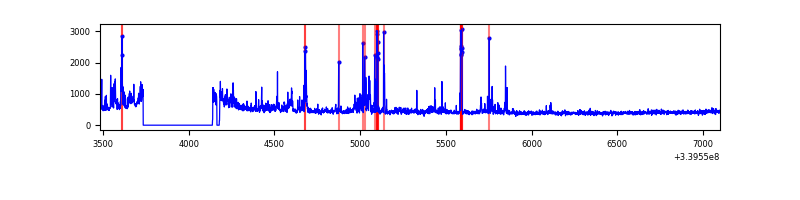 |
Top three noisy pixels from each quadrant. If the there are fewer than three noisy pixels in the level2.evt file, extra rows are filled as -1
| Pixel properties | Quadrant properties | ||||||
|---|---|---|---|---|---|---|---|
| Quadrant | DetID | PixID | Counts | Sigma | Mean | Median | Sigma |
| A | 6 | 16 | 6514 | 80.7 | 375 | 367 | 76.2 |
| A | 8 | 192 | 5806 | 71.4 | 375 | 367 | 76.2 |
| A | 13 | 254 | 5376 | 65.76 | 375 | 367 | 76.2 |
| B | 3 | 64 | 55482 | 731.68 | 379 | 367 | 75.3 |
| B | 3 | 112 | 36612 | 481.17 | 379 | 367 | 75.3 |
| B | 12 | 111 | 9153 | 116.63 | 379 | 367 | 75.3 |
| C | 14 | 238 | 57510 | 646.61 | 367 | 368 | 88.4 |
| C | 15 | 208 | 15333 | 169.34 | 367 | 368 | 88.4 |
| C | 8 | 128 | 7027 | 75.35 | 367 | 368 | 88.4 |
| D | 7 | 38 | 114172 | 1224.55 | 362 | 353 | 92.9 |
| D | 2 | 250 | 90123 | 965.81 | 362 | 353 | 92.9 |
| D | 1 | 52 | 34010 | 362.11 | 362 | 353 | 92.9 |
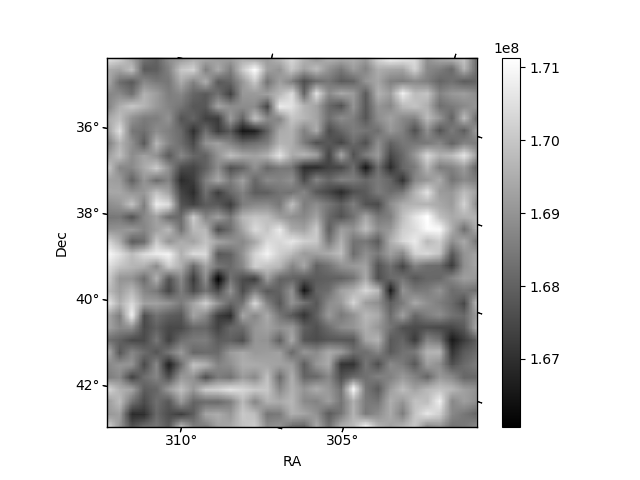
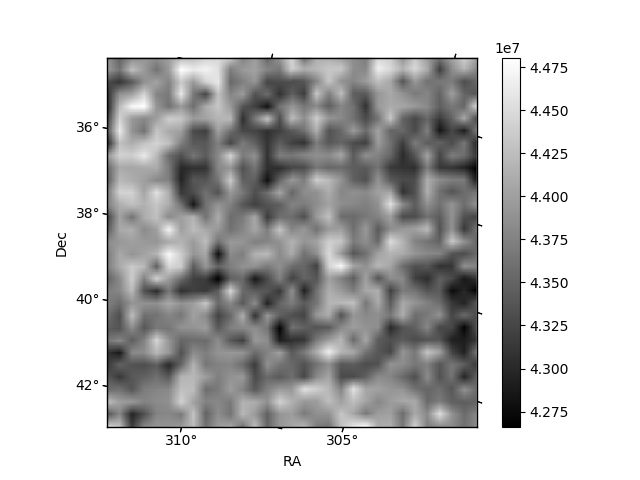
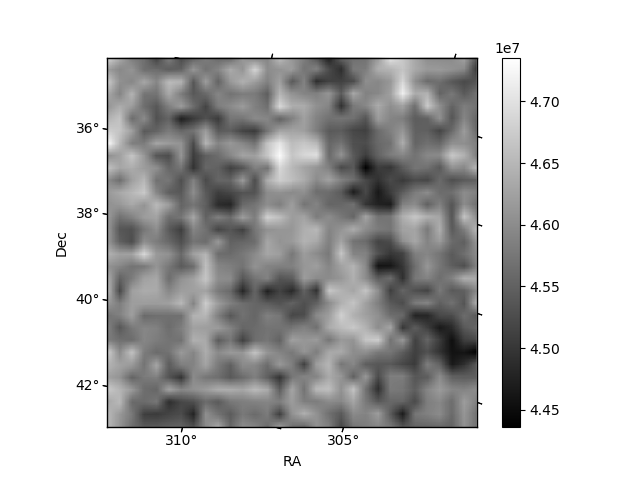
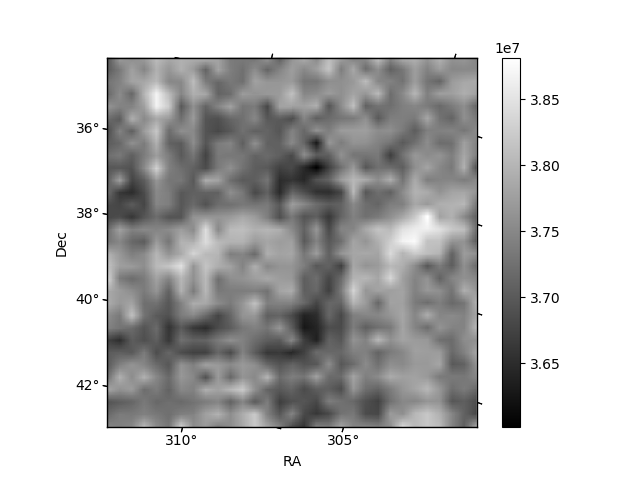
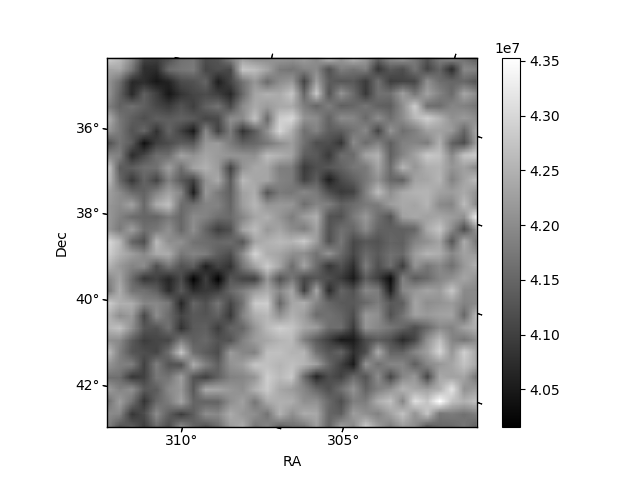
Histogram calculated using DETX and DETY for each event in the final _common_clean file
| Quadrant A | 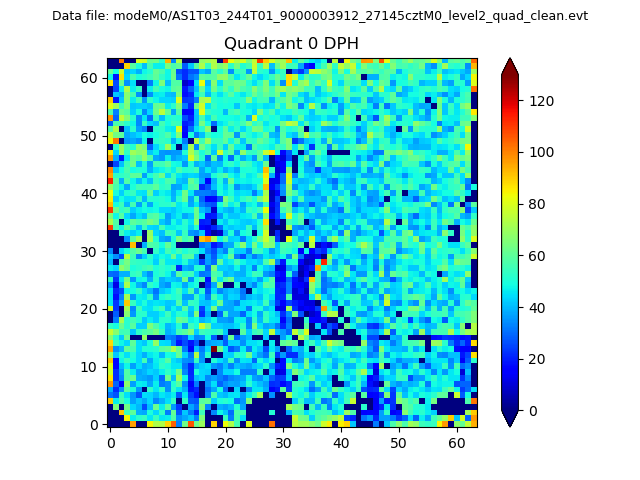 |
 |
Quadrant B |
|---|---|---|---|
| Quadrant D | 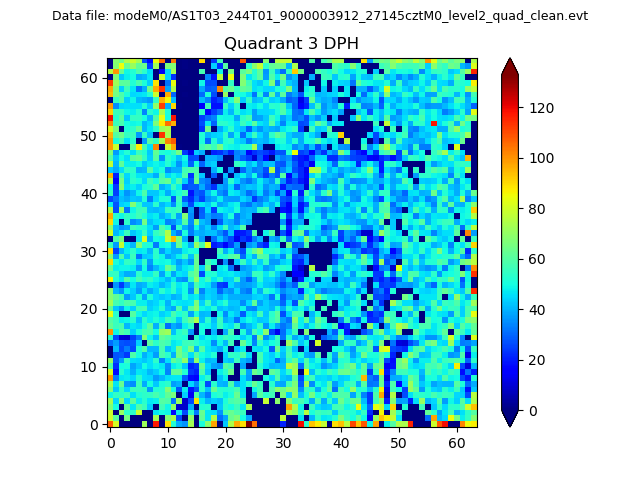 |
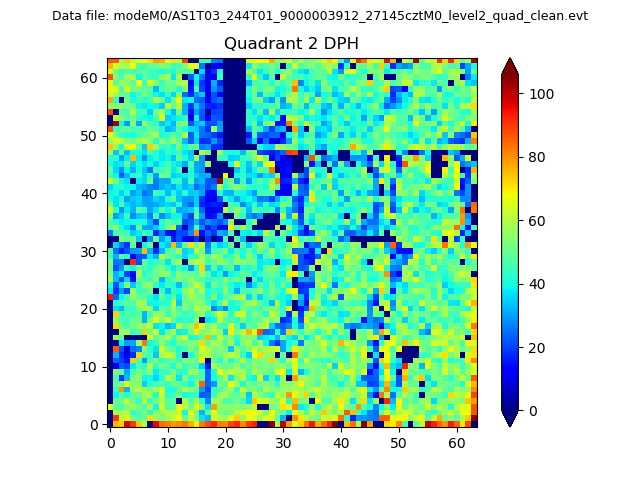 |
Quadrant C |
| Plot type | Count rate plots | Images |
|---|---|---|
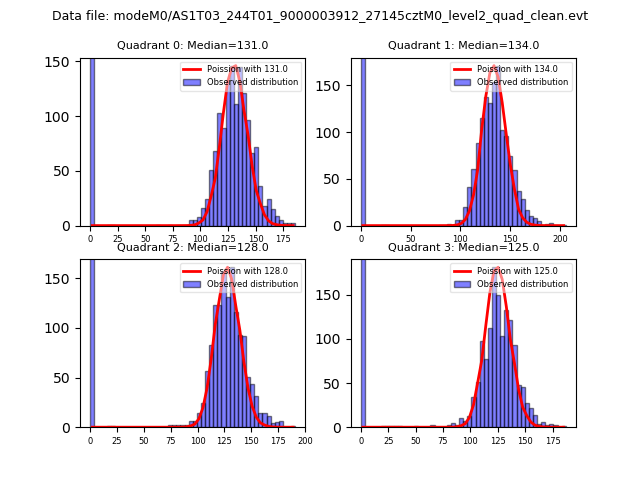
| Comparison with Poisson distribution Blue bars denote a histogram of data divided into 1 sec bins. Red curve is a Poisson curve with rate = median count rate of data. |
 |
 |
| Quadrant-wise count rates Data is divided into 100 sec bins |
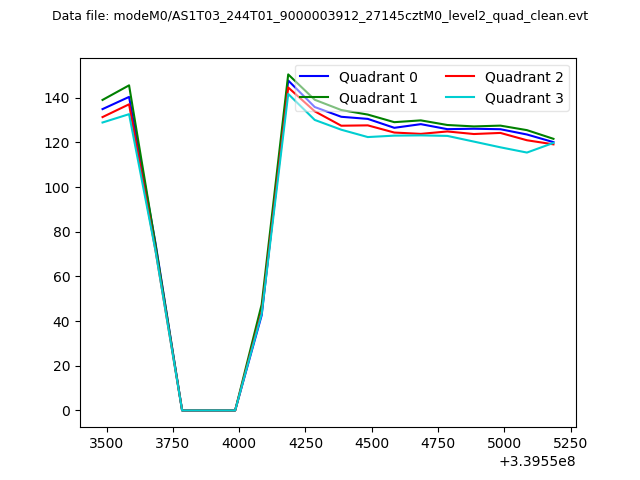 |
|
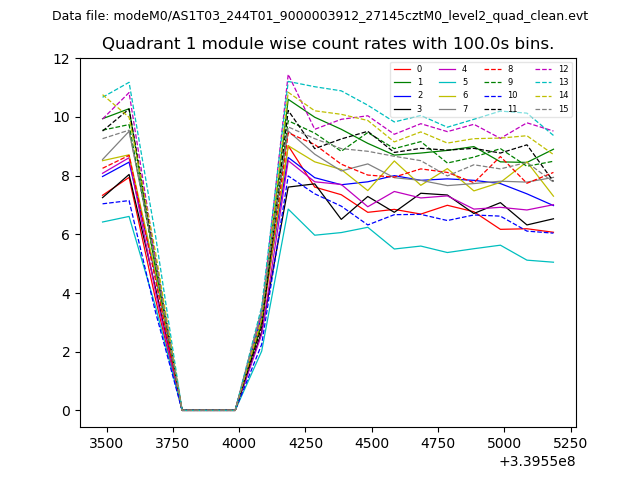
| Module-wise count rates for Quadrant A Data is divided into 100 sec bins |
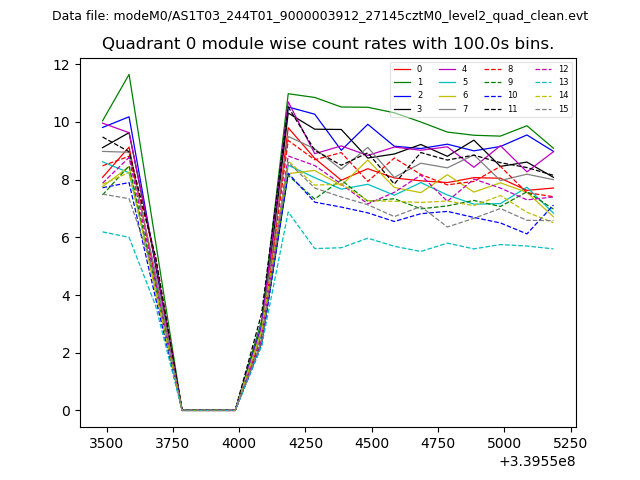 |
 |
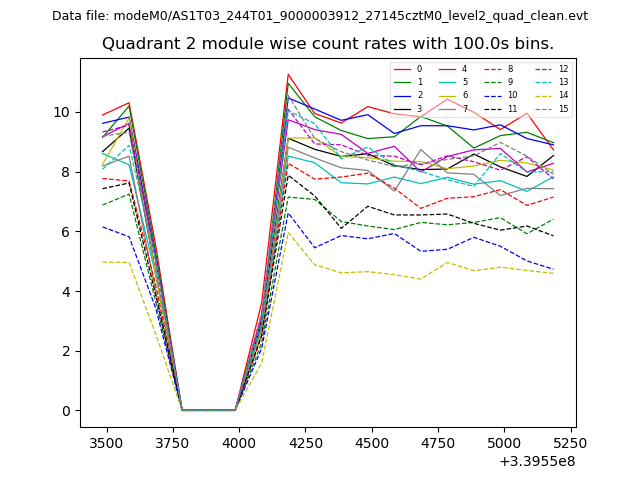
| Module-wise count rates for Quadrant B Data is divided into 100 sec bins |
 |
 |
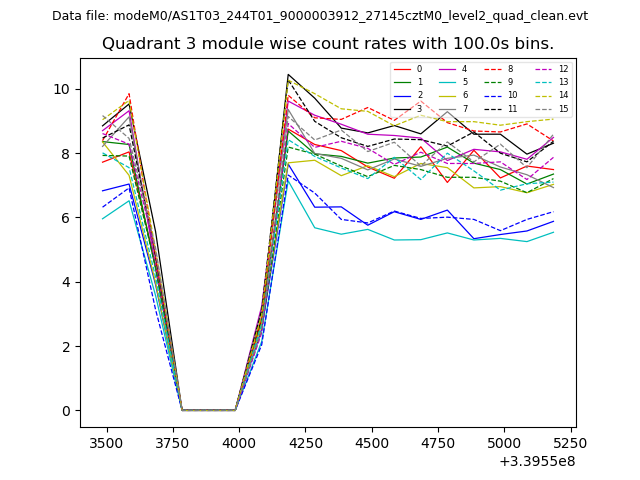
| Module-wise count rates for Quadrant C Data is divided into 100 sec bins |
 |
 |
| Module-wise count rates for Quadrant D Data is divided into 100 sec bins |
 |
 |
| Parameter | Plot |
|---|---|
| CZT HV Monitor | 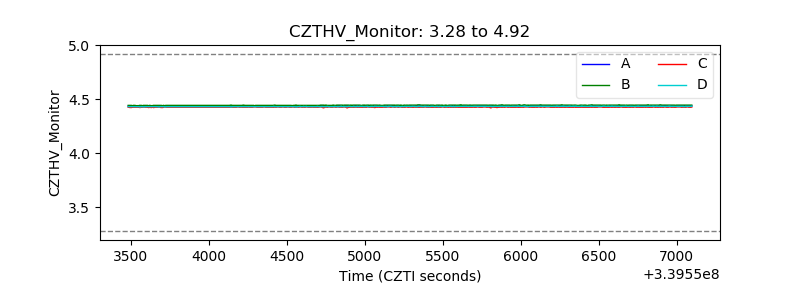 |
| D_VDD | 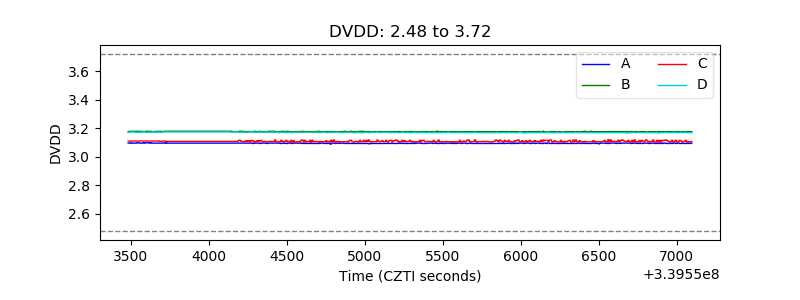 |
| Temperature 1 | 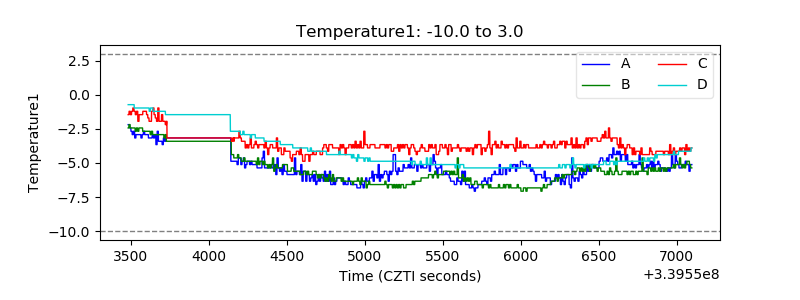 |
| Veto HV Monitor | 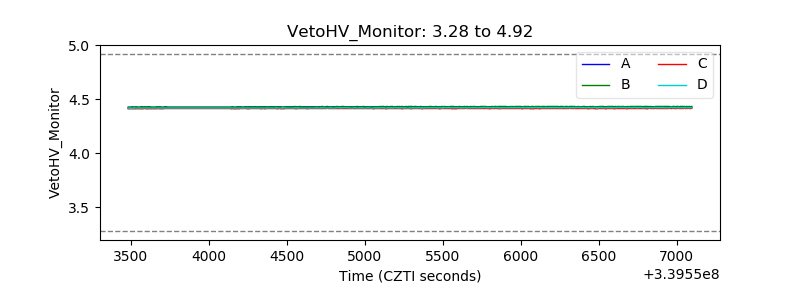 |
| Veto LLD | 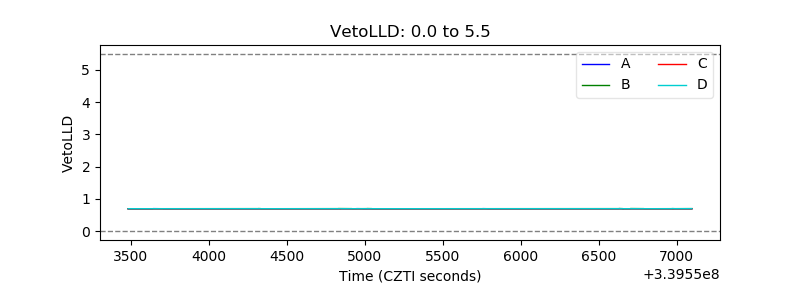 |
| Alpha Counter | 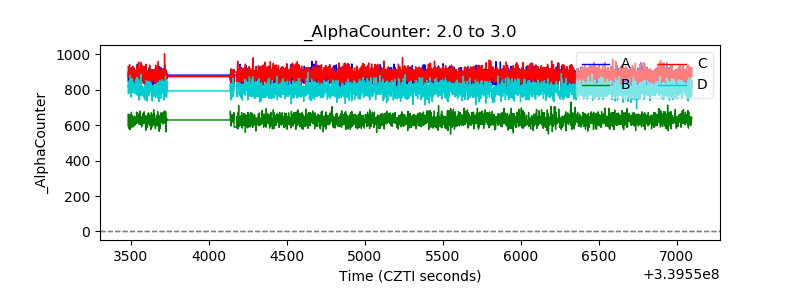 |
| _CPM_Rate | 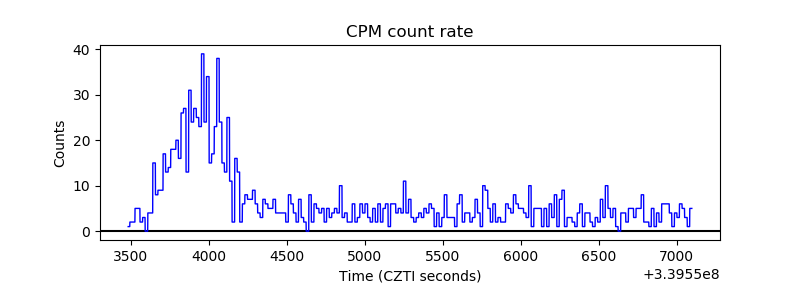 |
| CZT Counter | 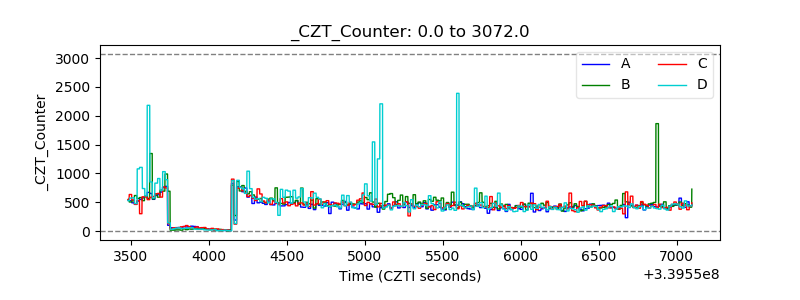 |
| +2.5 Volts monitor |  |
| +5 Volts monitor |  |
| _ROLL_ROT | 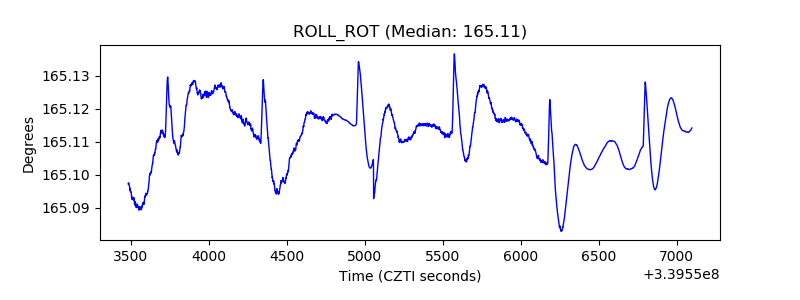 |
| _Roll_DEC | 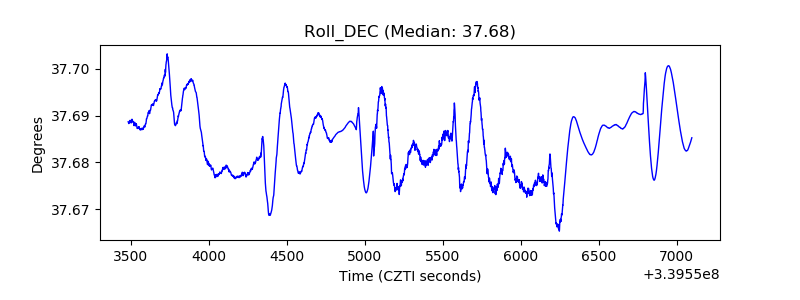 |
| _Roll_RA | 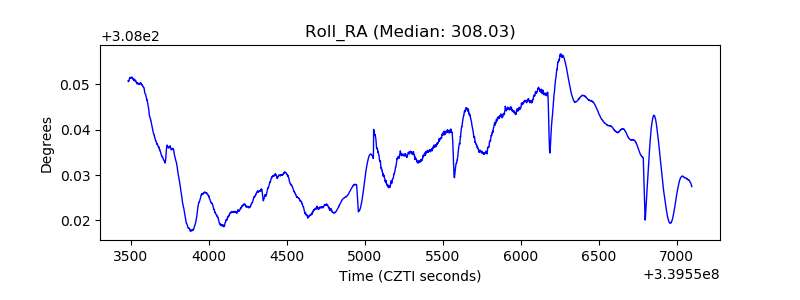 |
| Veto Counter |  |