| Param | Original file | Final file |
|---|---|---|
| Filename | modeM0/AS1T03_245T01_9000003916_27149cztM0_level2.evt | modeM0/AS1T03_245T01_9000003916_27149cztM0_level2_quad_clean.evt |
| Size (bytes) | 562,855,680 | 101,629,440 |
| Size | 536.8 MB | 96.9 MB |
| Events in quadrant A | 3,475,434 | 666,807 |
| Events in quadrant B | 3,486,952 | 677,958 |
| Events in quadrant C | 3,391,937 | 649,257 |
| Events in quadrant D | 6,227,661 | 606,205 |
| Mode M0 | |||
|---|---|---|---|
| Quadrant | BADHDUFLAG | Total packets | Discarded packets |
| A | 0 | 14599 | 0 |
| B | 0 | 14401 | 0 |
| C | 0 | 14340 | 0 |
| D | 0 | 23061 | 0 |
| Mode M9 | |||
|---|---|---|---|
| Quadrant | BADHDUFLAG | Total packets | Discarded packets |
| A | 0 | 14 | 0 |
| B | 0 | 14 | 0 |
| C | 0 | 14 | 0 |
| D | 0 | 14 | 0 |
| Quadrant | Total seconds | Saturated seconds | Saturation percentage |
|---|---|---|---|
| A | 6855 | 63 | 0.919037% |
| B | 6854 | 54 | 0.787861% |
| C | 6854 | 111 | 1.619492% |
| D | 6854 | 618 | 9.016633% |
Noise dominated data is calculated using 1-second bins in cleaned event files. If a bin has >2000 counts, and if more than 50% of those come from <1% of pixels, then it is considered to be noise-dominated and hence unusable.
| Quadrant | # 1 sec bins | Bins with >0 counts | Bins with >2000 counts | High rate bins dominated by noise | Noise dominated (total time) | Noise dominated (detector-on time) | Marked lightcurve |
|---|---|---|---|---|---|---|---|
| A | 7730 | 6856 | 8 | 8 | 0.10% | 0.12% | 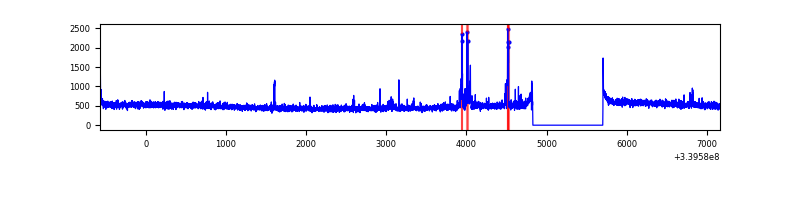 |
| B | 7729 | 6855 | 1 | 1 | 0.01% | 0.01% | 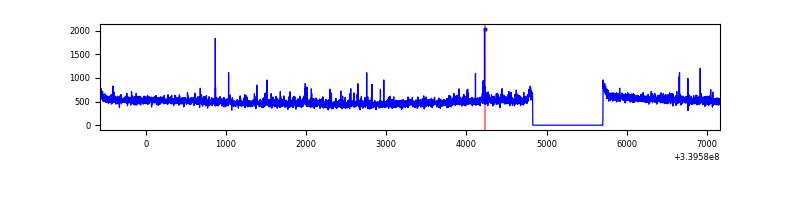 |
| C | 7729 | 6855 | 2 | 2 | 0.03% | 0.03% | 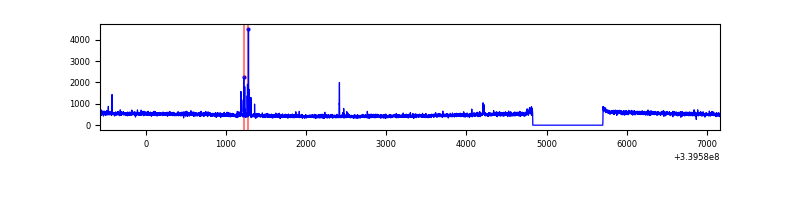 |
| D | 7729 | 6855 | 496 | 496 | 6.42% | 7.24% | 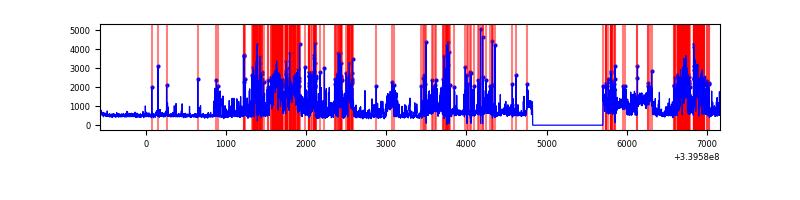 |
Top three noisy pixels from each quadrant. If the there are fewer than three noisy pixels in the level2.evt file, extra rows are filled as -1
| Pixel properties | Quadrant properties | ||||||
|---|---|---|---|---|---|---|---|
| Quadrant | DetID | PixID | Counts | Sigma | Mean | Median | Sigma |
| A | 14 | 235 | 117840 | 674.59 | 861 | 843 | 173.4 |
| A | 0 | 13 | 11978 | 64.2 | 861 | 843 | 173.4 |
| A | 8 | 192 | 11263 | 60.08 | 861 | 843 | 173.4 |
| B | 3 | 112 | 92318 | 556.58 | 853 | 830 | 164.4 |
| B | 0 | 190 | 35137 | 208.71 | 853 | 830 | 164.4 |
| B | 12 | 111 | 20338 | 118.68 | 853 | 830 | 164.4 |
| C | 14 | 238 | 131772 | 673.43 | 823 | 828 | 194.4 |
| C | 15 | 208 | 51021 | 258.14 | 823 | 828 | 194.4 |
| C | 2 | 16 | 6752 | 30.47 | 823 | 828 | 194.4 |
| D | 1 | 52 | 2733634 | 13472.63 | 806 | 787 | 202.8 |
| D | 7 | 38 | 217931 | 1070.5 | 806 | 787 | 202.8 |
| D | 12 | 233 | 96686 | 472.77 | 806 | 787 | 202.8 |
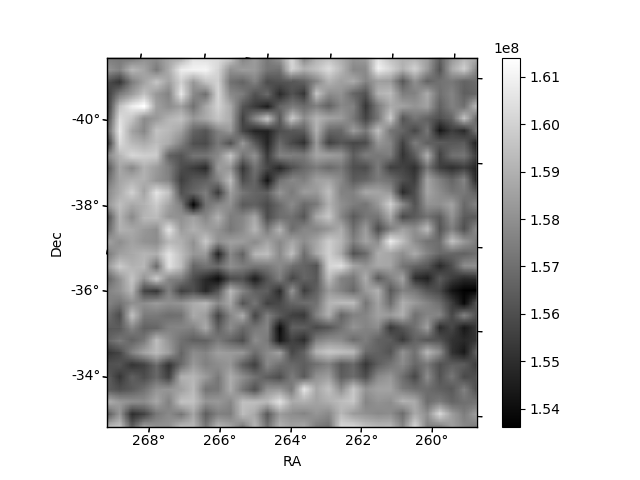
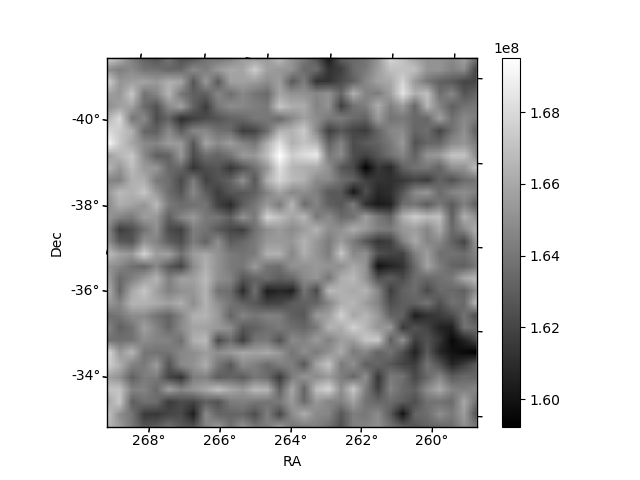
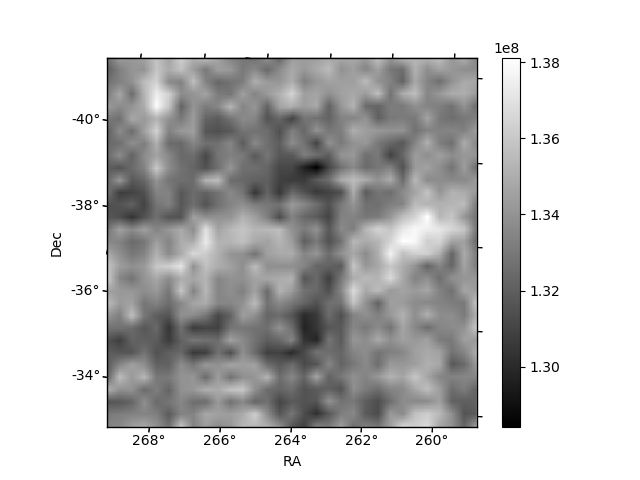
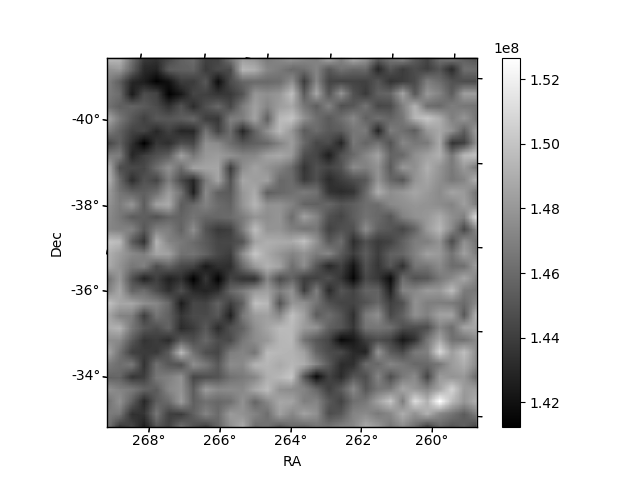
Histogram calculated using DETX and DETY for each event in the final _common_clean file
| Quadrant A |  |
 |
Quadrant B |
|---|---|---|---|
| Quadrant D |  |
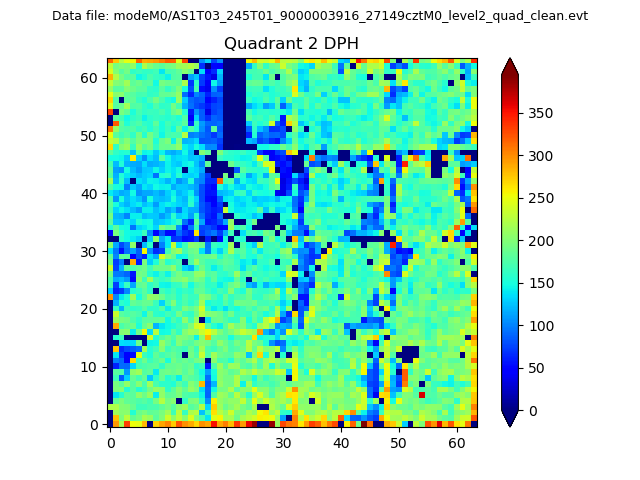 |
Quadrant C |
| Plot type | Count rate plots | Images |
|---|---|---|
| Comparison with Poisson distribution Blue bars denote a histogram of data divided into 1 sec bins. Red curve is a Poisson curve with rate = median count rate of data. |
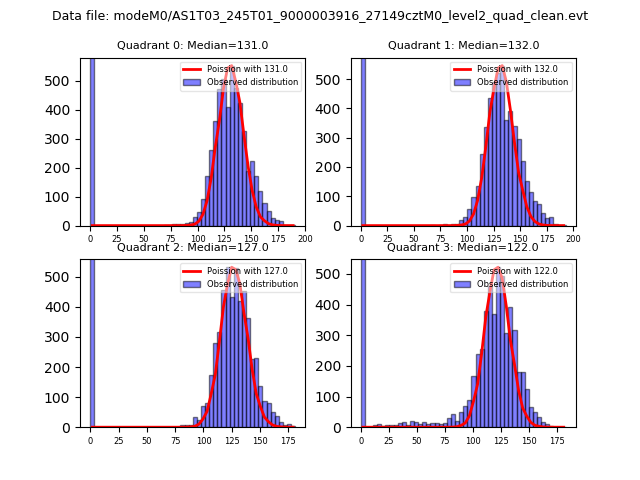 |
 |
| Quadrant-wise count rates Data is divided into 100 sec bins |
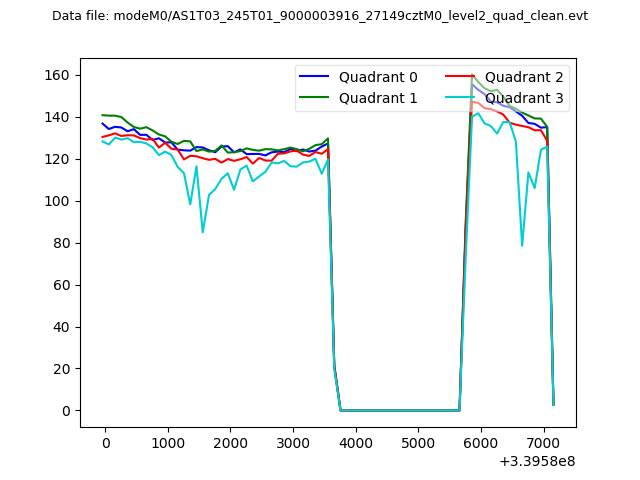 |
|
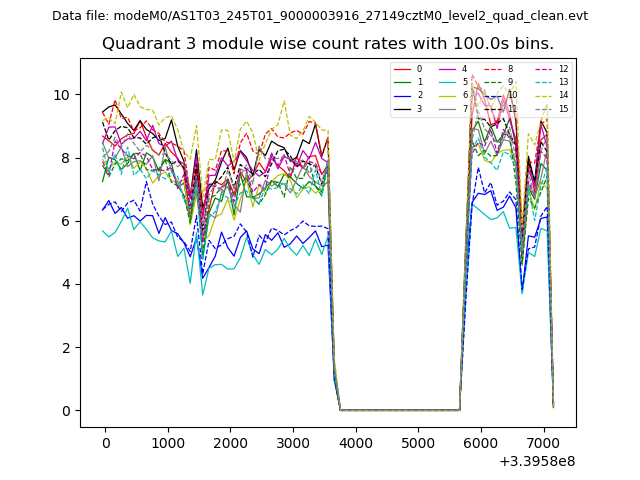
| Module-wise count rates for Quadrant A Data is divided into 100 sec bins |
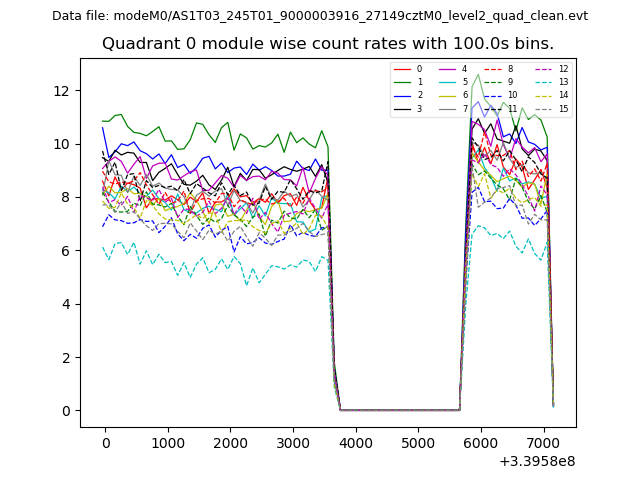 |
 |
| Module-wise count rates for Quadrant B Data is divided into 100 sec bins |
 |
 |
| Module-wise count rates for Quadrant C Data is divided into 100 sec bins |
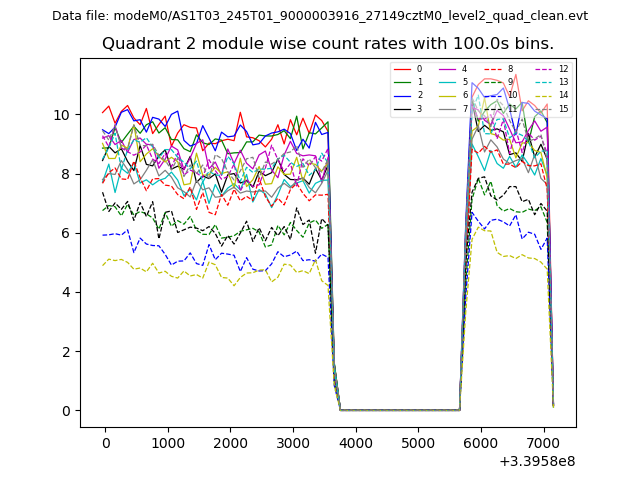 |
 |
| Module-wise count rates for Quadrant D Data is divided into 100 sec bins |
 |
 |
| Parameter | Plot |
|---|---|
| CZT HV Monitor |  |
| D_VDD | 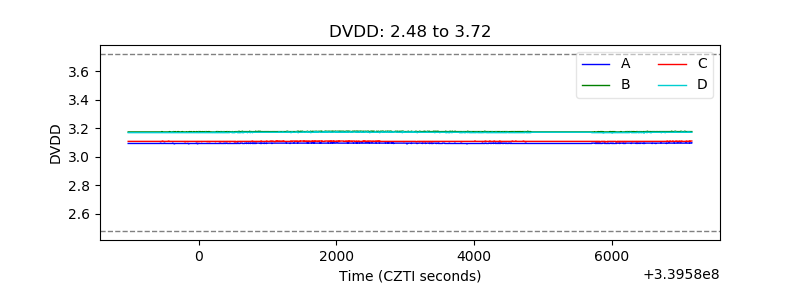 |
| Temperature 1 | 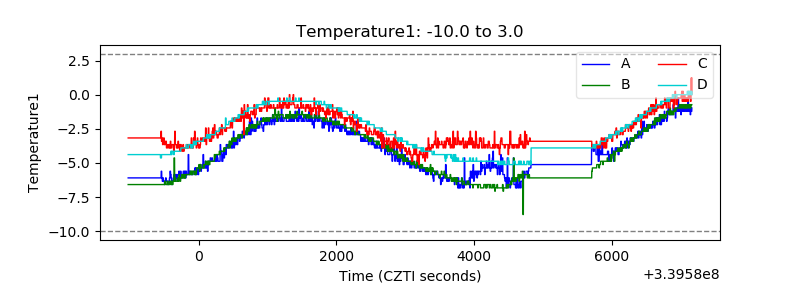 |
| Veto HV Monitor | 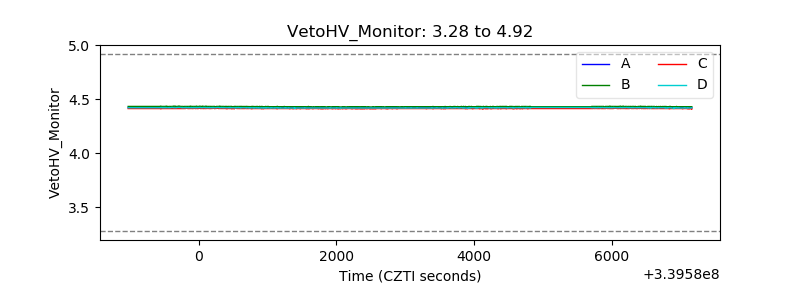 |
| Veto LLD | 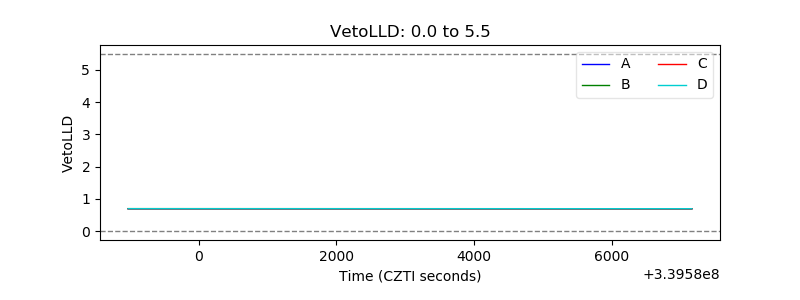 |
| Alpha Counter | 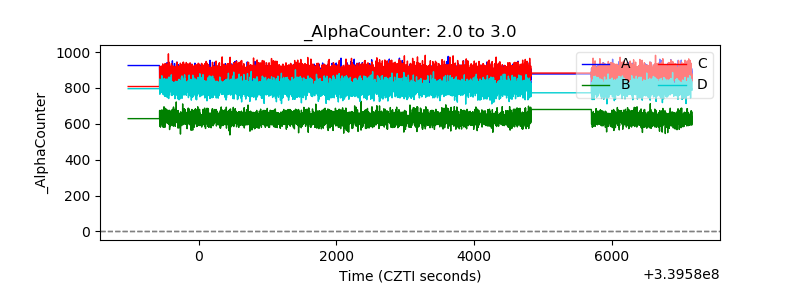 |
| _CPM_Rate | 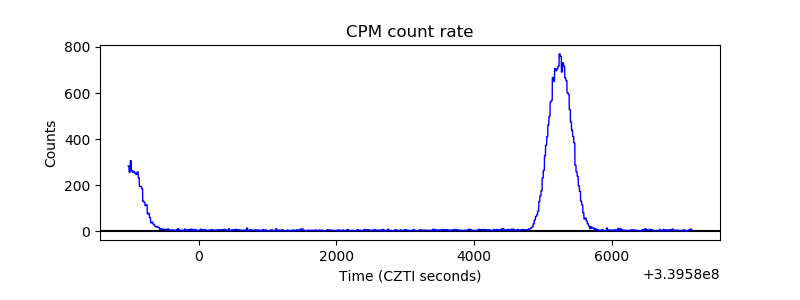 |
| CZT Counter | 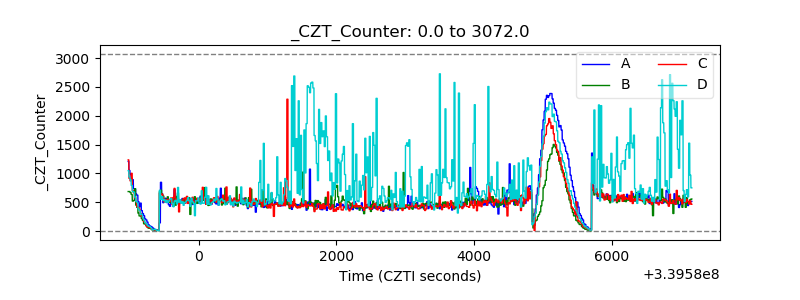 |
| +2.5 Volts monitor |  |
| +5 Volts monitor | 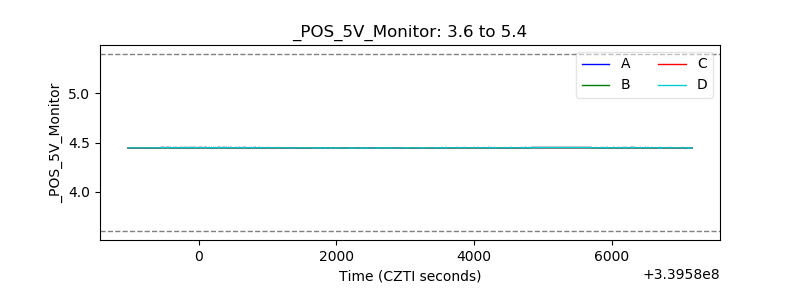 |
| _ROLL_ROT | 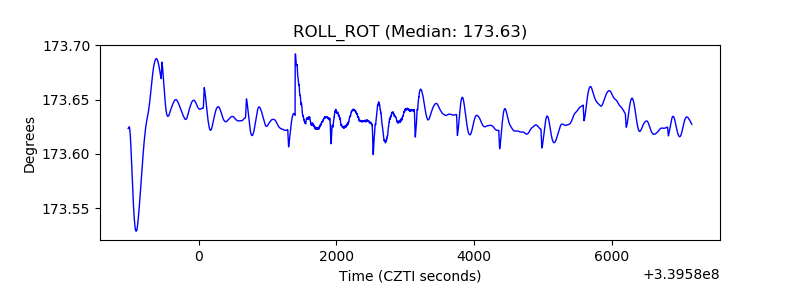 |
| _Roll_DEC | 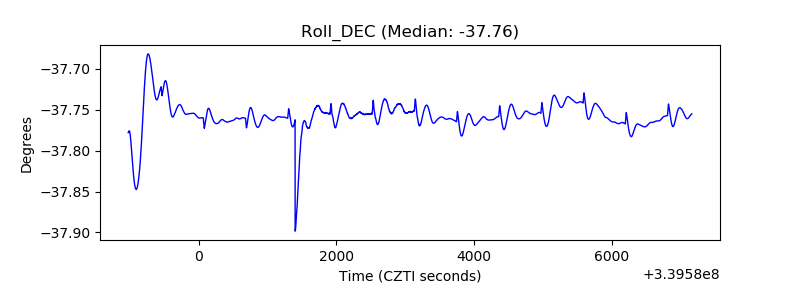 |
| _Roll_RA | 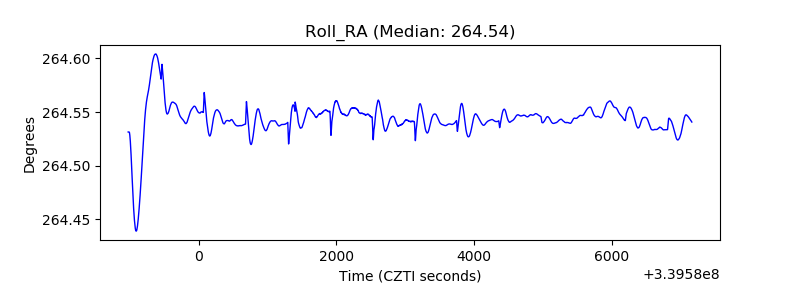 |
| Veto Counter | 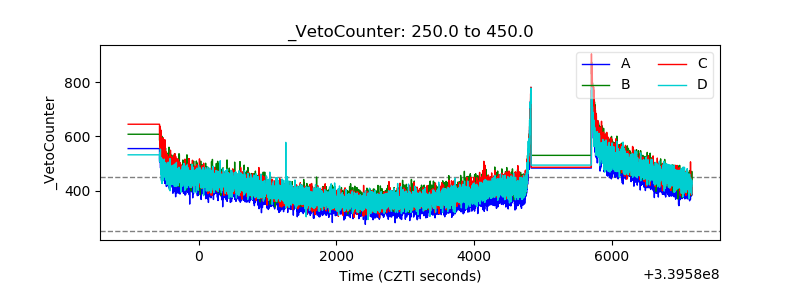 |