| Param | Original file | Final file |
|---|---|---|
| Filename | modeM0/AS1T03_245T01_9000003916_27150cztM0_level2.evt | modeM0/AS1T03_245T01_9000003916_27150cztM0_level2_quad_clean.evt |
| Size (bytes) | 505,618,560 | 100,238,400 |
| Size | 482.2 MB | 95.6 MB |
| Events in quadrant A | 3,158,079 | 669,934 |
| Events in quadrant B | 3,415,235 | 675,194 |
| Events in quadrant C | 3,072,227 | 644,090 |
| Events in quadrant D | 5,241,730 | 608,590 |
| Mode M0 | |||
|---|---|---|---|
| Quadrant | BADHDUFLAG | Total packets | Discarded packets |
| A | 0 | 13452 | 0 |
| B | 0 | 14117 | 0 |
| C | 0 | 13212 | 0 |
| D | 0 | 19796 | 0 |
| Mode M9 | |||
|---|---|---|---|
| Quadrant | BADHDUFLAG | Total packets | Discarded packets |
| A | 0 | 10 | 0 |
| B | 0 | 10 | 0 |
| C | 0 | 10 | 0 |
| D | 0 | 10 | 0 |
| Quadrant | Total seconds | Saturated seconds | Saturation percentage |
|---|---|---|---|
| A | 6269 | 70 | 1.116606% |
| B | 6269 | 77 | 1.228266% |
| C | 6270 | 103 | 1.642743% |
| D | 6270 | 473 | 7.543860% |
Noise dominated data is calculated using 1-second bins in cleaned event files. If a bin has >2000 counts, and if more than 50% of those come from <1% of pixels, then it is considered to be noise-dominated and hence unusable.
| Quadrant | # 1 sec bins | Bins with >0 counts | Bins with >2000 counts | High rate bins dominated by noise | Noise dominated (total time) | Noise dominated (detector-on time) | Marked lightcurve |
|---|---|---|---|---|---|---|---|
| A | 7289 | 6270 | 2 | 2 | 0.03% | 0.03% | 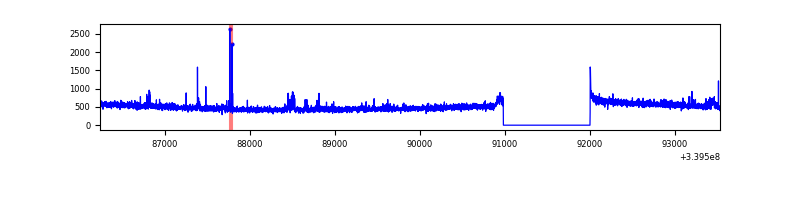 |
| B | 7289 | 6270 | 8 | 8 | 0.11% | 0.13% | 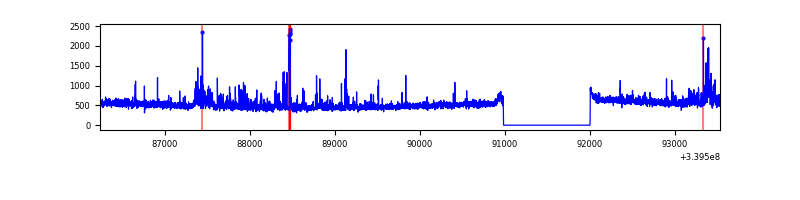 |
| C | 7290 | 6271 | 0 | 0 | 0.00% | 0.00% | 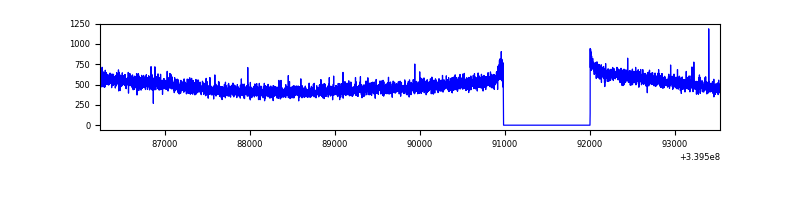 |
| D | 7290 | 6271 | 380 | 380 | 5.21% | 6.06% | 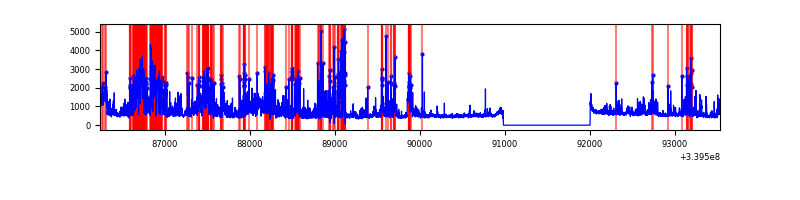 |
Top three noisy pixels from each quadrant. If the there are fewer than three noisy pixels in the level2.evt file, extra rows are filled as -1
| Pixel properties | Quadrant properties | ||||||
|---|---|---|---|---|---|---|---|
| Quadrant | DetID | PixID | Counts | Sigma | Mean | Median | Sigma |
| A | 0 | 13 | 27996 | 169.94 | 798 | 782 | 160.1 |
| A | 7 | 192 | 21404 | 128.78 | 798 | 782 | 160.1 |
| A | 13 | 248 | 18995 | 113.74 | 798 | 782 | 160.1 |
| B | 15 | 33 | 161179 | 1063.15 | 788 | 769 | 150.9 |
| B | 3 | 112 | 78892 | 517.77 | 788 | 769 | 150.9 |
| B | 0 | 229 | 30018 | 193.85 | 788 | 769 | 150.9 |
| C | 14 | 238 | 120915 | 676.38 | 753 | 759 | 177.6 |
| C | 2 | 16 | 7757 | 39.39 | 753 | 759 | 177.6 |
| C | 15 | 208 | 6284 | 31.1 | 753 | 759 | 177.6 |
| D | 1 | 52 | 1884589 | 9591.58 | 745 | 731 | 196.4 |
| D | 7 | 38 | 270388 | 1372.95 | 745 | 731 | 196.4 |
| D | 2 | 250 | 119017 | 602.25 | 745 | 731 | 196.4 |
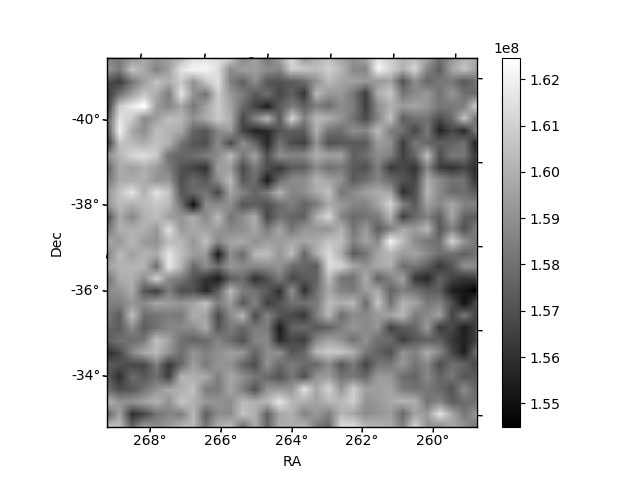
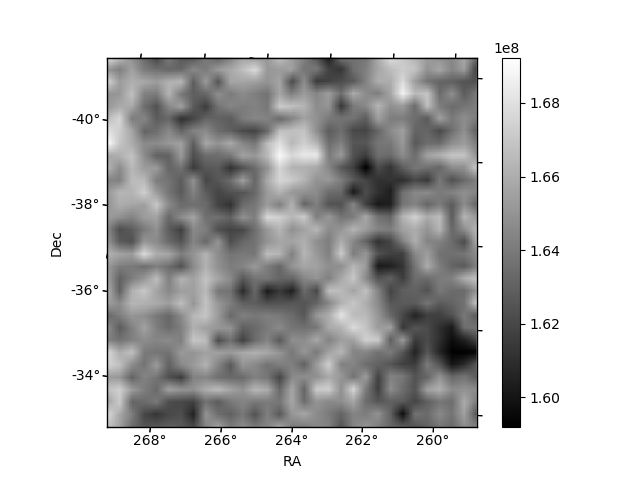
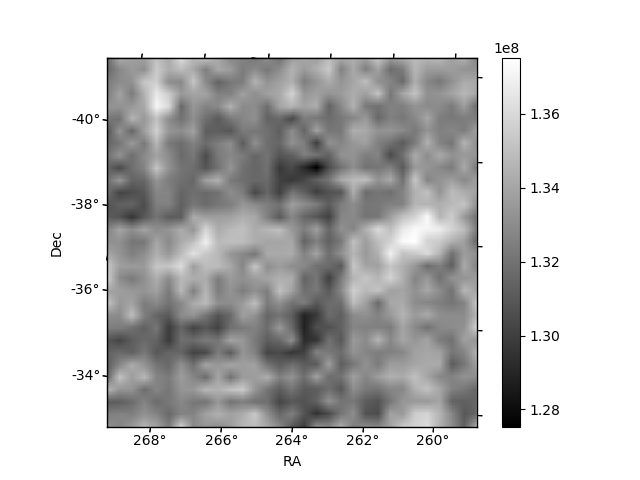
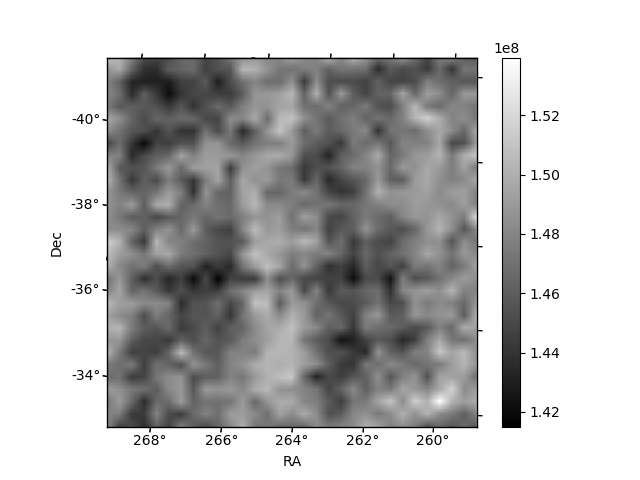
Histogram calculated using DETX and DETY for each event in the final _common_clean file
| Quadrant A | 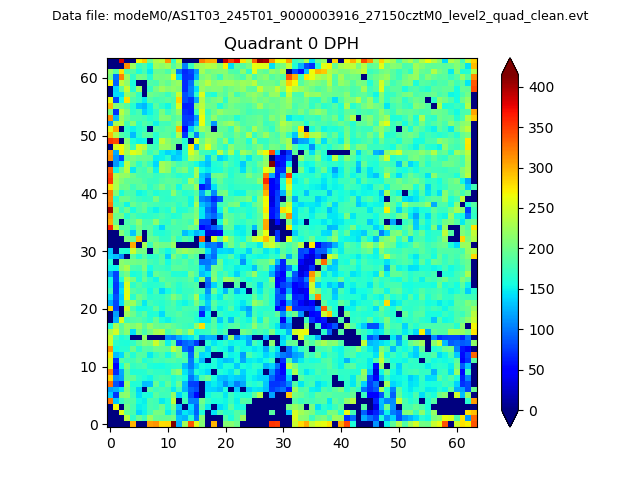 |
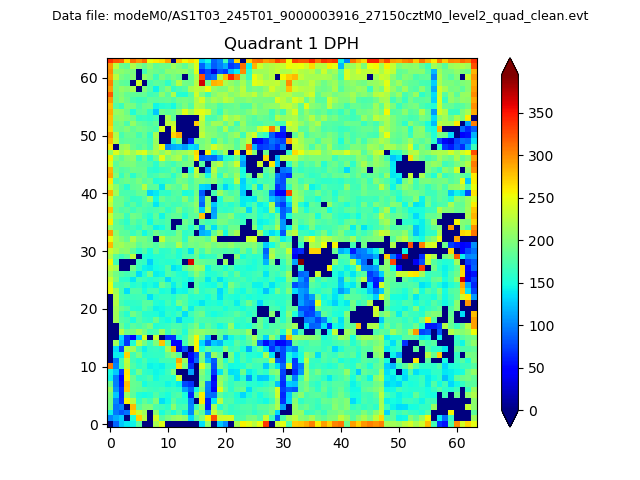 |
Quadrant B |
|---|---|---|---|
| Quadrant D |  |
 |
Quadrant C |
| Plot type | Count rate plots | Images |
|---|---|---|
| Comparison with Poisson distribution Blue bars denote a histogram of data divided into 1 sec bins. Red curve is a Poisson curve with rate = median count rate of data. |
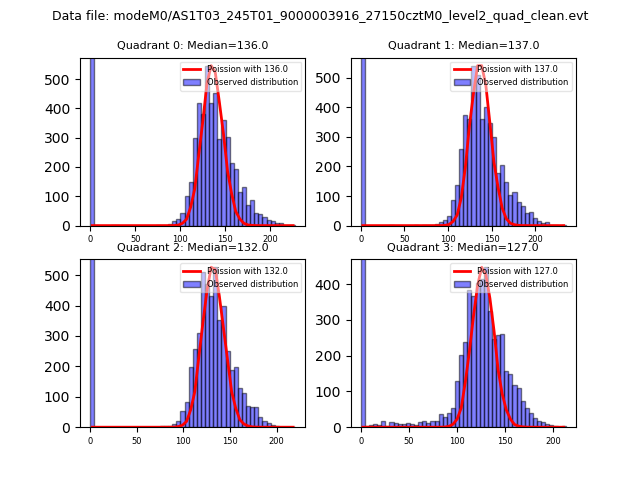 |
 |
| Quadrant-wise count rates Data is divided into 100 sec bins |
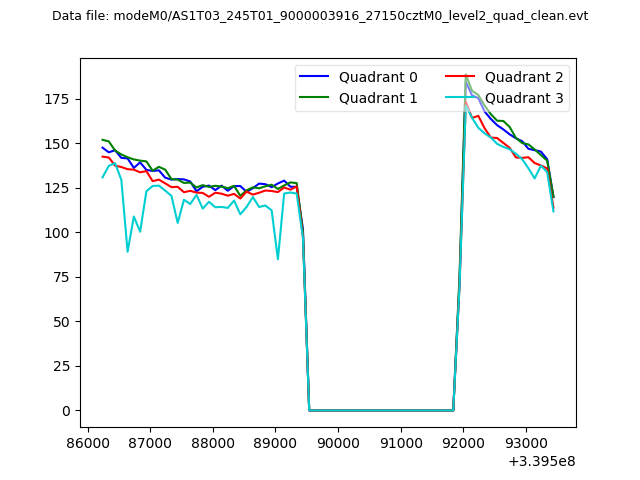 |
|
| Module-wise count rates for Quadrant A Data is divided into 100 sec bins |
 |
 |
| Module-wise count rates for Quadrant B Data is divided into 100 sec bins |
 |
 |
| Module-wise count rates for Quadrant C Data is divided into 100 sec bins |
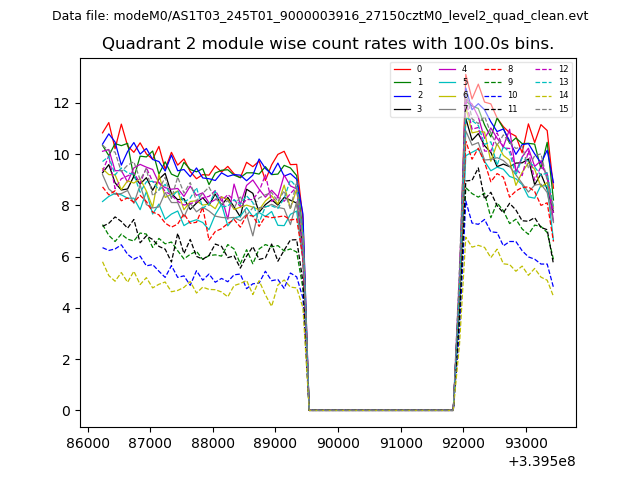 |
 |
| Module-wise count rates for Quadrant D Data is divided into 100 sec bins |
 |
 |
| Parameter | Plot |
|---|---|
| CZT HV Monitor | 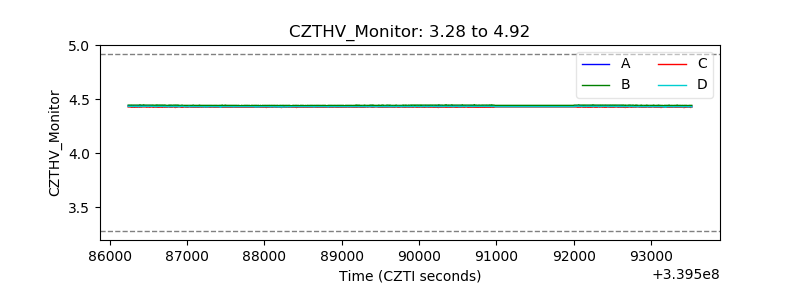 |
| D_VDD | 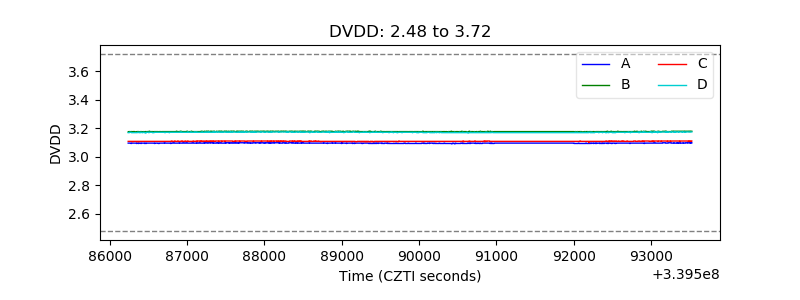 |
| Temperature 1 | 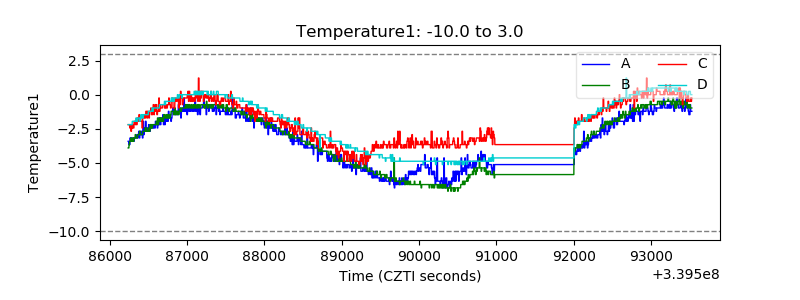 |
| Veto HV Monitor | 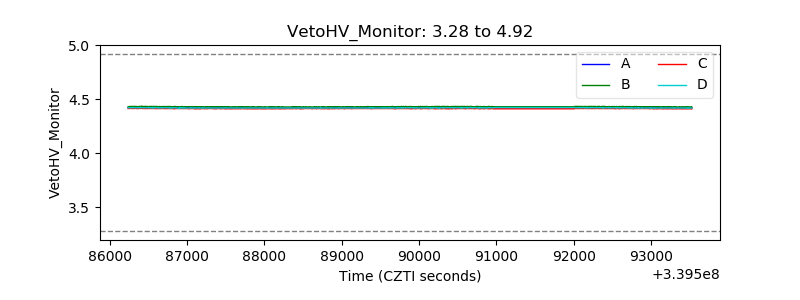 |
| Veto LLD | 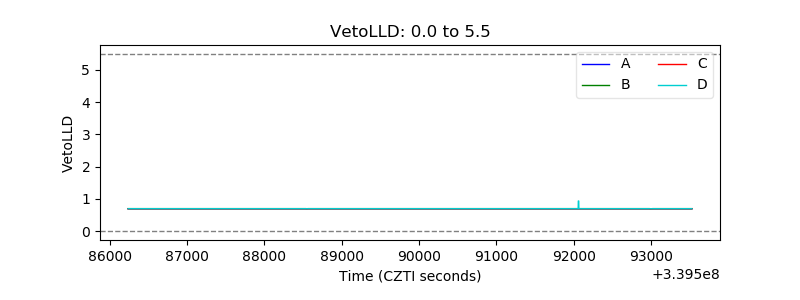 |
| Alpha Counter | 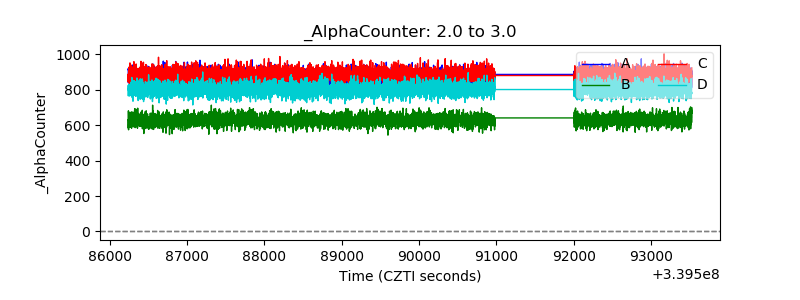 |
| _CPM_Rate | 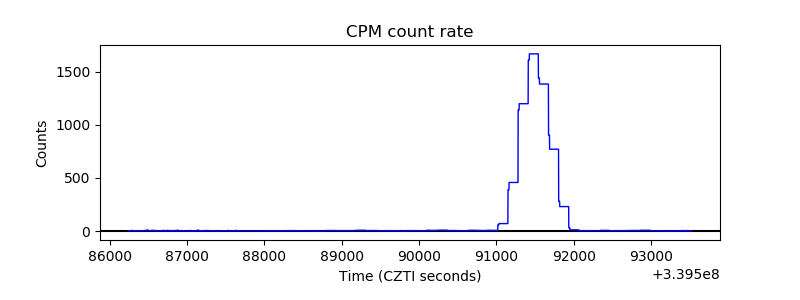 |
| CZT Counter | 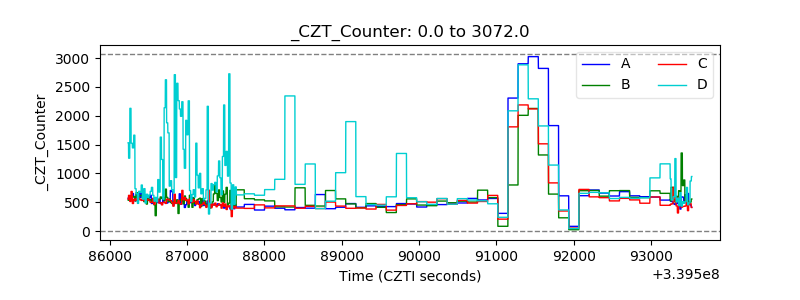 |
| +2.5 Volts monitor | 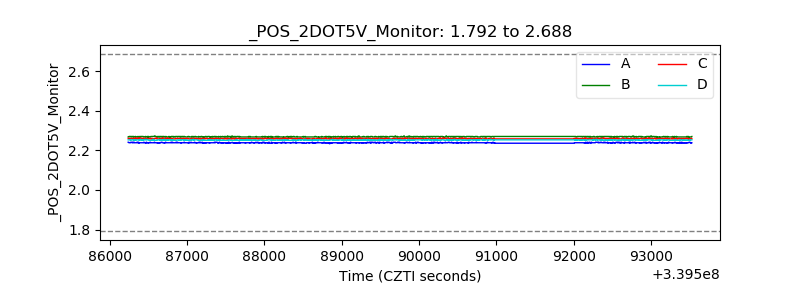 |
| +5 Volts monitor |  |
| _ROLL_ROT |  |
| _Roll_DEC | 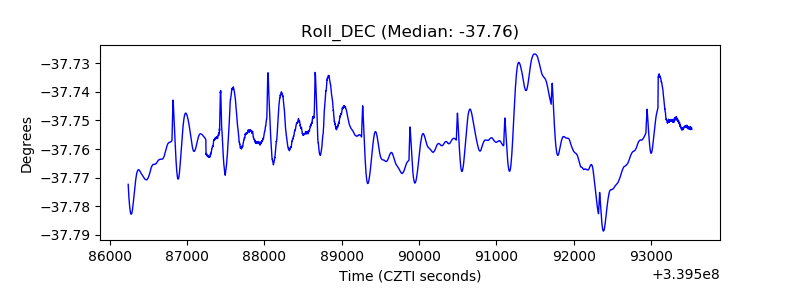 |
| _Roll_RA | 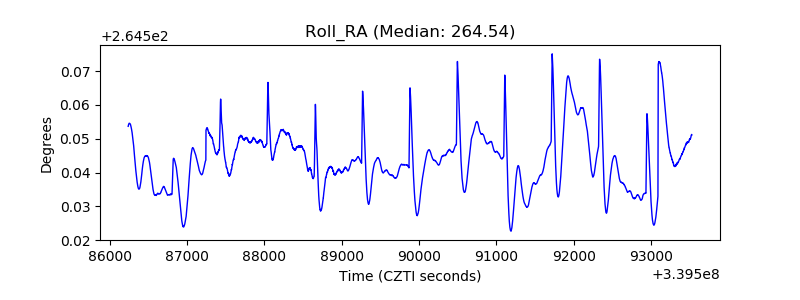 |
| Veto Counter |  |