| Param | Original file | Final file |
|---|---|---|
| Filename | modeM0/AS1T03_245T01_9000003916_27152cztM0_level2.evt | modeM0/AS1T03_245T01_9000003916_27152cztM0_level2_quad_clean.evt |
| Size (bytes) | 189,622,080 | 31,654,080 |
| Size | 180.8 MB | 30.2 MB |
| Events in quadrant A | 1,171,743 | 206,295 |
| Events in quadrant B | 1,294,003 | 204,865 |
| Events in quadrant C | 1,129,653 | 194,177 |
| Events in quadrant D | 1,988,095 | 186,077 |
| Mode M0 | |||
|---|---|---|---|
| Quadrant | BADHDUFLAG | Total packets | Discarded packets |
| A | 0 | 4966 | 0 |
| B | 0 | 5297 | 0 |
| C | 0 | 4797 | 0 |
| D | 0 | 7466 | 0 |
| Quadrant | Total seconds | Saturated seconds | Saturation percentage |
|---|---|---|---|
| A | 2292 | 3 | 0.130890% |
| B | 2299 | 7 | 0.304480% |
| C | 2306 | 9 | 0.390286% |
| D | 2281 | 161 | 7.058308% |
Noise dominated data is calculated using 1-second bins in cleaned event files. If a bin has >2000 counts, and if more than 50% of those come from <1% of pixels, then it is considered to be noise-dominated and hence unusable.
| Quadrant | # 1 sec bins | Bins with >0 counts | Bins with >2000 counts | High rate bins dominated by noise | Noise dominated (total time) | Noise dominated (detector-on time) | Marked lightcurve |
|---|---|---|---|---|---|---|---|
| A | 6163 | 2347 | 2 | 2 | 0.03% | 0.09% | 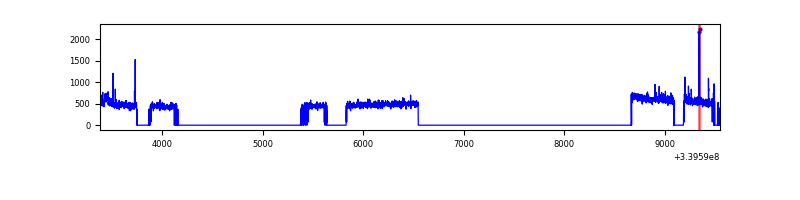 |
| B | 6149 | 2350 | 0 | 0 | 0.00% | 0.00% | 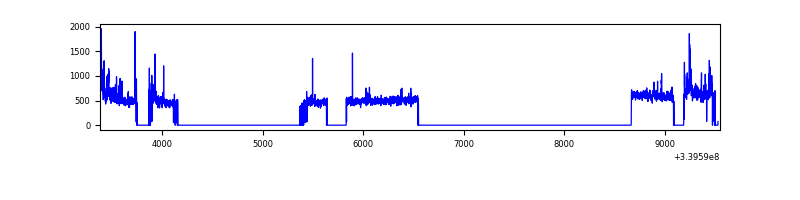 |
| C | 6167 | 2356 | 2 | 2 | 0.03% | 0.08% | 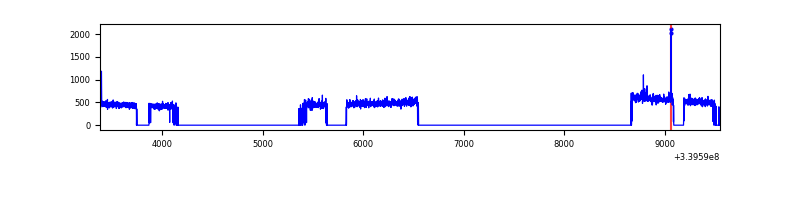 |
| D | 6116 | 2339 | 146 | 146 | 2.39% | 6.24% | 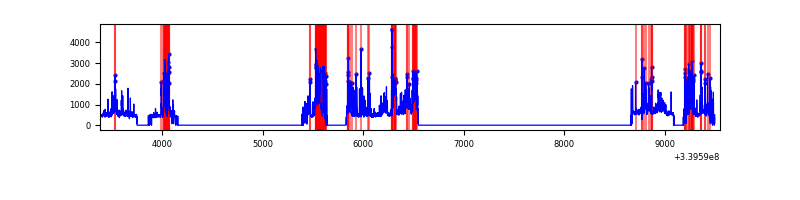 |
Top three noisy pixels from each quadrant. If the there are fewer than three noisy pixels in the level2.evt file, extra rows are filled as -1
| Pixel properties | Quadrant properties | ||||||
|---|---|---|---|---|---|---|---|
| Quadrant | DetID | PixID | Counts | Sigma | Mean | Median | Sigma |
| A | 13 | 248 | 16017 | 261.41 | 294 | 288 | 60.2 |
| A | 0 | 13 | 8502 | 136.51 | 294 | 288 | 60.2 |
| A | 7 | 192 | 8169 | 130.98 | 294 | 288 | 60.2 |
| B | 15 | 33 | 73081 | 1301.56 | 291 | 285 | 55.9 |
| B | 3 | 112 | 24656 | 435.74 | 291 | 285 | 55.9 |
| B | 0 | 229 | 17406 | 306.12 | 291 | 285 | 55.9 |
| C | 14 | 238 | 44699 | 670.55 | 276 | 277 | 66.2 |
| C | 15 | 208 | 8020 | 116.88 | 276 | 277 | 66.2 |
| C | 13 | 61 | 1927 | 24.91 | 276 | 277 | 66.2 |
| D | 1 | 52 | 714597 | 10825.61 | 272 | 265 | 66.0 |
| D | 11 | 176 | 83017 | 1254.1 | 272 | 265 | 66.0 |
| D | 7 | 38 | 50042 | 754.36 | 272 | 265 | 66.0 |
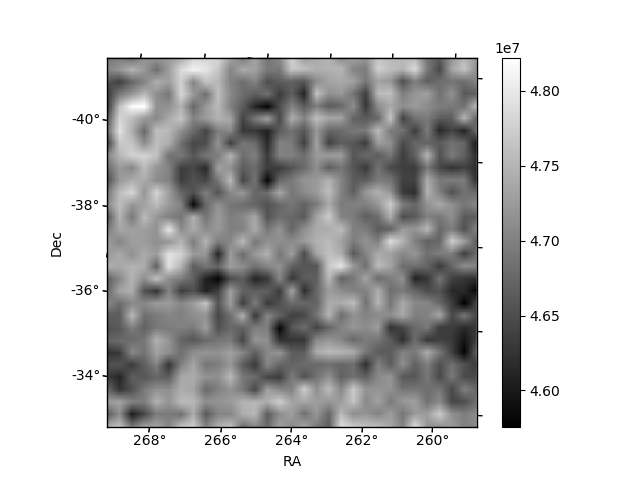
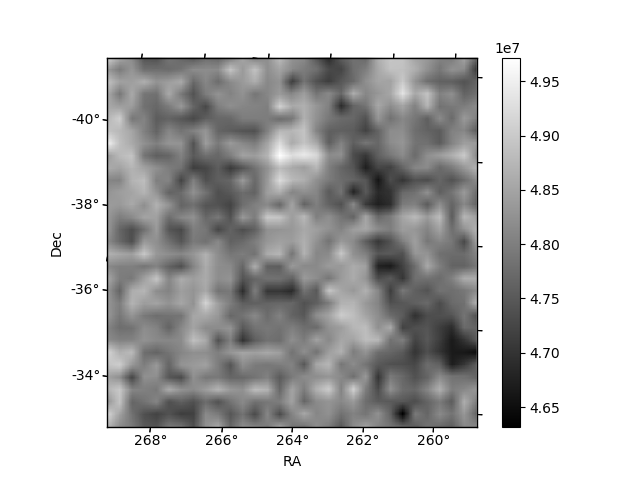
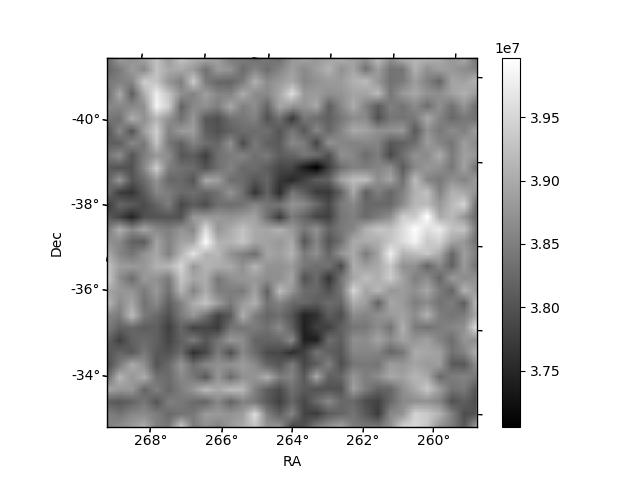
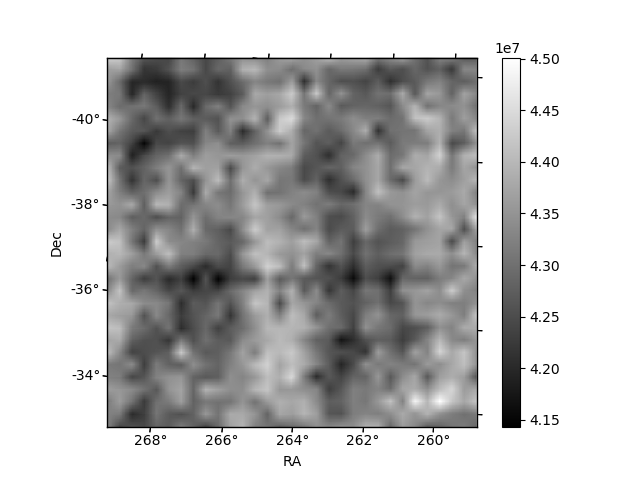
Histogram calculated using DETX and DETY for each event in the final _common_clean file
| Quadrant A | 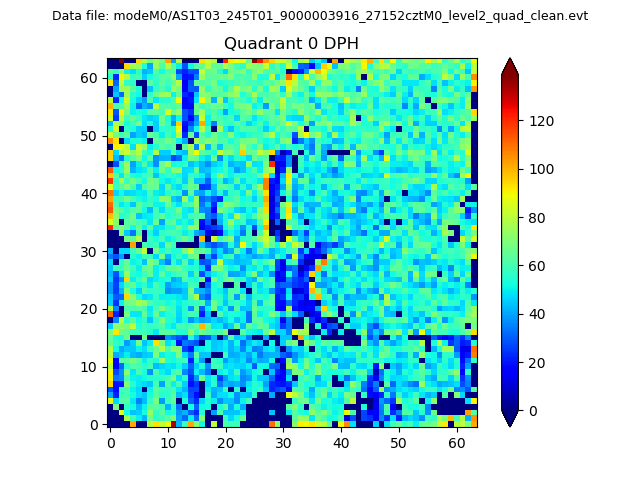 |
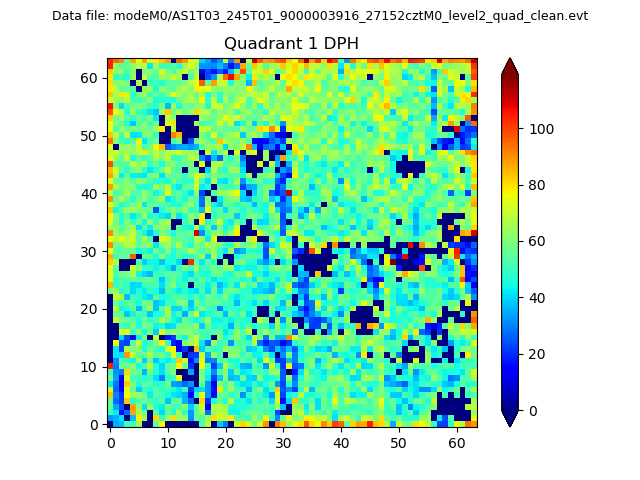 |
Quadrant B |
|---|---|---|---|
| Quadrant D |  |
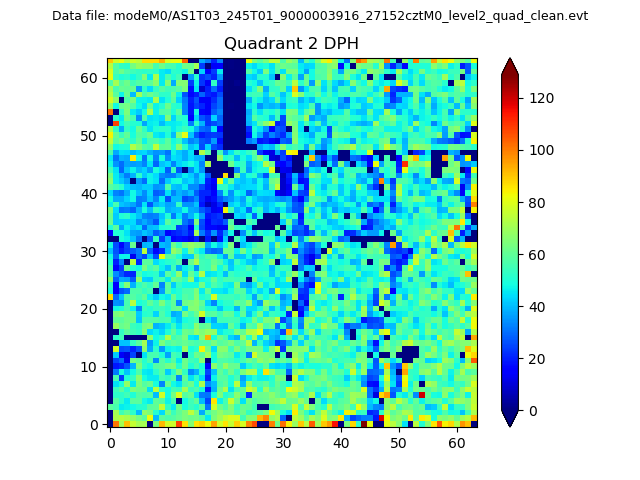 |
Quadrant C |
| Plot type | Count rate plots | Images |
|---|---|---|
| Comparison with Poisson distribution Blue bars denote a histogram of data divided into 1 sec bins. Red curve is a Poisson curve with rate = median count rate of data. |
 |
 |
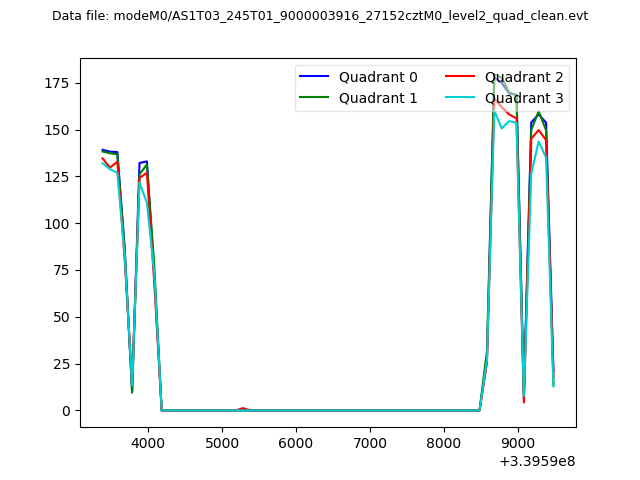
| Quadrant-wise count rates Data is divided into 100 sec bins |
 |
|
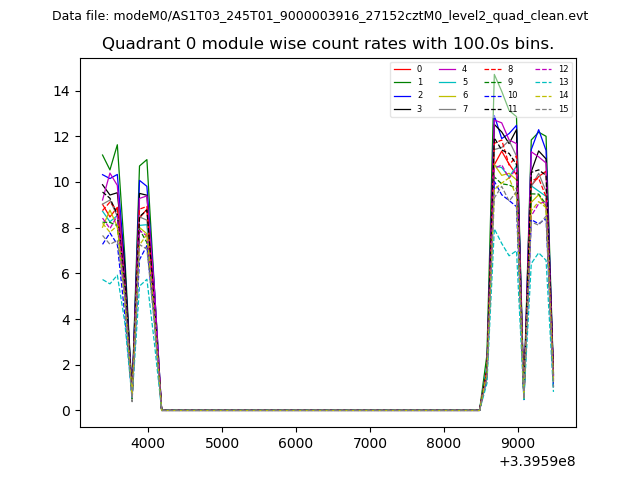
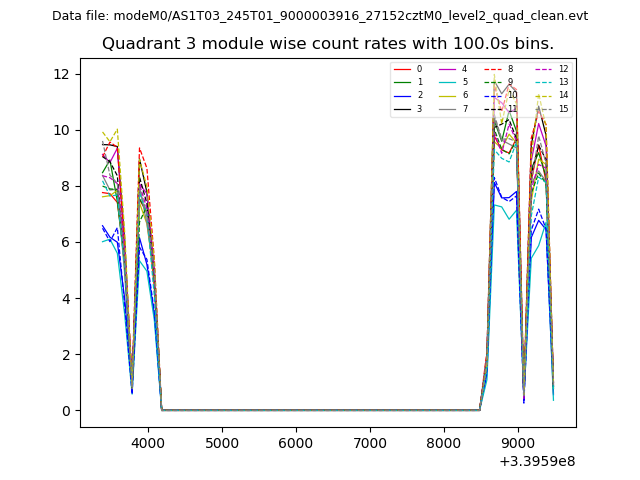
| Module-wise count rates for Quadrant A Data is divided into 100 sec bins |
 |
 |
| Module-wise count rates for Quadrant B Data is divided into 100 sec bins |
 |
 |
| Module-wise count rates for Quadrant C Data is divided into 100 sec bins |
 |
 |
| Module-wise count rates for Quadrant D Data is divided into 100 sec bins |
 |
 |
| Parameter | Plot |
|---|---|
| CZT HV Monitor |  |
| D_VDD | 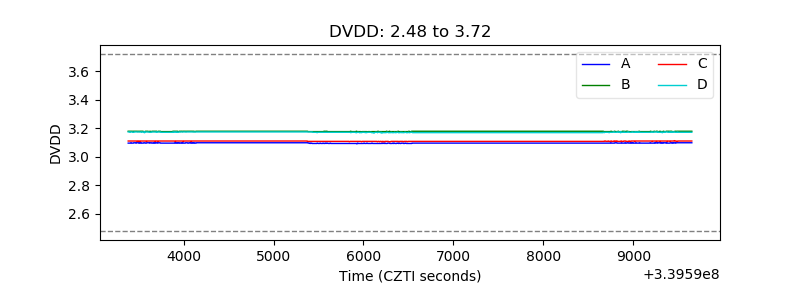 |
| Temperature 1 | 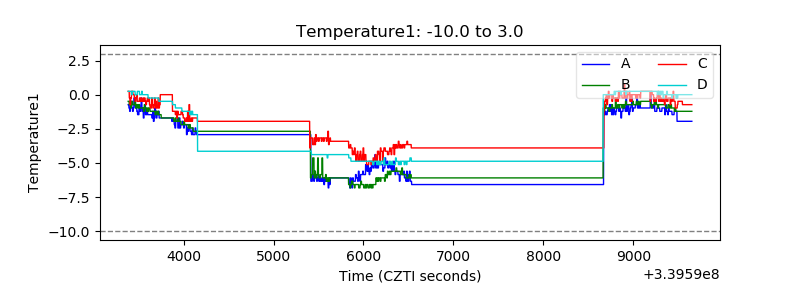 |
| Veto HV Monitor | 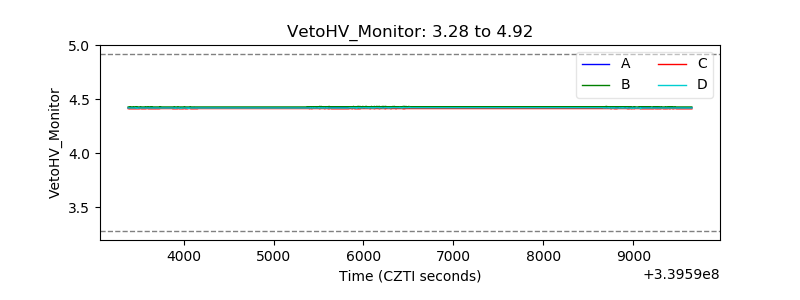 |
| Veto LLD | 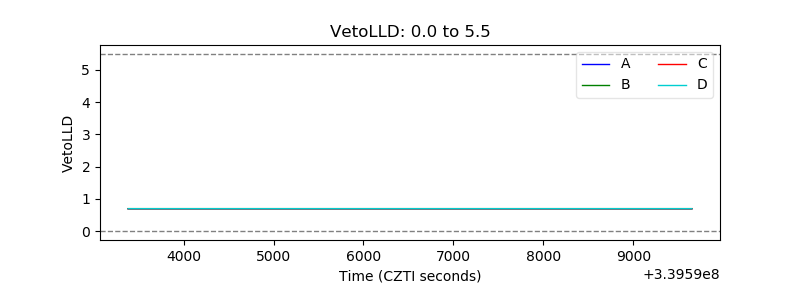 |
| Alpha Counter | 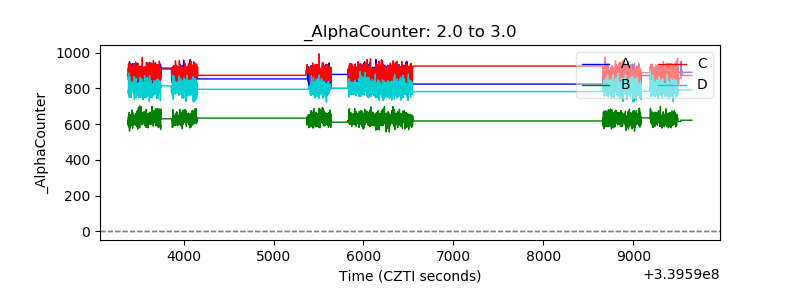 |
| _CPM_Rate | 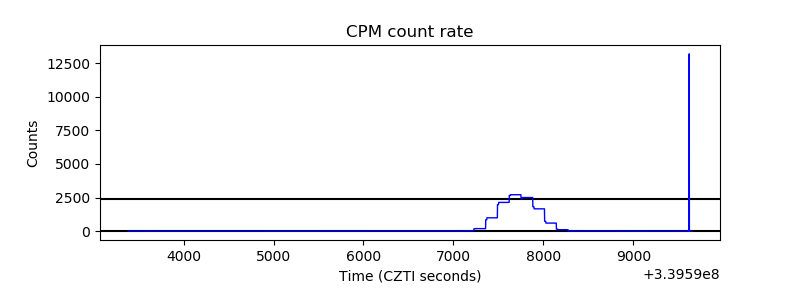 |
| CZT Counter | 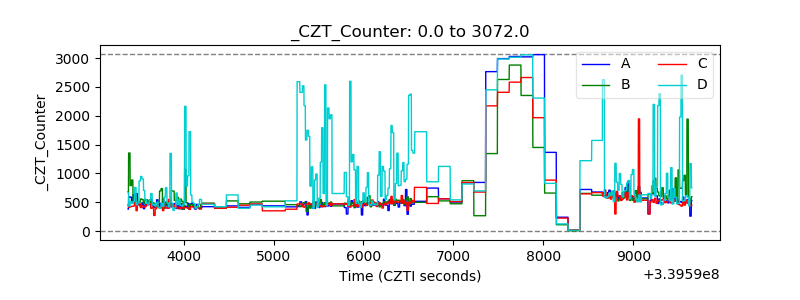 |
| +2.5 Volts monitor |  |
| +5 Volts monitor |  |
| _ROLL_ROT | 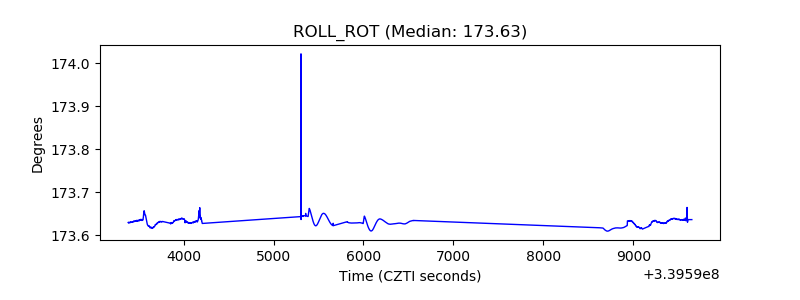 |
| _Roll_DEC | 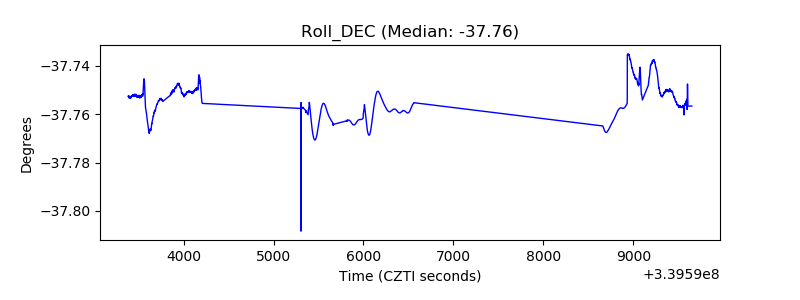 |
| _Roll_RA | 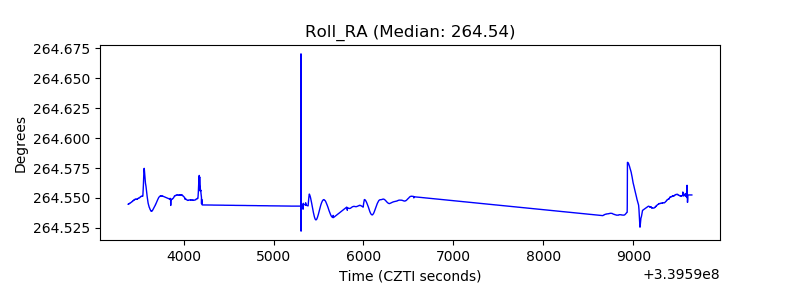 |
| Veto Counter | 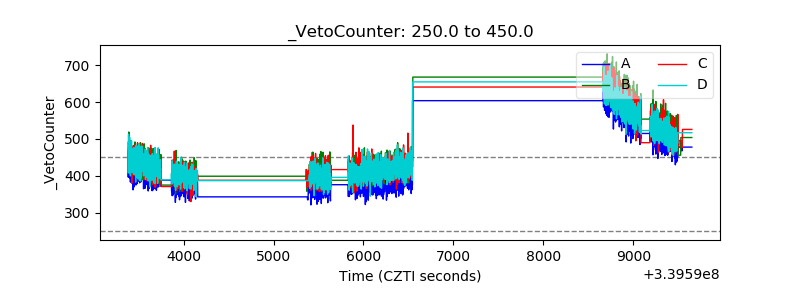 |