| Param | Original file | Final file |
|---|---|---|
| Filename | modeM0/AS1T03_245T01_9000003916_27153cztM0_level2.evt | modeM0/AS1T03_245T01_9000003916_27153cztM0_level2_quad_clean.evt |
| Size (bytes) | 1,326,418,560 | 226,059,840 |
| Size | 1.2 GB | 215.6 MB |
| Events in quadrant A | 8,033,009 | 1,509,201 |
| Events in quadrant B | 9,103,530 | 1,495,085 |
| Events in quadrant C | 7,668,116 | 1,438,425 |
| Events in quadrant D | 14,316,895 | 1,330,931 |
| Mode M0 | |||
|---|---|---|---|
| Quadrant | BADHDUFLAG | Total packets | Discarded packets |
| A | 0 | 34114 | 0 |
| B | 0 | 37117 | 0 |
| C | 0 | 33034 | 0 |
| D | 0 | 53008 | 0 |
| Mode M9 | |||
|---|---|---|---|
| Quadrant | BADHDUFLAG | Total packets | Discarded packets |
| A | 0 | 35 | 0 |
| B | 0 | 35 | 0 |
| C | 0 | 35 | 0 |
| D | 0 | 35 | 0 |
| Quadrant | Total seconds | Saturated seconds | Saturation percentage |
|---|---|---|---|
| A | 15556 | 182 | 1.169967% |
| B | 15556 | 449 | 2.886346% |
| C | 15556 | 233 | 1.497814% |
| D | 15556 | 1686 | 10.838262% |
Noise dominated data is calculated using 1-second bins in cleaned event files. If a bin has >2000 counts, and if more than 50% of those come from <1% of pixels, then it is considered to be noise-dominated and hence unusable.
| Quadrant | # 1 sec bins | Bins with >0 counts | Bins with >2000 counts | High rate bins dominated by noise | Noise dominated (total time) | Noise dominated (detector-on time) | Marked lightcurve |
|---|---|---|---|---|---|---|---|
| A | 19011 | 15559 | 10 | 10 | 0.05% | 0.06% | 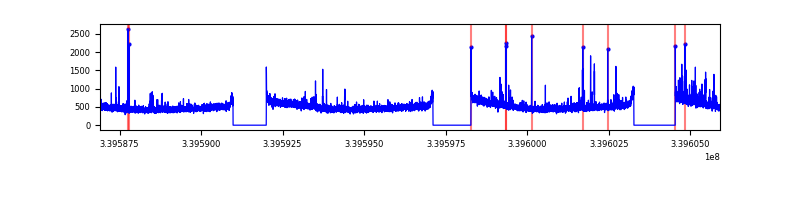 |
| B | 19011 | 15559 | 153 | 153 | 0.80% | 0.98% | 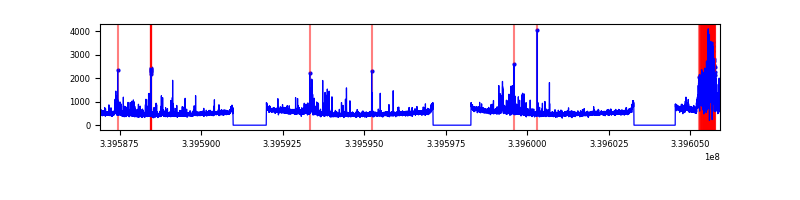 |
| C | 19011 | 15559 | 2 | 2 | 0.01% | 0.01% | 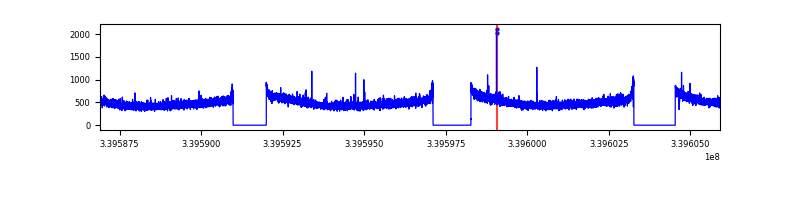 |
| D | 19011 | 15559 | 1443 | 1443 | 7.59% | 9.27% | 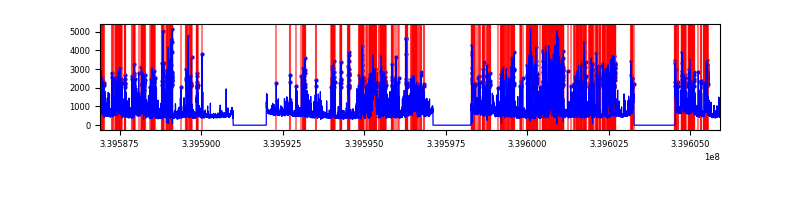 |
Top three noisy pixels from each quadrant. If the there are fewer than three noisy pixels in the level2.evt file, extra rows are filled as -1
| Pixel properties | Quadrant properties | ||||||
|---|---|---|---|---|---|---|---|
| Quadrant | DetID | PixID | Counts | Sigma | Mean | Median | Sigma |
| A | 0 | 13 | 147644 | 364.73 | 2006 | 1969 | 399.4 |
| A | 13 | 248 | 48523 | 116.56 | 2006 | 1969 | 399.4 |
| A | 14 | 235 | 47849 | 114.87 | 2006 | 1969 | 399.4 |
| B | 15 | 33 | 983736 | 2677.18 | 1965 | 1922 | 366.7 |
| B | 3 | 112 | 194055 | 523.9 | 1965 | 1922 | 366.7 |
| B | 0 | 229 | 62667 | 165.64 | 1965 | 1922 | 366.7 |
| C | 14 | 238 | 303981 | 686.81 | 1883 | 1896 | 439.8 |
| C | 15 | 208 | 23232 | 48.51 | 1883 | 1896 | 439.8 |
| C | 13 | 61 | 13092 | 25.45 | 1883 | 1896 | 439.8 |
| D | 1 | 52 | 6041597 | 12635.65 | 1813 | 1787 | 478.0 |
| D | 7 | 38 | 583239 | 1216.43 | 1813 | 1787 | 478.0 |
| D | 2 | 250 | 276955 | 575.67 | 1813 | 1787 | 478.0 |
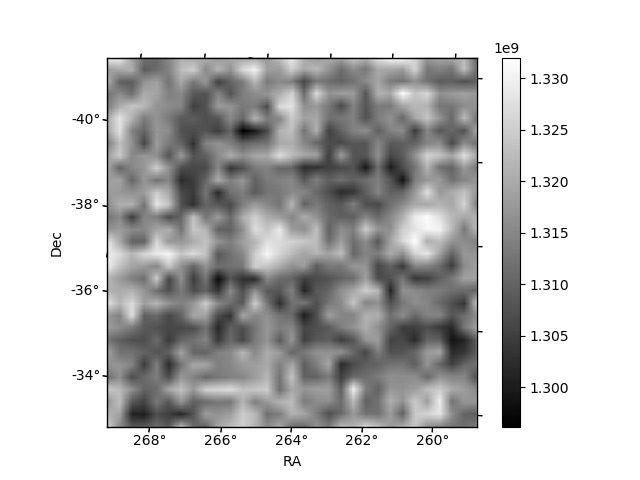
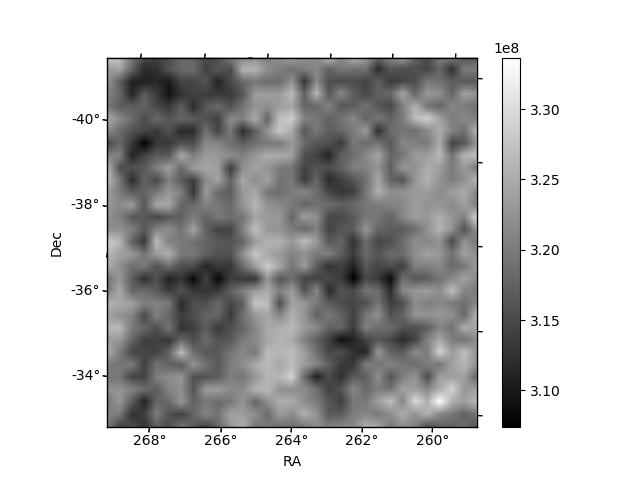
Histogram calculated using DETX and DETY for each event in the final _common_clean file
| Quadrant A | 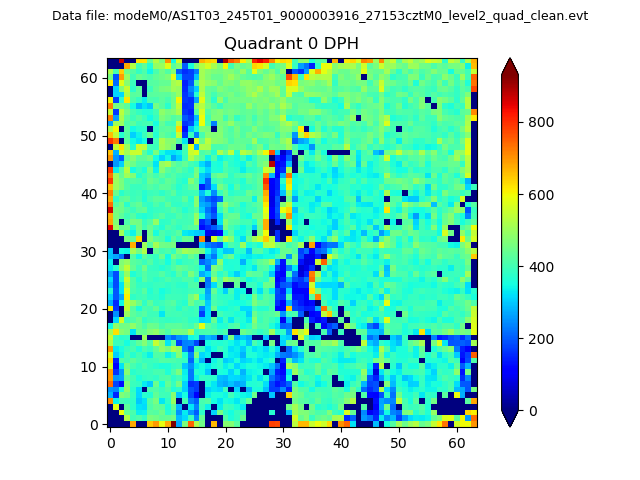 |
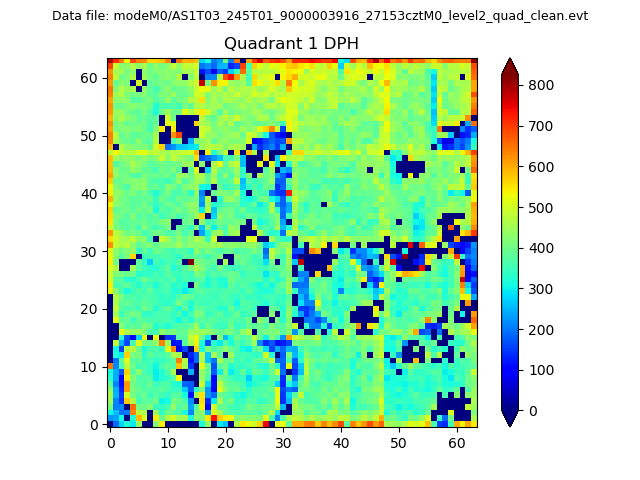 |
Quadrant B |
|---|---|---|---|
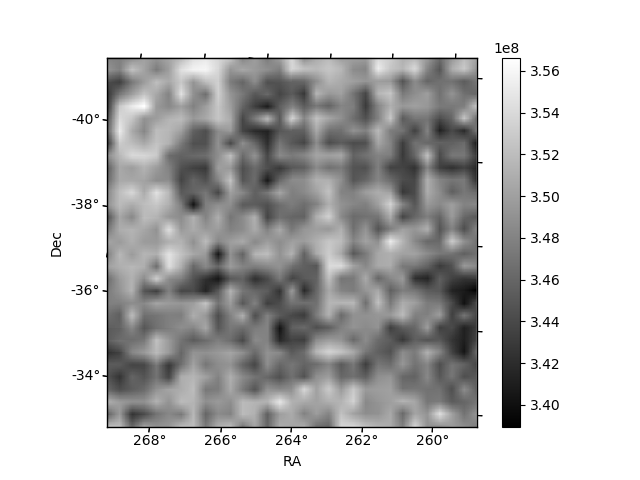
| Quadrant D | 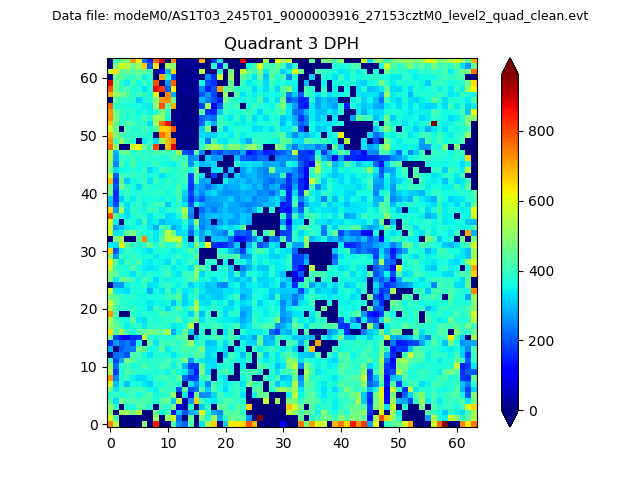 |
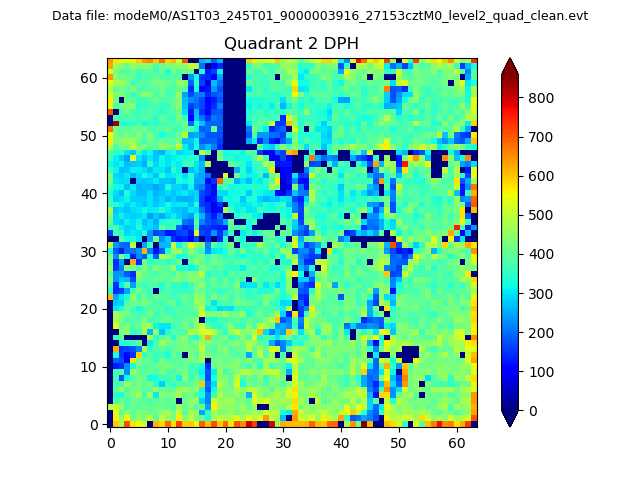 |
Quadrant C |
| Plot type | Count rate plots | Images |
|---|---|---|
| Comparison with Poisson distribution Blue bars denote a histogram of data divided into 1 sec bins. Red curve is a Poisson curve with rate = median count rate of data. |
 |
 |
| Quadrant-wise count rates Data is divided into 100 sec bins |
 |
|
| Module-wise count rates for Quadrant A Data is divided into 100 sec bins |
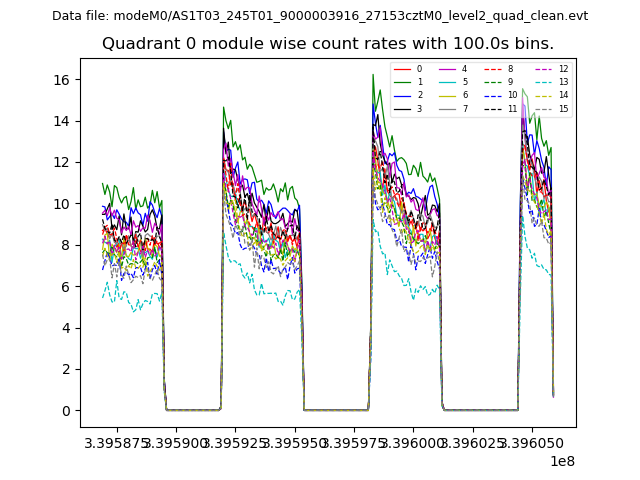 |
 |
| Module-wise count rates for Quadrant B Data is divided into 100 sec bins |
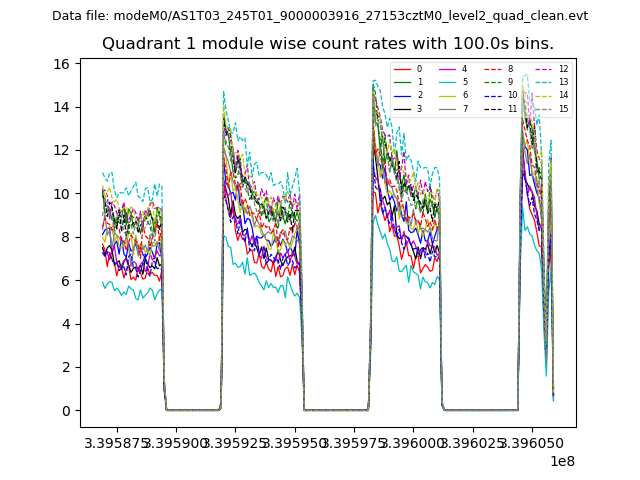 |
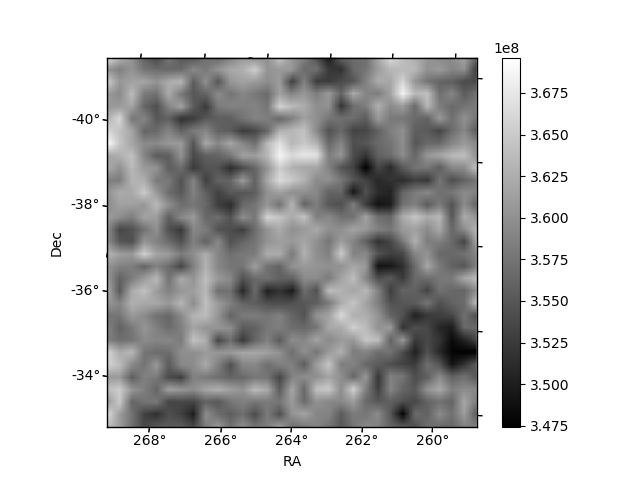 |
| Module-wise count rates for Quadrant C Data is divided into 100 sec bins |
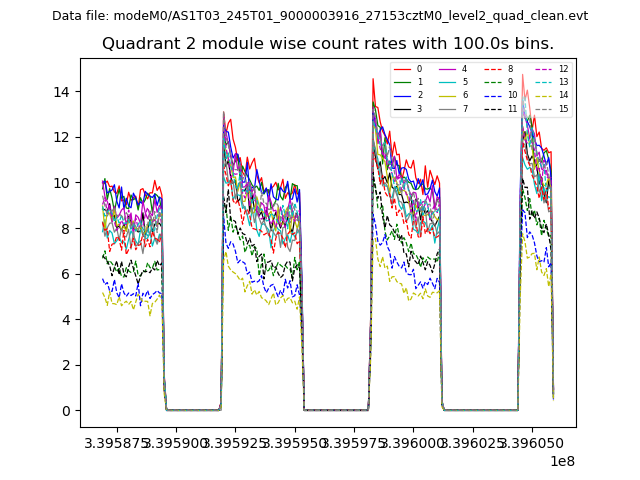 |
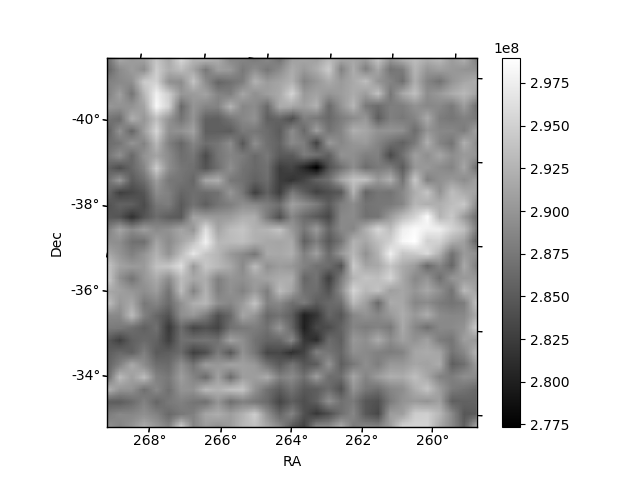 |
| Module-wise count rates for Quadrant D Data is divided into 100 sec bins |
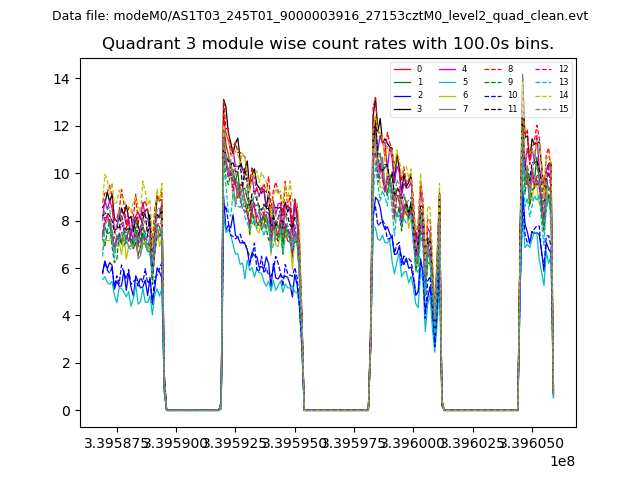 |
 |
| Parameter | Plot |
|---|---|
| CZT HV Monitor |  |
| D_VDD | 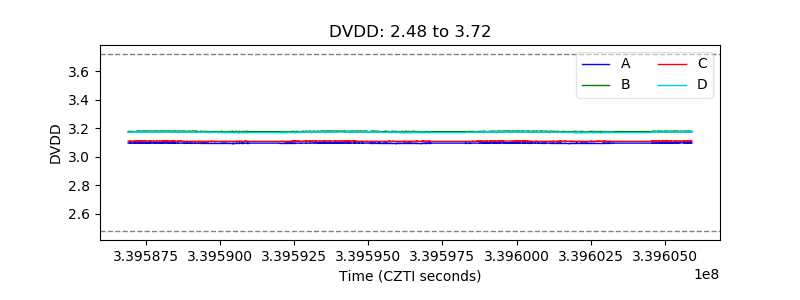 |
| Temperature 1 | 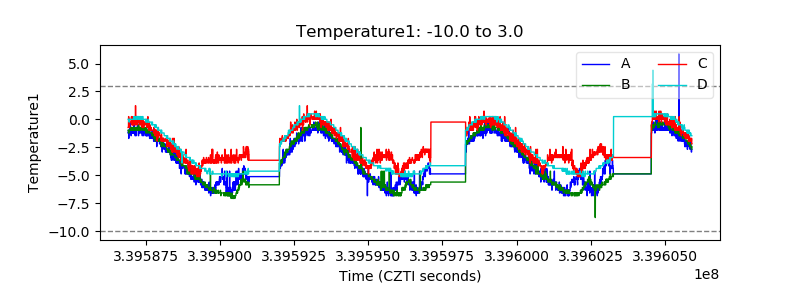 |
| Veto HV Monitor | 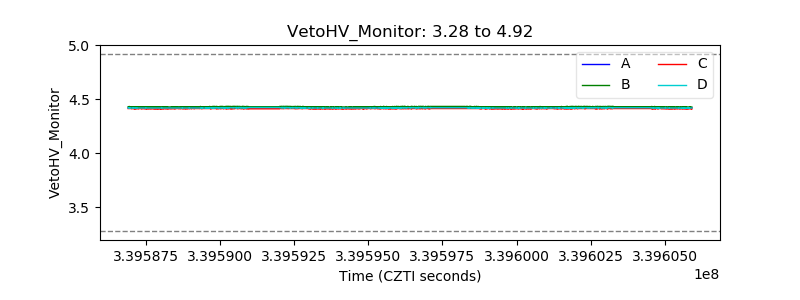 |
| Veto LLD | 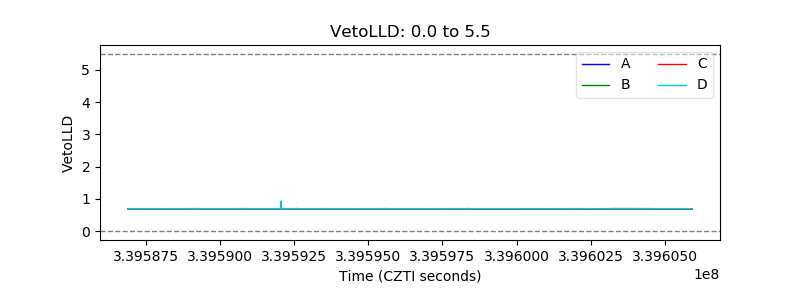 |
| Alpha Counter |  |
| _CPM_Rate | 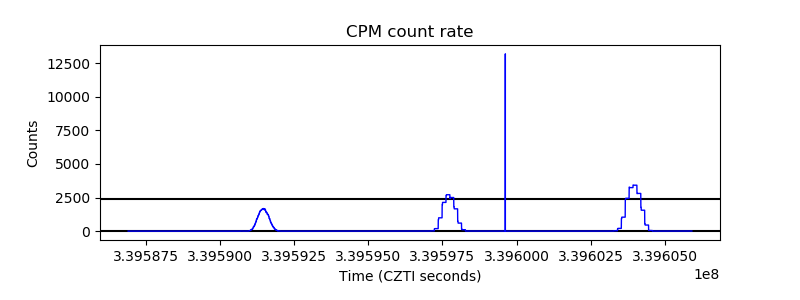 |
| CZT Counter | 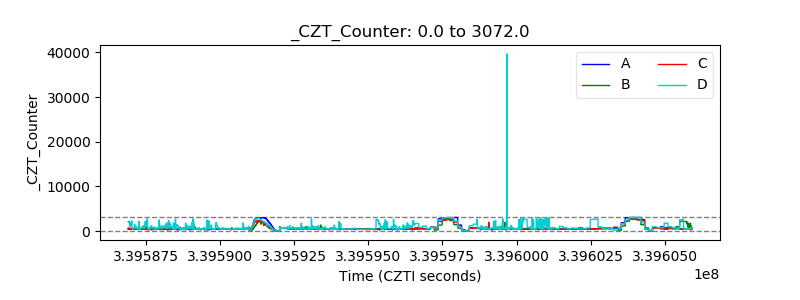 |
| +2.5 Volts monitor |  |
| +5 Volts monitor |  |
| _ROLL_ROT | 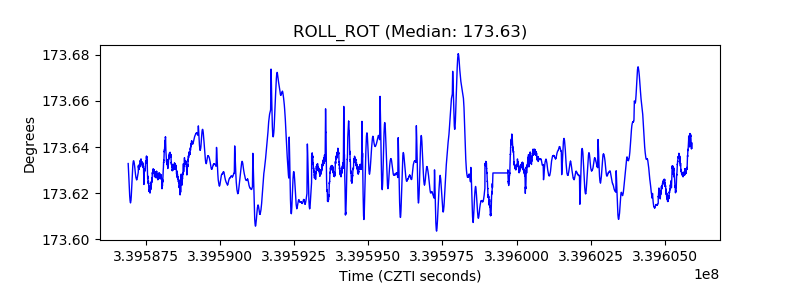 |
| _Roll_DEC | 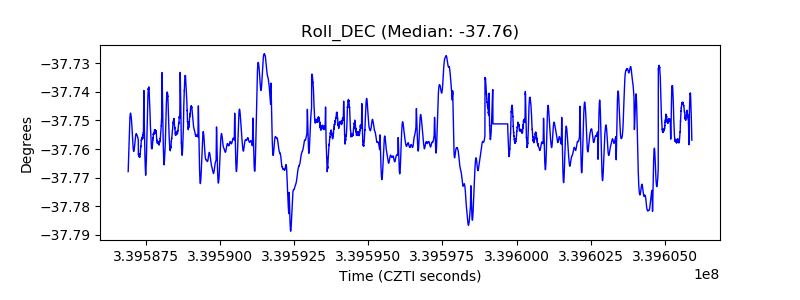 |
| _Roll_RA | 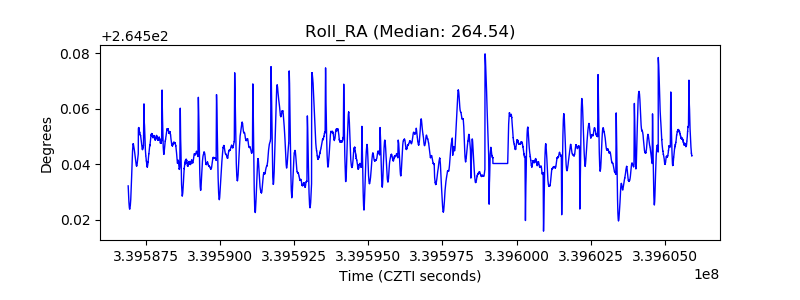 |
| Veto Counter | 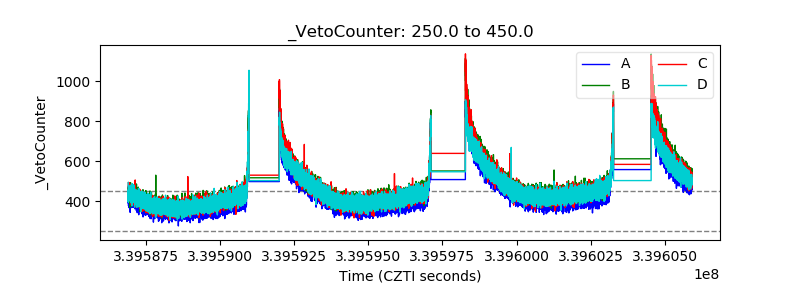 |