| Param | Original file | Final file |
|---|---|---|
| Filename | modeM0/AS1T03_245T01_9000003916_27154cztM0_level2.evt | modeM0/AS1T03_245T01_9000003916_27154cztM0_level2_quad_clean.evt |
| Size (bytes) | 526,435,200 | 92,548,800 |
| Size | 502.0 MB | 88.3 MB |
| Events in quadrant A | 3,489,507 | 628,296 |
| Events in quadrant B | 4,300,251 | 604,273 |
| Events in quadrant C | 3,108,438 | 599,049 |
| Events in quadrant D | 4,638,326 | 551,804 |
| Mode M0 | |||
|---|---|---|---|
| Quadrant | BADHDUFLAG | Total packets | Discarded packets |
| A | 0 | 14176 | 0 |
| B | 0 | 16616 | 0 |
| C | 0 | 12906 | 0 |
| D | 0 | 17751 | 0 |
| Mode M9 | |||
|---|---|---|---|
| Quadrant | BADHDUFLAG | Total packets | Discarded packets |
| A | 0 | 13 | 0 |
| B | 0 | 13 | 0 |
| C | 0 | 13 | 0 |
| D | 0 | 13 | 0 |
| Quadrant | Total seconds | Saturated seconds | Saturation percentage |
|---|---|---|---|
| A | 5999 | 72 | 1.200200% |
| B | 5999 | 437 | 7.284547% |
| C | 5999 | 93 | 1.550258% |
| D | 5999 | 485 | 8.084681% |
Noise dominated data is calculated using 1-second bins in cleaned event files. If a bin has >2000 counts, and if more than 50% of those come from <1% of pixels, then it is considered to be noise-dominated and hence unusable.
| Quadrant | # 1 sec bins | Bins with >0 counts | Bins with >2000 counts | High rate bins dominated by noise | Noise dominated (total time) | Noise dominated (detector-on time) | Marked lightcurve |
|---|---|---|---|---|---|---|---|
| A | 7319 | 6000 | 9 | 9 | 0.12% | 0.15% | 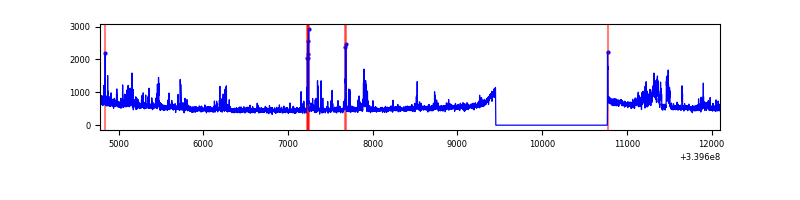 |
| B | 7319 | 6000 | 211 | 211 | 2.88% | 3.52% | 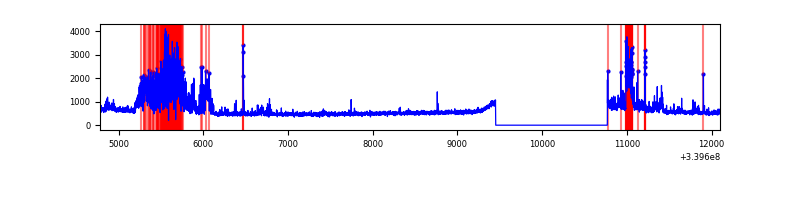 |
| C | 7319 | 6000 | 1 | 1 | 0.01% | 0.02% | 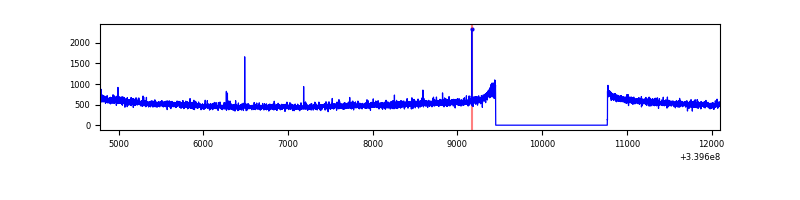 |
| D | 7319 | 6000 | 394 | 394 | 5.38% | 6.57% | 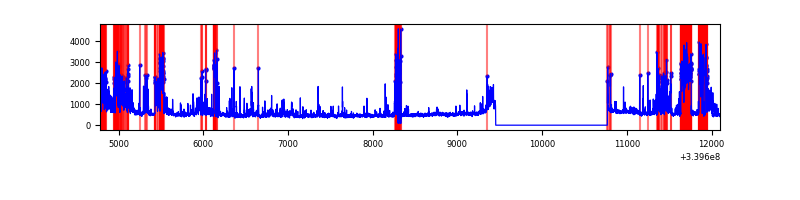 |
Top three noisy pixels from each quadrant. If the there are fewer than three noisy pixels in the level2.evt file, extra rows are filled as -1
| Pixel properties | Quadrant properties | ||||||
|---|---|---|---|---|---|---|---|
| Quadrant | DetID | PixID | Counts | Sigma | Mean | Median | Sigma |
| A | 0 | 13 | 148249 | 902.47 | 814 | 802 | 163.4 |
| A | 6 | 16 | 116415 | 707.62 | 814 | 802 | 163.4 |
| A | 14 | 235 | 75776 | 458.89 | 814 | 802 | 163.4 |
| B | 15 | 33 | 852376 | 5889.2 | 781 | 768 | 144.6 |
| B | 5 | 172 | 218576 | 1506.23 | 781 | 768 | 144.6 |
| B | 3 | 112 | 78325 | 536.34 | 781 | 768 | 144.6 |
| C | 14 | 238 | 123608 | 693.58 | 763 | 773 | 177.1 |
| C | 15 | 208 | 8948 | 46.16 | 763 | 773 | 177.1 |
| C | 13 | 61 | 5505 | 26.72 | 763 | 773 | 177.1 |
| D | 7 | 38 | 818449 | 4212.3 | 739 | 725 | 194.1 |
| D | 1 | 52 | 691350 | 3557.58 | 739 | 725 | 194.1 |
| D | 2 | 250 | 189197 | 970.87 | 739 | 725 | 194.1 |
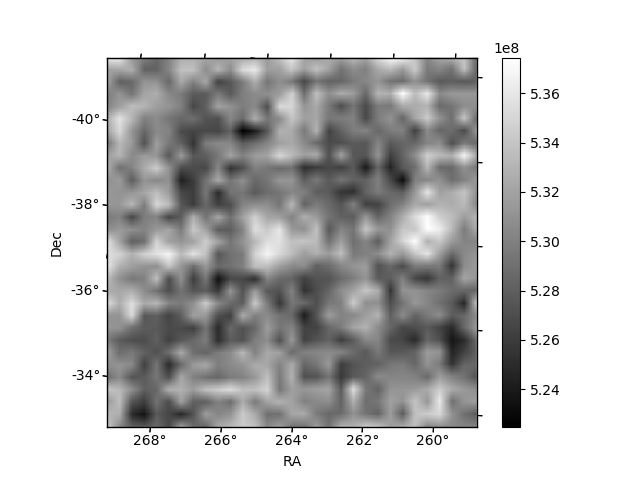
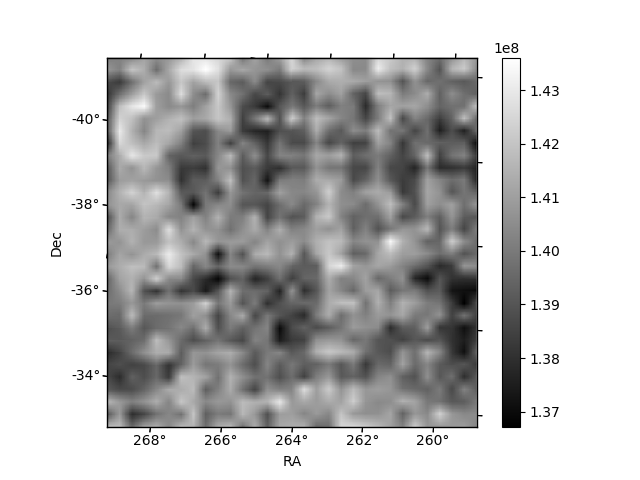
Histogram calculated using DETX and DETY for each event in the final _common_clean file
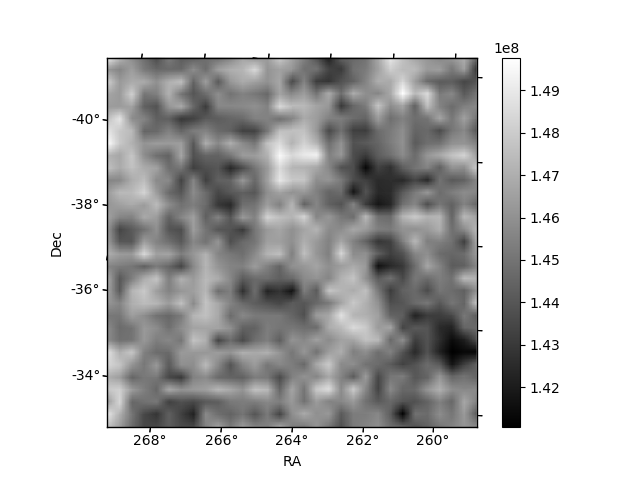
| Quadrant A | 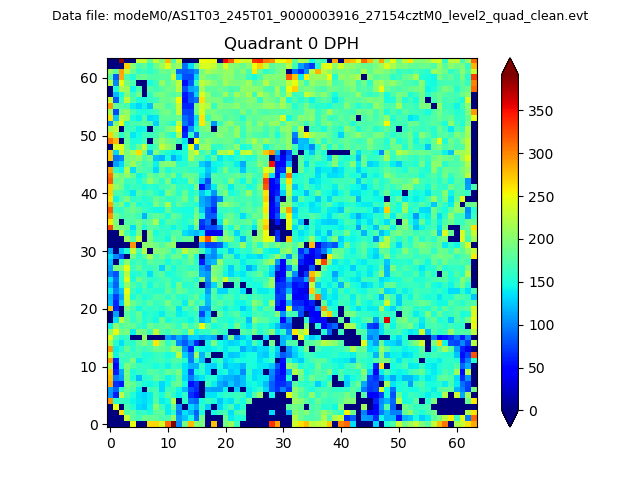 |
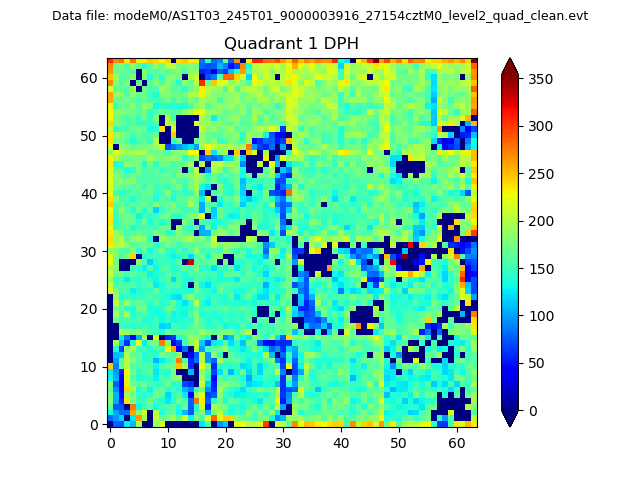 |
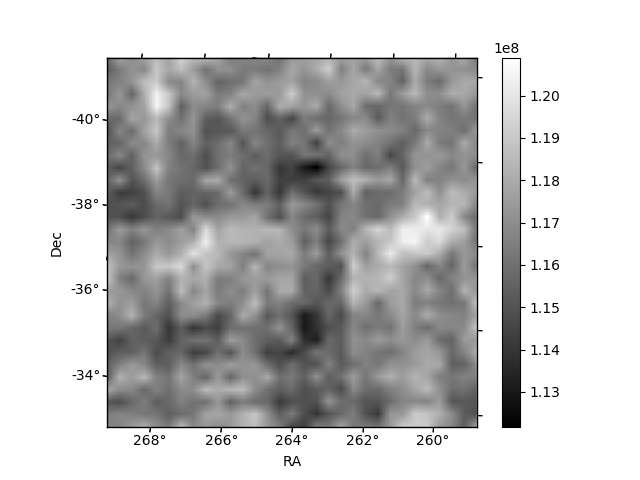
Quadrant B |
|---|---|---|---|
| Quadrant D |  |
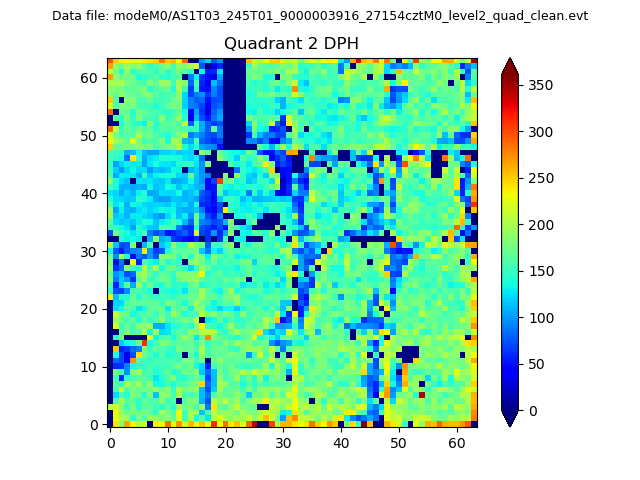 |
Quadrant C |
| Plot type | Count rate plots | Images |
|---|---|---|
| Comparison with Poisson distribution Blue bars denote a histogram of data divided into 1 sec bins. Red curve is a Poisson curve with rate = median count rate of data. |
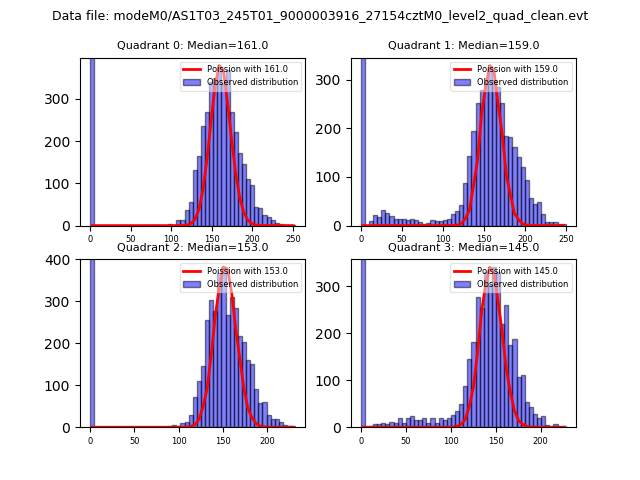 |
 |
| Quadrant-wise count rates Data is divided into 100 sec bins |
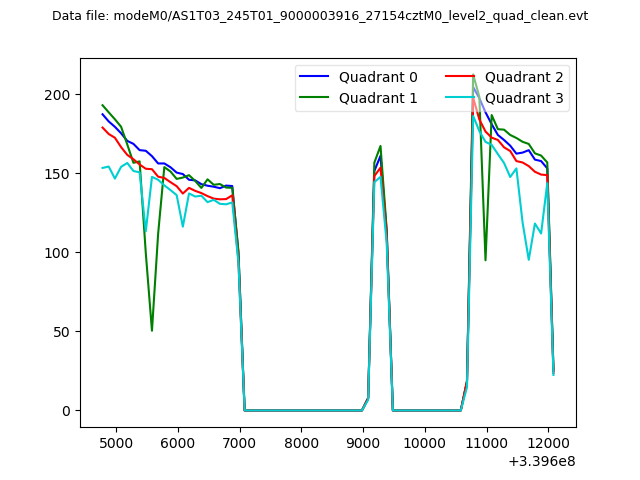 |
|
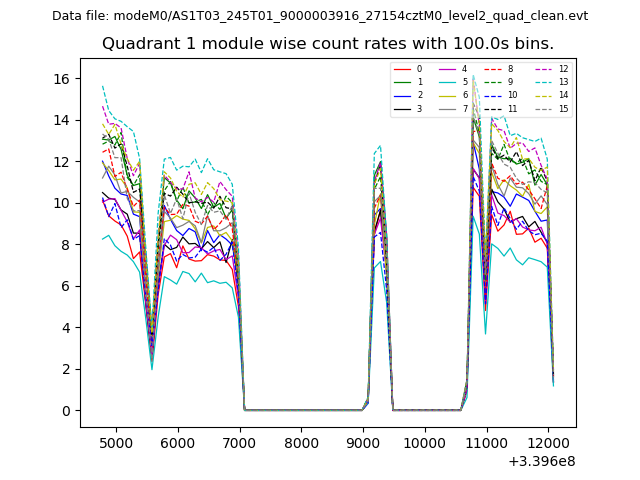
| Module-wise count rates for Quadrant A Data is divided into 100 sec bins |
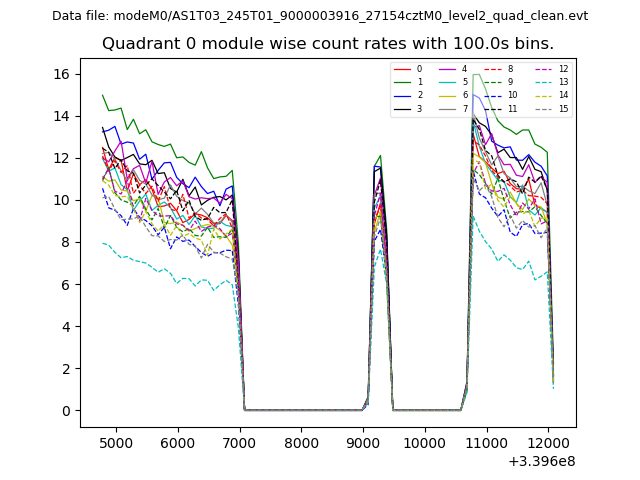 |
 |
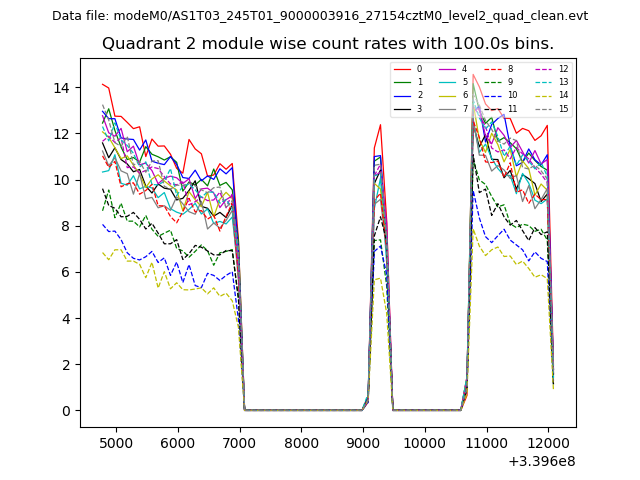
| Module-wise count rates for Quadrant B Data is divided into 100 sec bins |
 |
 |
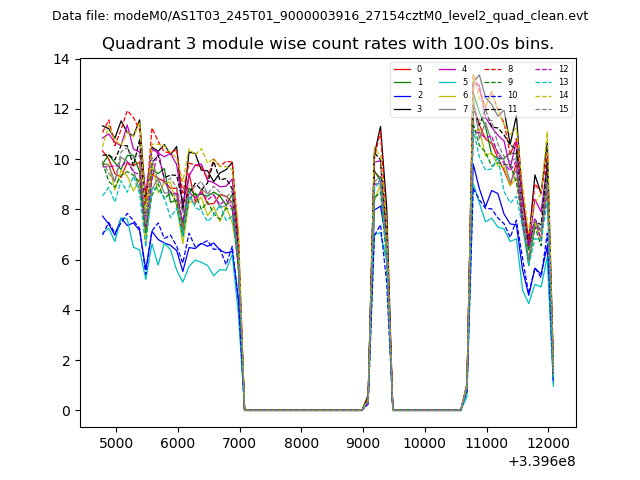
| Module-wise count rates for Quadrant C Data is divided into 100 sec bins |
 |
 |
| Module-wise count rates for Quadrant D Data is divided into 100 sec bins |
 |
 |
| Parameter | Plot |
|---|---|
| CZT HV Monitor | 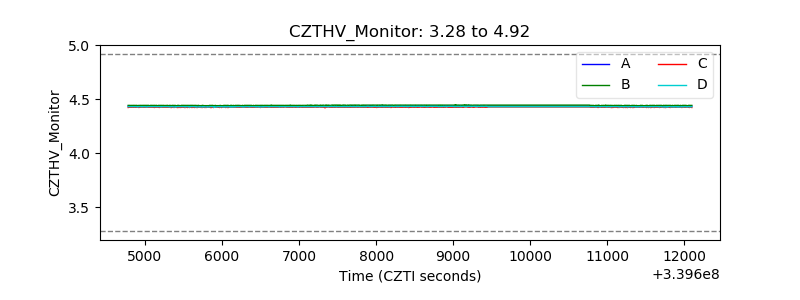 |
| D_VDD | 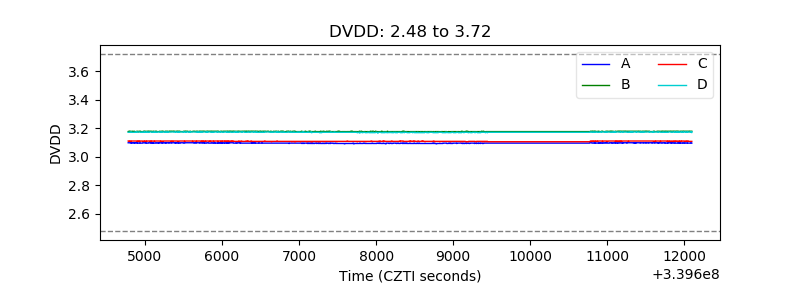 |
| Temperature 1 | 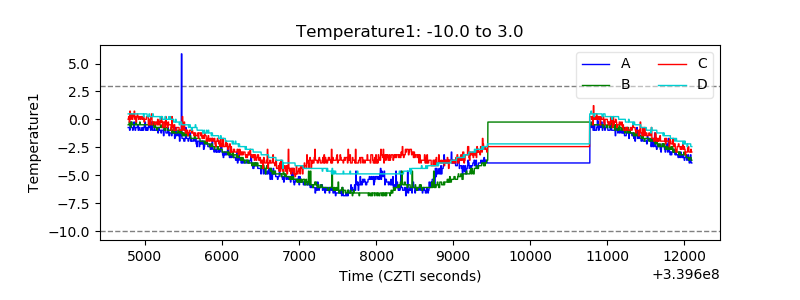 |
| Veto HV Monitor |  |
| Veto LLD | 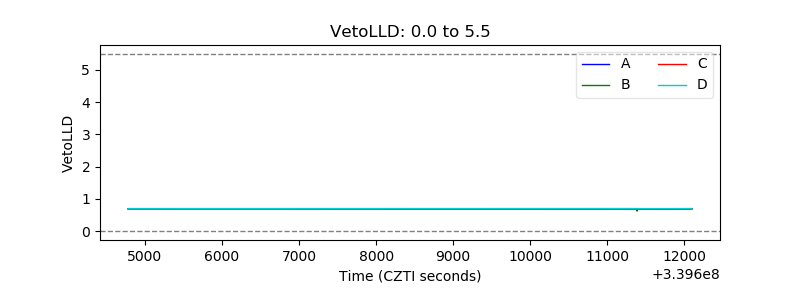 |
| Alpha Counter | 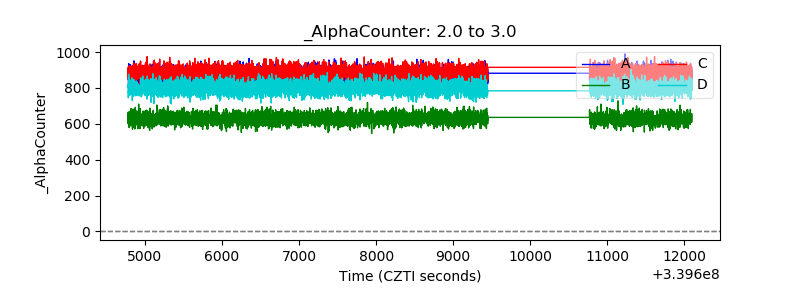 |
| _CPM_Rate | 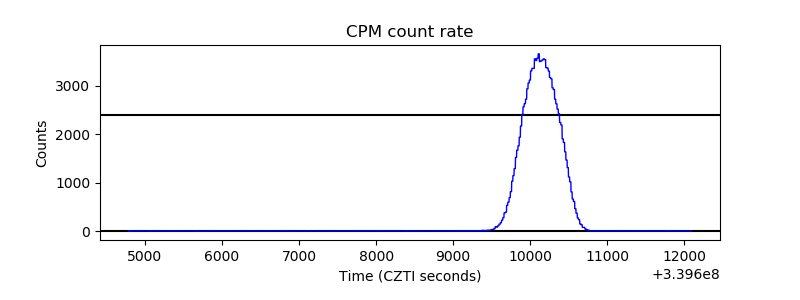 |
| CZT Counter | 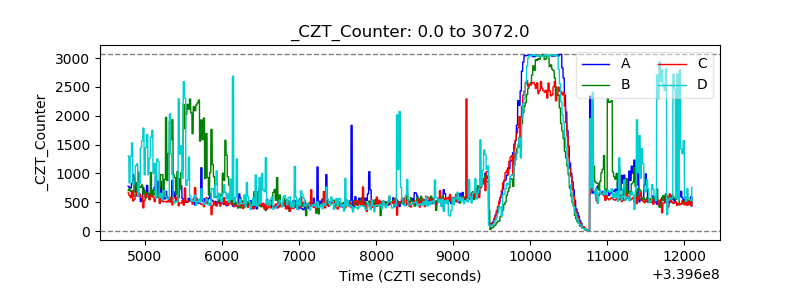 |
| +2.5 Volts monitor |  |
| +5 Volts monitor |  |
| _ROLL_ROT | 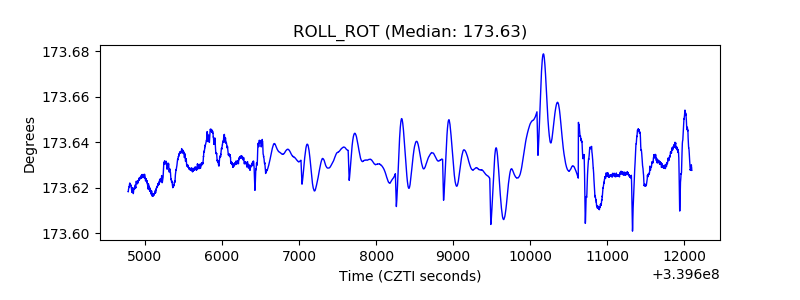 |
| _Roll_DEC | 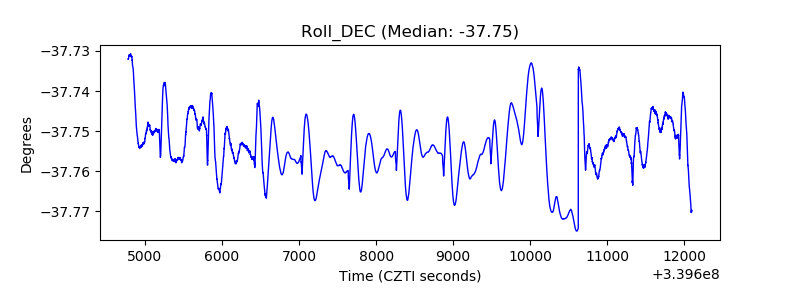 |
| _Roll_RA | 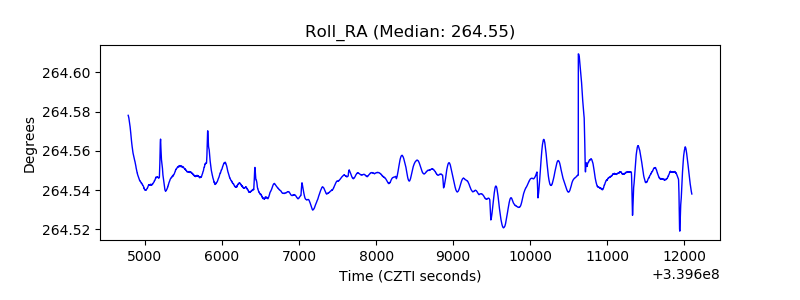 |
| Veto Counter | 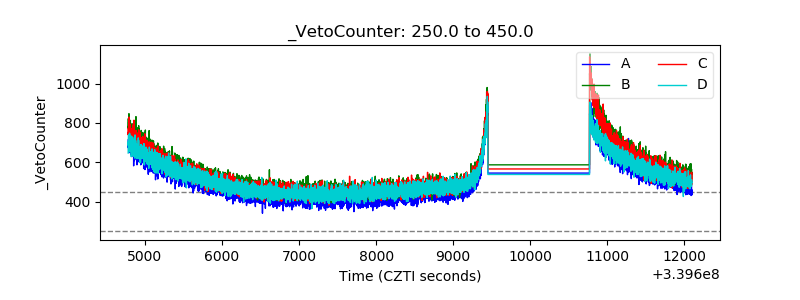 |