| Param | Original file | Final file |
|---|---|---|
| Filename | modeM0/AS1T03_245T01_9000003916_27155cztM0_level2.evt | modeM0/AS1T03_245T01_9000003916_27155cztM0_level2_quad_clean.evt |
| Size (bytes) | 539,890,560 | 93,625,920 |
| Size | 514.9 MB | 89.3 MB |
| Events in quadrant A | 3,644,782 | 627,987 |
| Events in quadrant B | 4,039,742 | 627,191 |
| Events in quadrant C | 3,117,223 | 604,449 |
| Events in quadrant D | 5,138,602 | 552,591 |
| Mode M0 | |||
|---|---|---|---|
| Quadrant | BADHDUFLAG | Total packets | Discarded packets |
| A | 0 | 14785 | 0 |
| B | 0 | 15722 | 0 |
| C | 0 | 12895 | 0 |
| D | 0 | 19362 | 0 |
| Mode M9 | |||
|---|---|---|---|
| Quadrant | BADHDUFLAG | Total packets | Discarded packets |
| A | 0 | 14 | 0 |
| B | 0 | 14 | 0 |
| C | 0 | 14 | 0 |
| D | 0 | 14 | 0 |
| Quadrant | Total seconds | Saturated seconds | Saturation percentage |
|---|---|---|---|
| A | 6062 | 63 | 1.039261% |
| B | 6061 | 253 | 4.174229% |
| C | 6061 | 80 | 1.319914% |
| D | 6061 | 404 | 6.665567% |
Noise dominated data is calculated using 1-second bins in cleaned event files. If a bin has >2000 counts, and if more than 50% of those come from <1% of pixels, then it is considered to be noise-dominated and hence unusable.
| Quadrant | # 1 sec bins | Bins with >0 counts | Bins with >2000 counts | High rate bins dominated by noise | Noise dominated (total time) | Noise dominated (detector-on time) | Marked lightcurve |
|---|---|---|---|---|---|---|---|
| A | 7422 | 6063 | 11 | 11 | 0.15% | 0.18% | 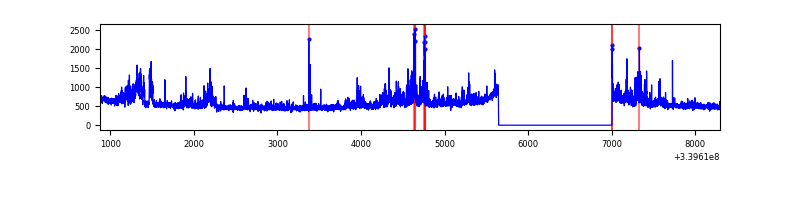 |
| B | 7421 | 6062 | 113 | 113 | 1.52% | 1.86% | 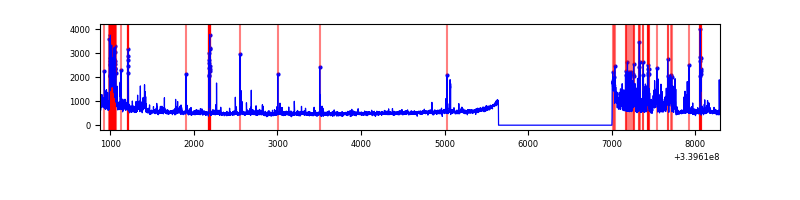 |
| C | 7421 | 6062 | 1 | 1 | 0.01% | 0.02% | 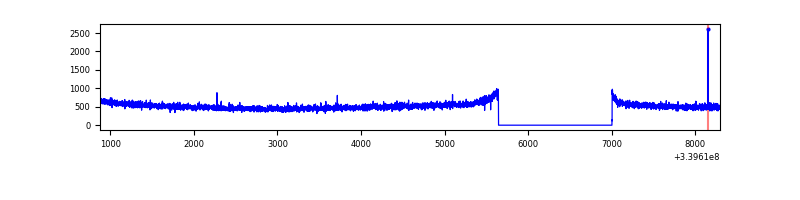 |
| D | 7421 | 6062 | 414 | 414 | 5.58% | 6.83% | 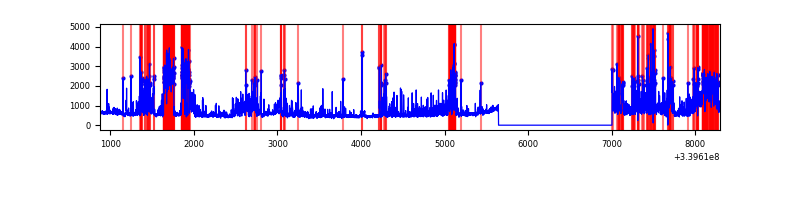 |
Top three noisy pixels from each quadrant. If the there are fewer than three noisy pixels in the level2.evt file, extra rows are filled as -1
| Pixel properties | Quadrant properties | ||||||
|---|---|---|---|---|---|---|---|
| Quadrant | DetID | PixID | Counts | Sigma | Mean | Median | Sigma |
| A | 0 | 13 | 325780 | 1993.97 | 811 | 798 | 163.0 |
| A | 6 | 16 | 113724 | 692.87 | 811 | 798 | 163.0 |
| A | 14 | 235 | 70385 | 426.96 | 811 | 798 | 163.0 |
| B | 15 | 33 | 392520 | 2643.04 | 798 | 782 | 148.2 |
| B | 5 | 172 | 256653 | 1726.35 | 798 | 782 | 148.2 |
| B | 3 | 112 | 188934 | 1269.45 | 798 | 782 | 148.2 |
| C | 14 | 238 | 124431 | 695.03 | 766 | 775 | 177.9 |
| C | 15 | 208 | 5915 | 28.89 | 766 | 775 | 177.9 |
| C | 13 | 61 | 5395 | 25.97 | 766 | 775 | 177.9 |
| D | 1 | 52 | 1068664 | 5500.06 | 741 | 726 | 194.2 |
| D | 7 | 38 | 842519 | 4335.37 | 741 | 726 | 194.2 |
| D | 2 | 250 | 275770 | 1416.52 | 741 | 726 | 194.2 |
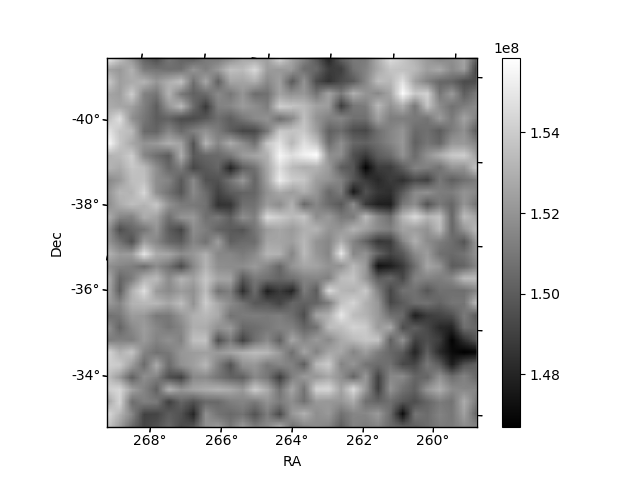
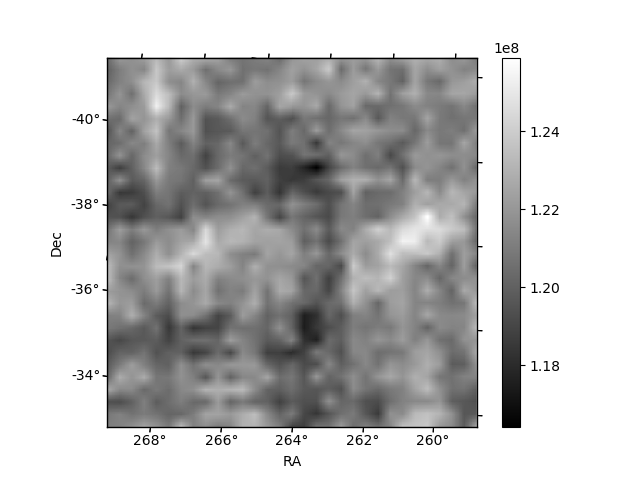
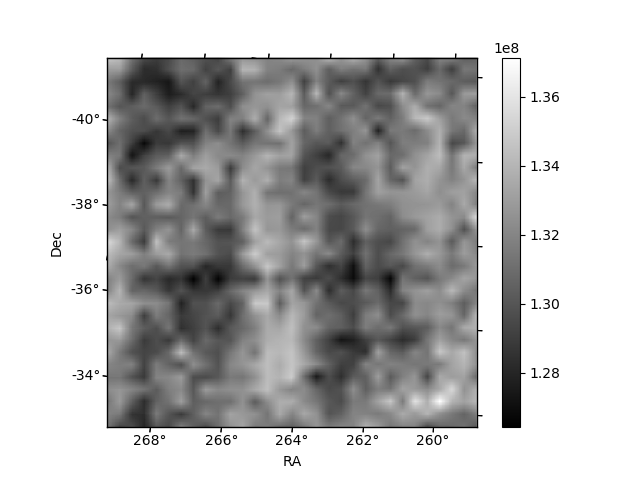
Histogram calculated using DETX and DETY for each event in the final _common_clean file
| Quadrant A | 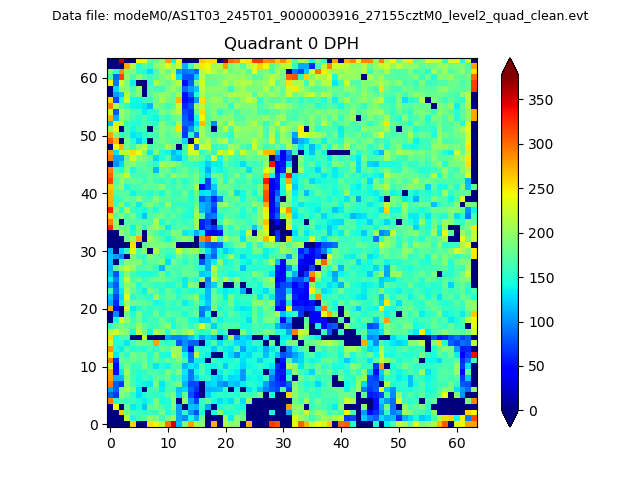 |
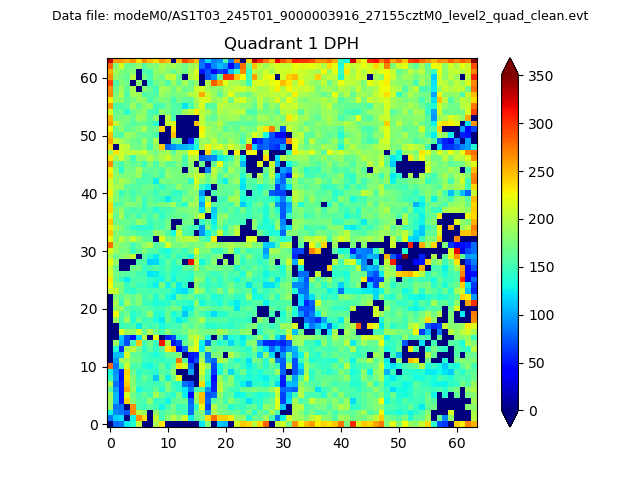 |
Quadrant B |
|---|---|---|---|
| Quadrant D | 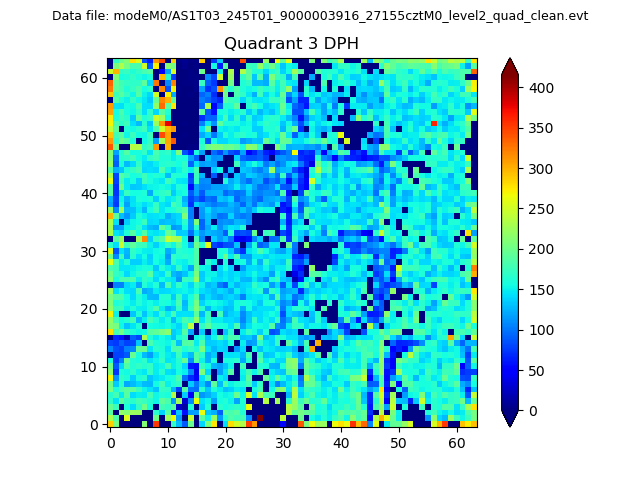 |
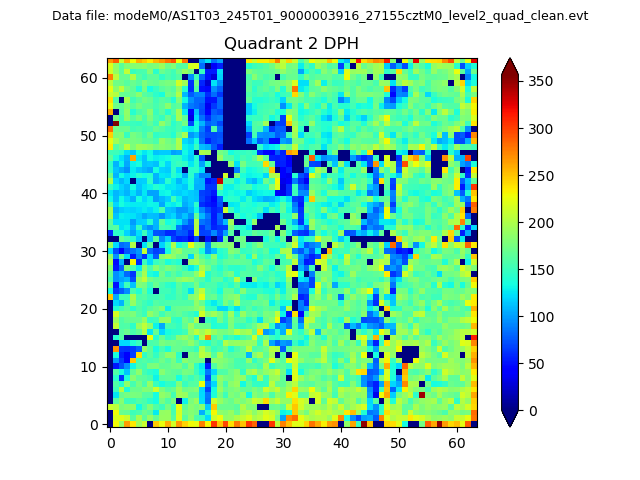 |
Quadrant C |
| Plot type | Count rate plots | Images |
|---|---|---|
| Comparison with Poisson distribution Blue bars denote a histogram of data divided into 1 sec bins. Red curve is a Poisson curve with rate = median count rate of data. |
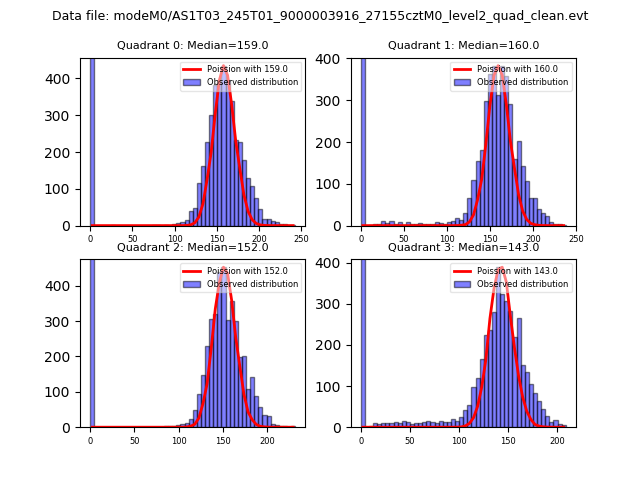 |
 |
| Quadrant-wise count rates Data is divided into 100 sec bins |
 |
|
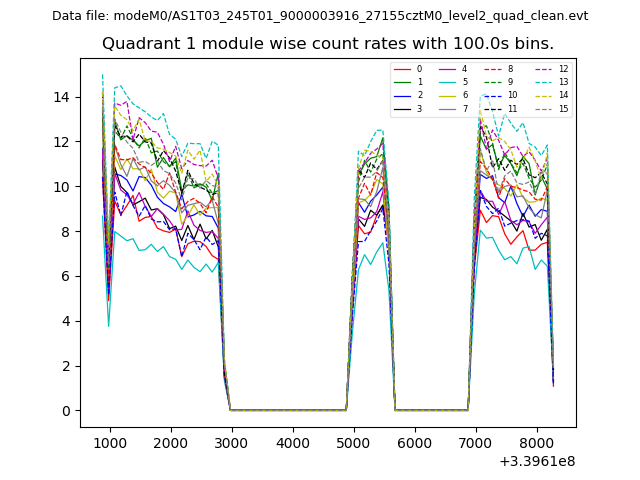
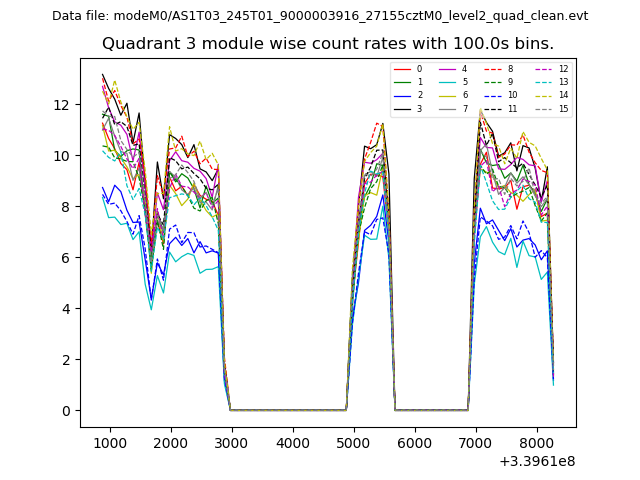
| Module-wise count rates for Quadrant A Data is divided into 100 sec bins |
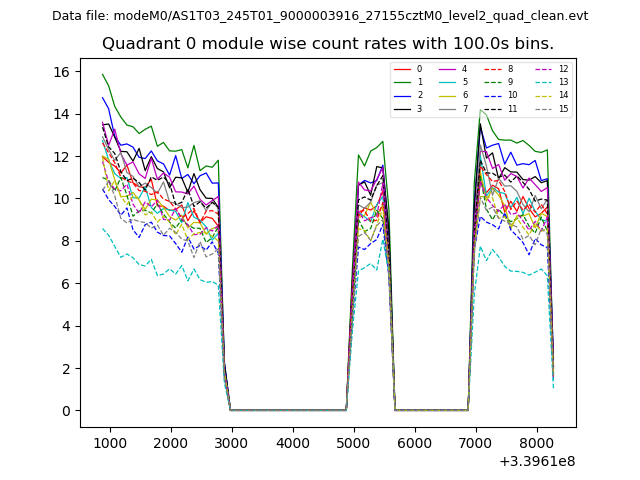 |
 |
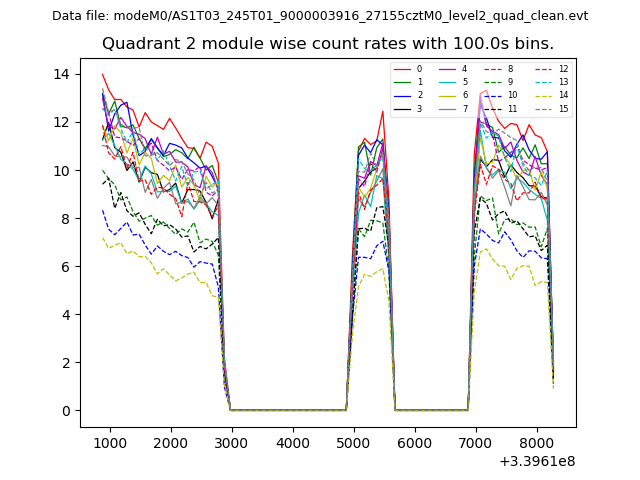
| Module-wise count rates for Quadrant B Data is divided into 100 sec bins |
 |
 |
| Module-wise count rates for Quadrant C Data is divided into 100 sec bins |
 |
 |
| Module-wise count rates for Quadrant D Data is divided into 100 sec bins |
 |
 |
| Parameter | Plot |
|---|---|
| CZT HV Monitor | 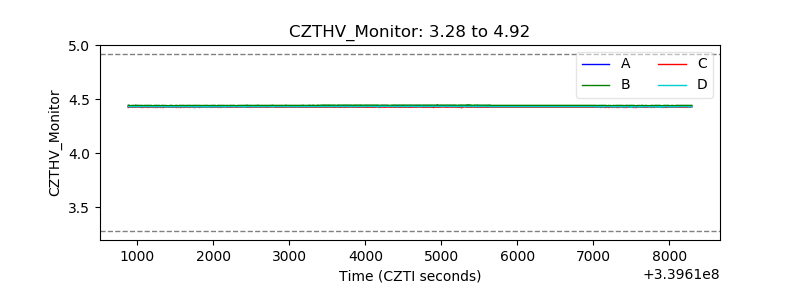 |
| D_VDD | 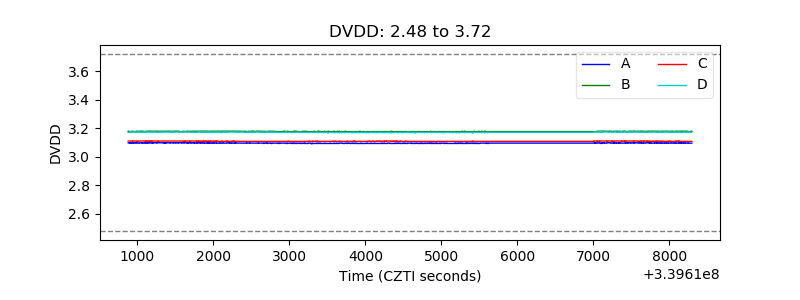 |
| Temperature 1 | 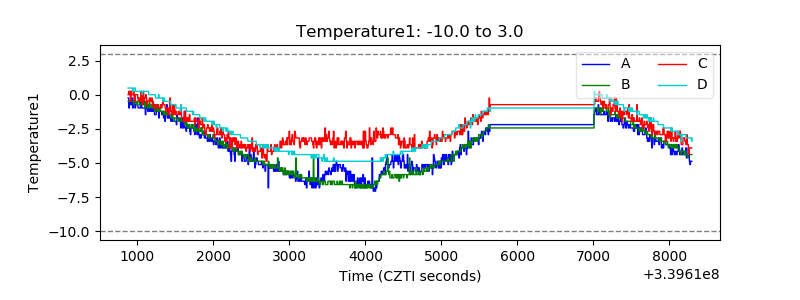 |
| Veto HV Monitor | 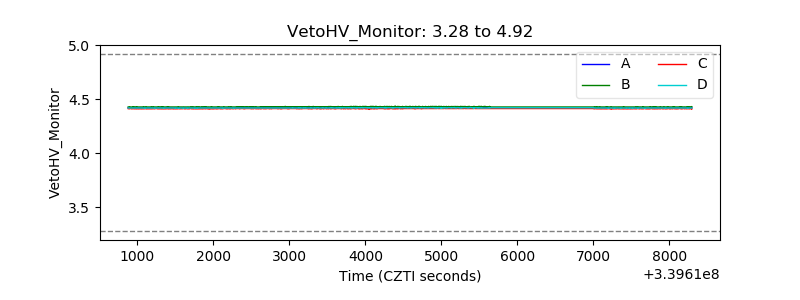 |
| Veto LLD | 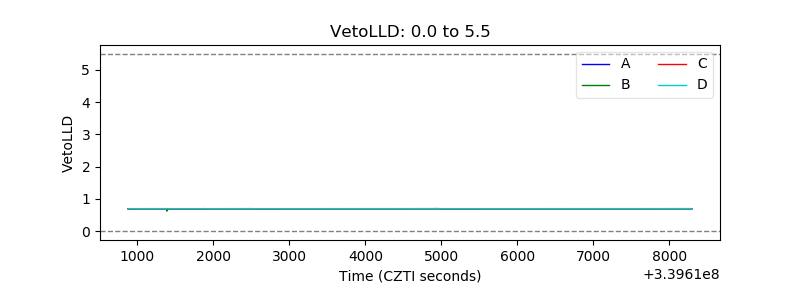 |
| Alpha Counter |  |
| _CPM_Rate | 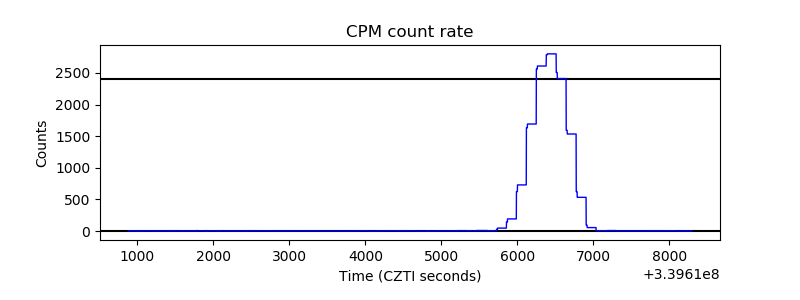 |
| CZT Counter | 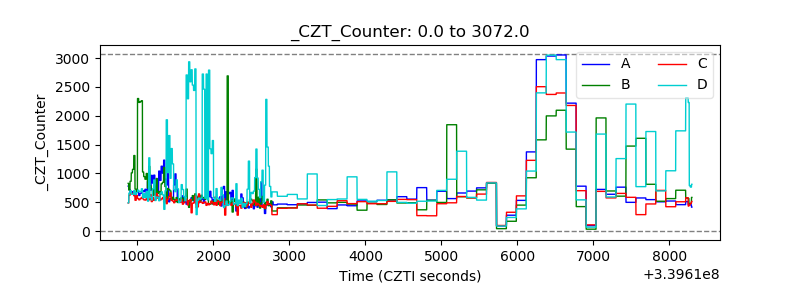 |
| +2.5 Volts monitor | 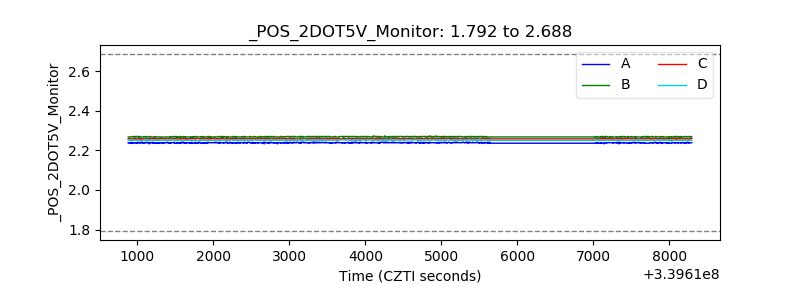 |
| +5 Volts monitor |  |
| _ROLL_ROT | 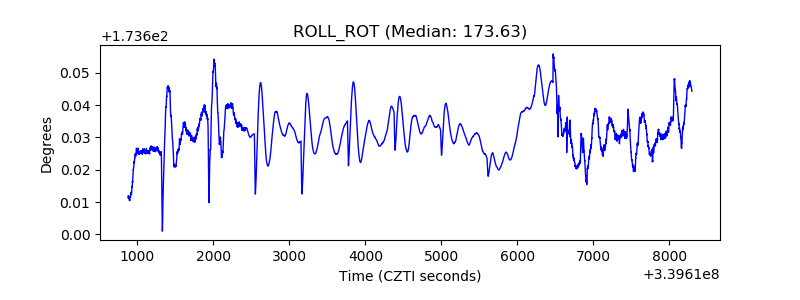 |
| _Roll_DEC | 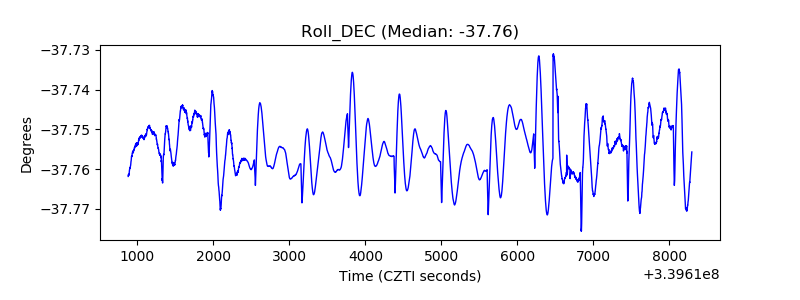 |
| _Roll_RA | 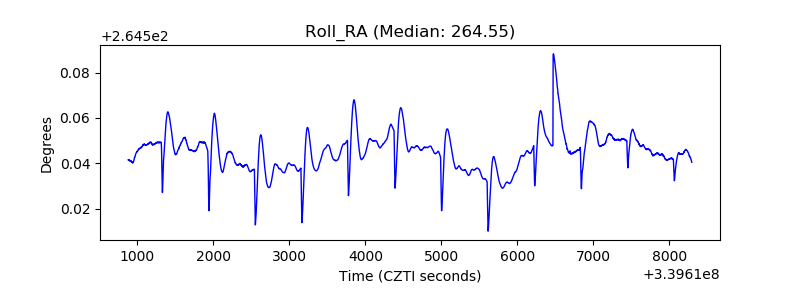 |
| Veto Counter | 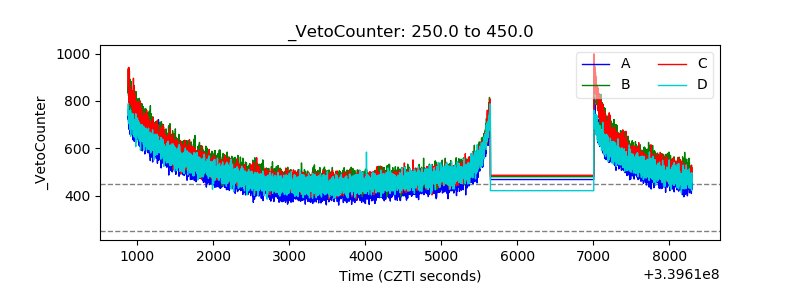 |