| Param | Original file | Final file |
|---|---|---|
| Filename | modeM0/AS1T03_245T01_9000003916_27156cztM0_level2.evt | modeM0/AS1T03_245T01_9000003916_27156cztM0_level2_quad_clean.evt |
| Size (bytes) | 556,133,760 | 95,757,120 |
| Size | 530.4 MB | 91.3 MB |
| Events in quadrant A | 3,407,160 | 632,811 |
| Events in quadrant B | 3,895,635 | 642,730 |
| Events in quadrant C | 3,222,989 | 613,488 |
| Events in quadrant D | 5,887,289 | 568,314 |
| Mode M0 | |||
|---|---|---|---|
| Quadrant | BADHDUFLAG | Total packets | Discarded packets |
| A | 0 | 14054 | 0 |
| B | 0 | 15526 | 0 |
| C | 0 | 13443 | 0 |
| D | 0 | 21865 | 0 |
| Mode M9 | |||
|---|---|---|---|
| Quadrant | BADHDUFLAG | Total packets | Discarded packets |
| A | 0 | 14 | 0 |
| B | 0 | 15 | 0 |
| C | 0 | 15 | 0 |
| D | 0 | 15 | 0 |
| Quadrant | Total seconds | Saturated seconds | Saturation percentage |
|---|---|---|---|
| A | 6338 | 50 | 0.788892% |
| B | 6338 | 173 | 2.729568% |
| C | 6338 | 77 | 1.214894% |
| D | 6338 | 380 | 5.995582% |
Noise dominated data is calculated using 1-second bins in cleaned event files. If a bin has >2000 counts, and if more than 50% of those come from <1% of pixels, then it is considered to be noise-dominated and hence unusable.
| Quadrant | # 1 sec bins | Bins with >0 counts | Bins with >2000 counts | High rate bins dominated by noise | Noise dominated (total time) | Noise dominated (detector-on time) | Marked lightcurve |
|---|---|---|---|---|---|---|---|
| A | 7613 | 6339 | 5 | 5 | 0.07% | 0.08% | 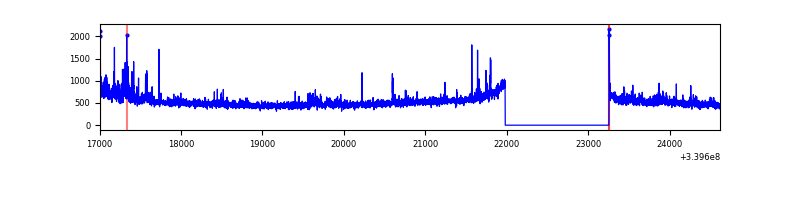 |
| B | 7613 | 6339 | 37 | 37 | 0.49% | 0.58% | 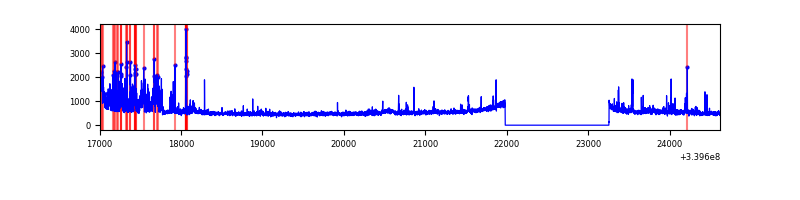 |
| C | 7613 | 6339 | 3 | 3 | 0.04% | 0.05% | 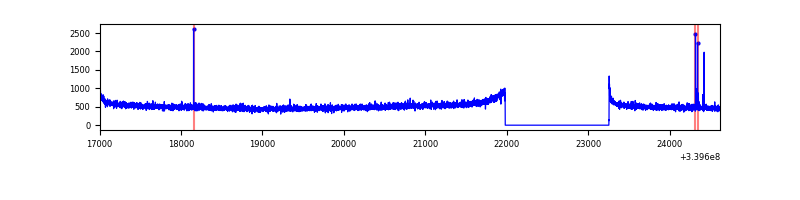 |
| D | 7613 | 6339 | 383 | 383 | 5.03% | 6.04% | 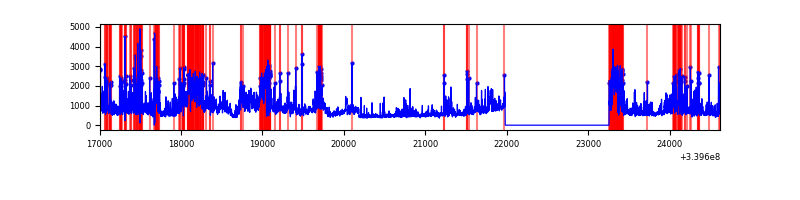 |
Top three noisy pixels from each quadrant. If the there are fewer than three noisy pixels in the level2.evt file, extra rows are filled as -1
| Pixel properties | Quadrant properties | ||||||
|---|---|---|---|---|---|---|---|
| Quadrant | DetID | PixID | Counts | Sigma | Mean | Median | Sigma |
| A | 0 | 13 | 180914 | 1091.74 | 825 | 810 | 165.0 |
| A | 14 | 235 | 30670 | 181.0 | 825 | 810 | 165.0 |
| A | 8 | 192 | 14017 | 80.06 | 825 | 810 | 165.0 |
| B | 15 | 33 | 315772 | 2032.41 | 826 | 807 | 155.0 |
| B | 3 | 112 | 175370 | 1126.42 | 826 | 807 | 155.0 |
| B | 5 | 172 | 45720 | 289.81 | 826 | 807 | 155.0 |
| C | 14 | 238 | 126569 | 680.13 | 788 | 793 | 184.9 |
| C | 15 | 208 | 18377 | 95.09 | 788 | 793 | 184.9 |
| C | 13 | 61 | 5410 | 24.97 | 788 | 793 | 184.9 |
| D | 1 | 52 | 2018857 | 9974.95 | 764 | 750 | 202.3 |
| D | 7 | 38 | 498116 | 2458.34 | 764 | 750 | 202.3 |
| D | 2 | 250 | 188751 | 929.24 | 764 | 750 | 202.3 |
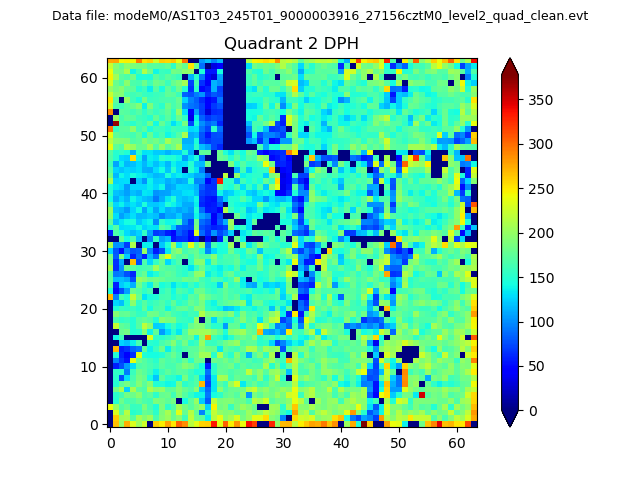
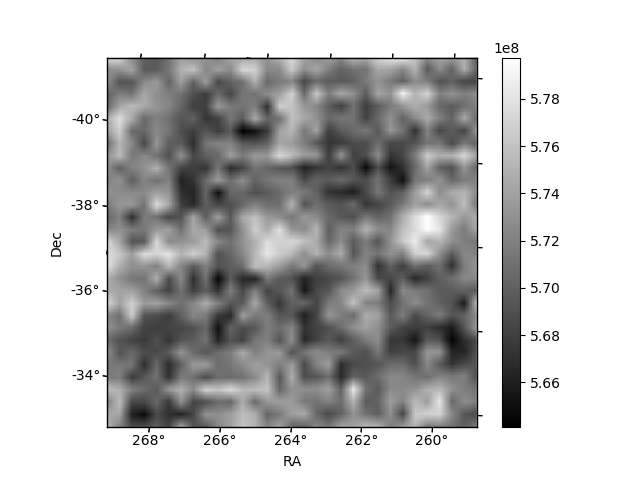
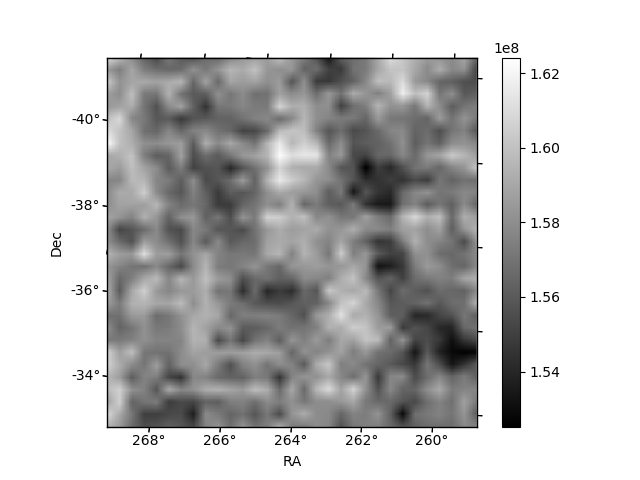
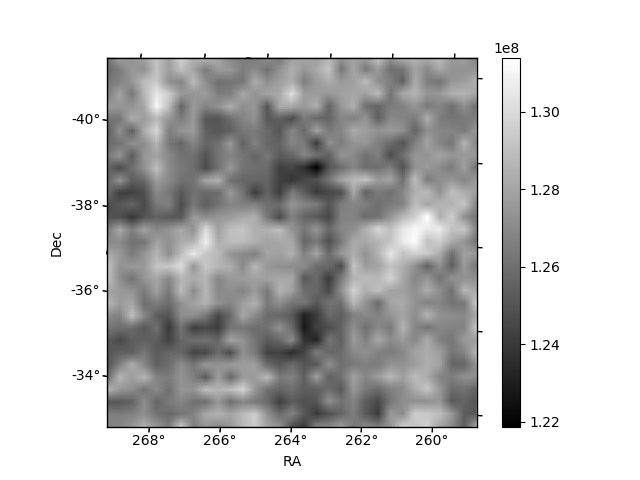
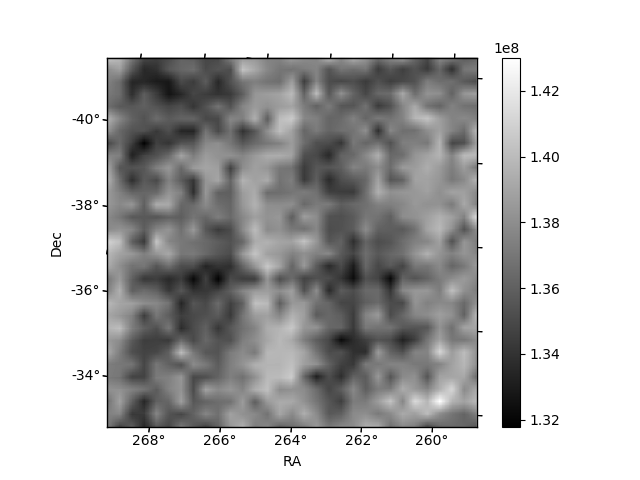
Histogram calculated using DETX and DETY for each event in the final _common_clean file
| Quadrant A | 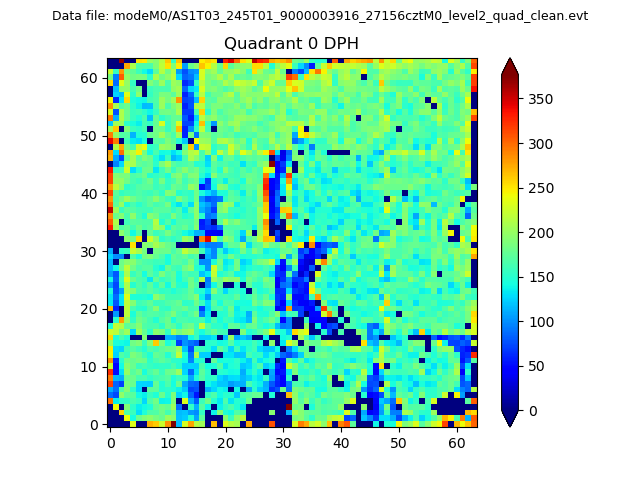 |
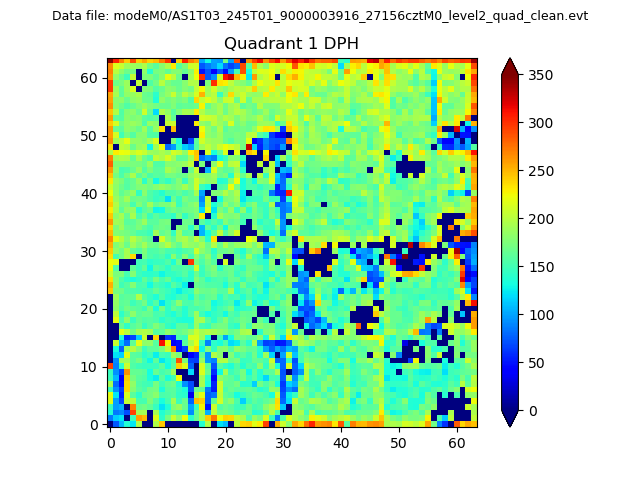 |
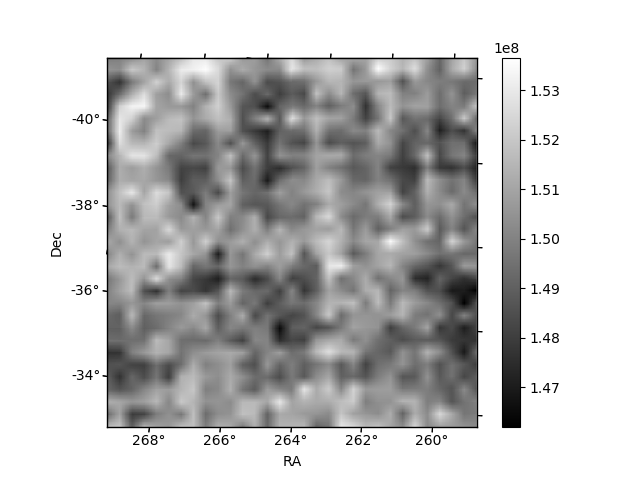
Quadrant B |
|---|---|---|---|
| Quadrant D | 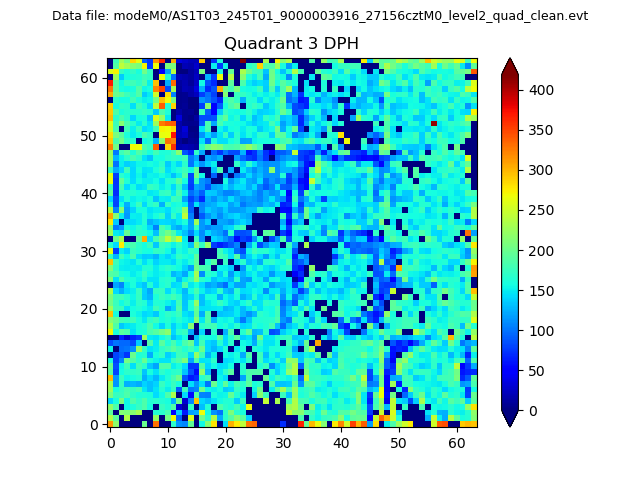 |
 |
Quadrant C |
| Plot type | Count rate plots | Images |
|---|---|---|
| Comparison with Poisson distribution Blue bars denote a histogram of data divided into 1 sec bins. Red curve is a Poisson curve with rate = median count rate of data. |
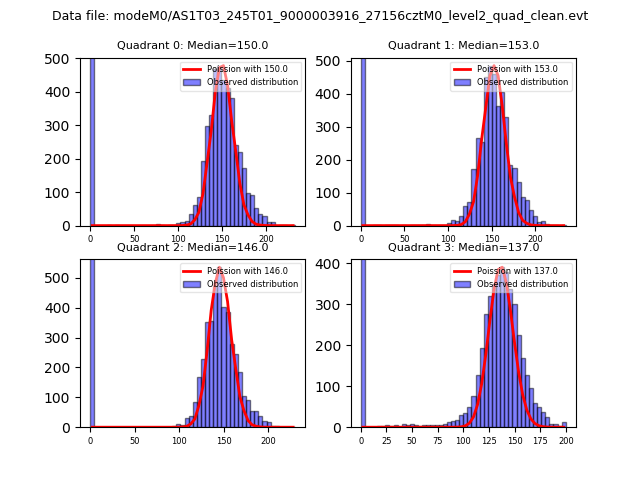 |
 |
| Quadrant-wise count rates Data is divided into 100 sec bins |
 |
|
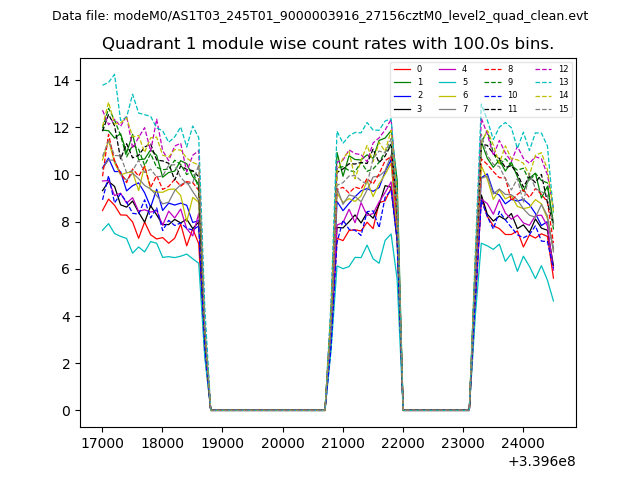
| Module-wise count rates for Quadrant A Data is divided into 100 sec bins |
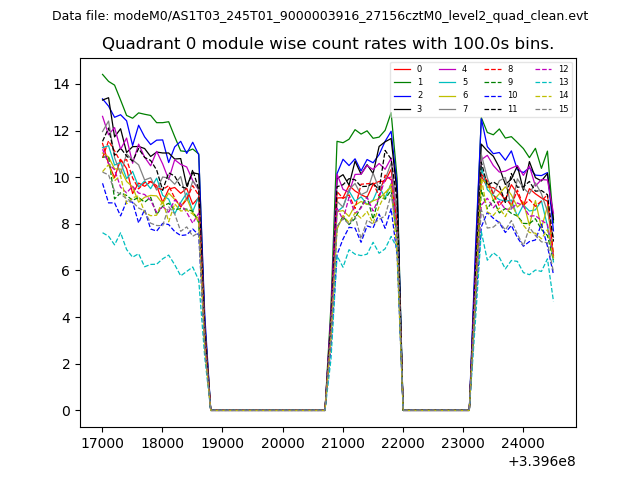 |
 |
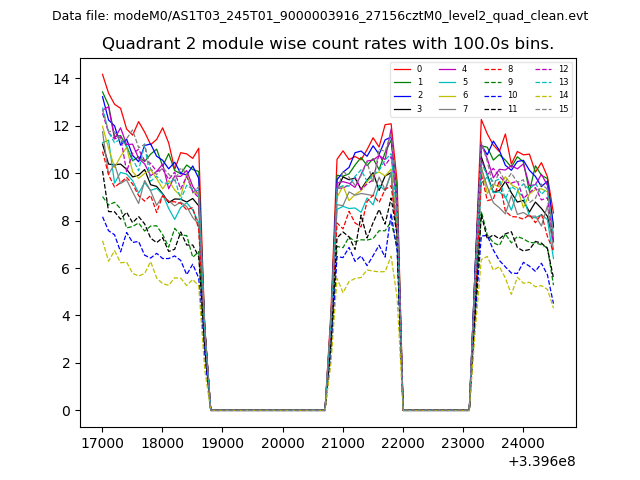
| Module-wise count rates for Quadrant B Data is divided into 100 sec bins |
 |
 |
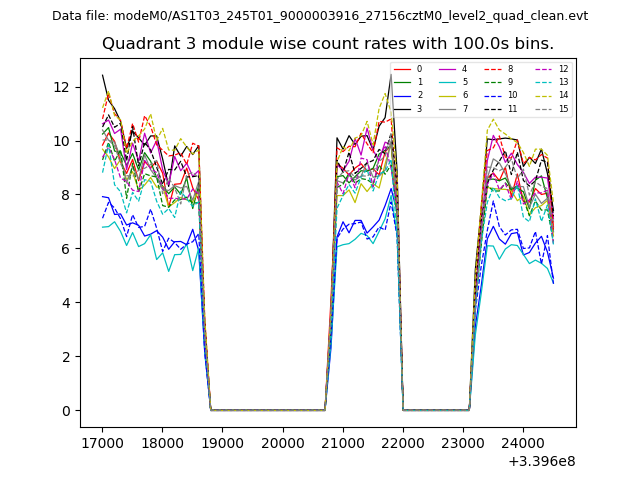
| Module-wise count rates for Quadrant C Data is divided into 100 sec bins |
 |
 |
| Module-wise count rates for Quadrant D Data is divided into 100 sec bins |
 |
 |
| Parameter | Plot |
|---|---|
| CZT HV Monitor | 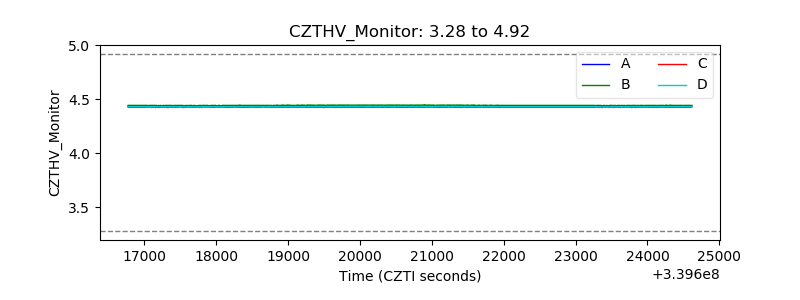 |
| D_VDD | 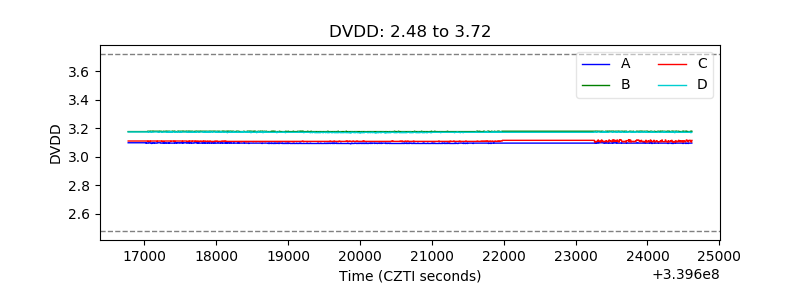 |
| Temperature 1 | 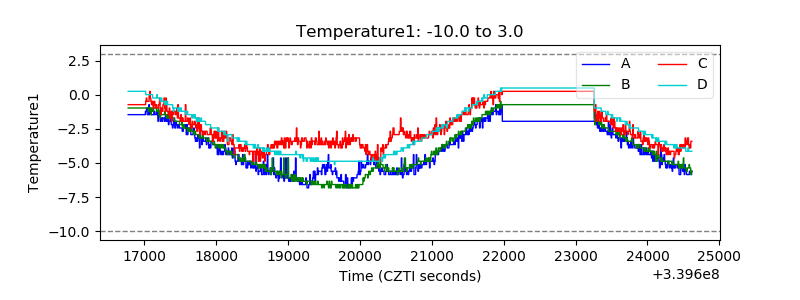 |
| Veto HV Monitor |  |
| Veto LLD | 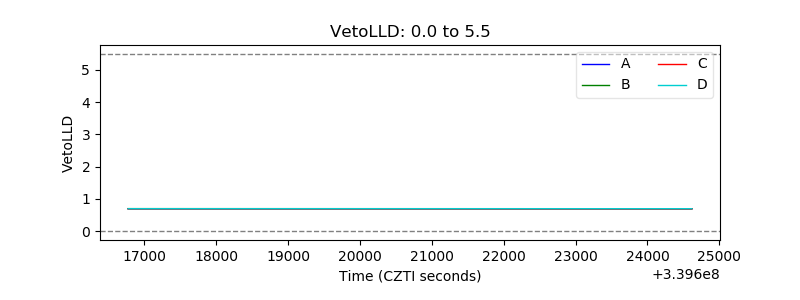 |
| Alpha Counter |  |
| _CPM_Rate | 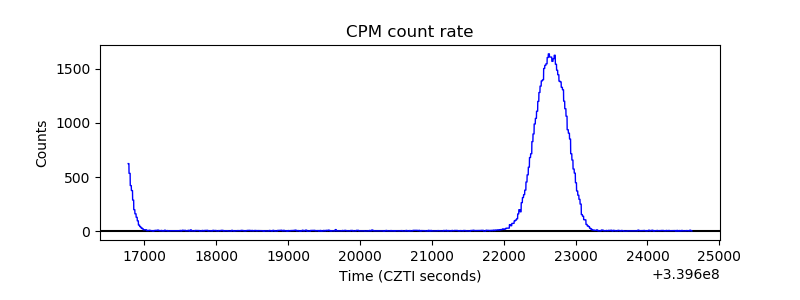 |
| CZT Counter | 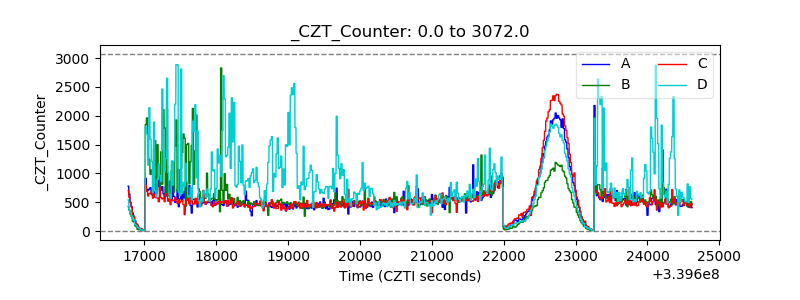 |
| +2.5 Volts monitor |  |
| +5 Volts monitor |  |
| _ROLL_ROT | 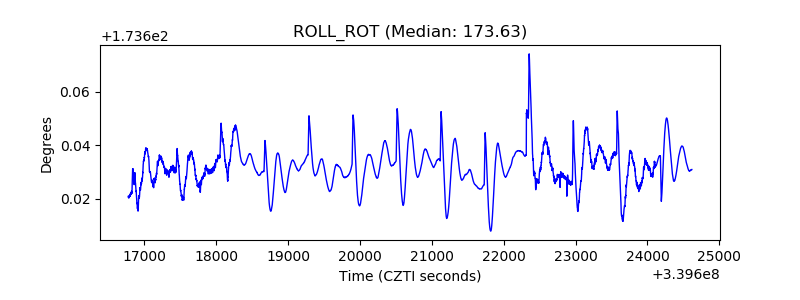 |
| _Roll_DEC | 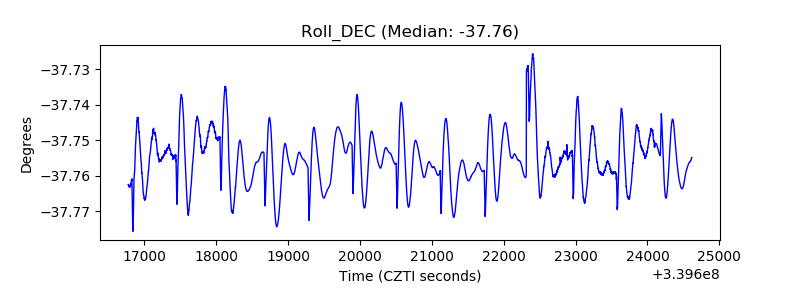 |
| _Roll_RA | 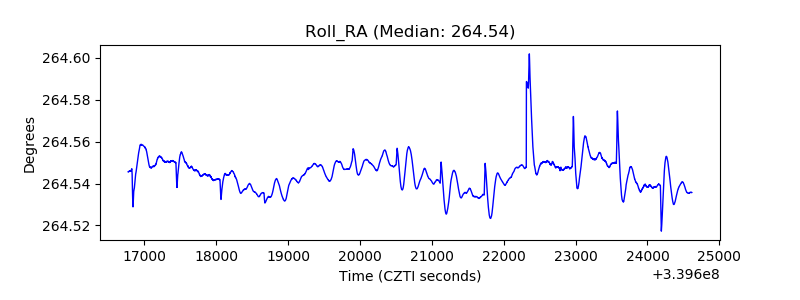 |
| Veto Counter | 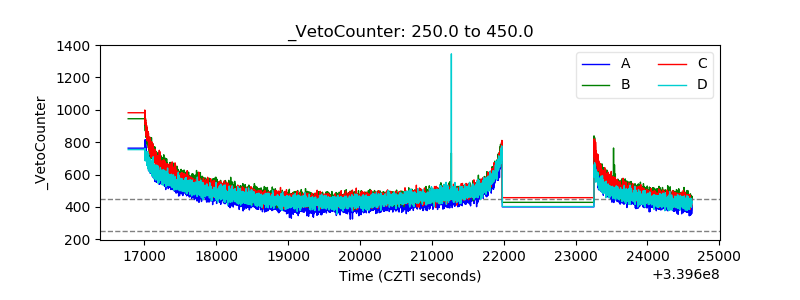 |