| Param | Original file | Final file |
|---|---|---|
| Filename | modeM0/AS1T03_245T01_9000003916_27157cztM0_level2.evt | modeM0/AS1T03_245T01_9000003916_27157cztM0_level2_quad_clean.evt |
| Size (bytes) | 520,554,240 | 89,556,480 |
| Size | 496.4 MB | 85.4 MB |
| Events in quadrant A | 3,588,888 | 576,291 |
| Events in quadrant B | 3,670,002 | 588,760 |
| Events in quadrant C | 3,257,703 | 561,302 |
| Events in quadrant D | 4,804,130 | 528,558 |
| Mode M0 | |||
|---|---|---|---|
| Quadrant | BADHDUFLAG | Total packets | Discarded packets |
| A | 0 | 14713 | 0 |
| B | 0 | 15083 | 0 |
| C | 0 | 13650 | 0 |
| D | 0 | 18774 | 0 |
| Mode M9 | |||
|---|---|---|---|
| Quadrant | BADHDUFLAG | Total packets | Discarded packets |
| A | 0 | 10 | 0 |
| B | 0 | 10 | 0 |
| C | 0 | 10 | 0 |
| D | 0 | 10 | 0 |
| Quadrant | Total seconds | Saturated seconds | Saturation percentage |
|---|---|---|---|
| A | 6549 | 56 | 0.855092% |
| B | 6550 | 75 | 1.145038% |
| C | 6550 | 67 | 1.022901% |
| D | 6550 | 269 | 4.106870% |
Noise dominated data is calculated using 1-second bins in cleaned event files. If a bin has >2000 counts, and if more than 50% of those come from <1% of pixels, then it is considered to be noise-dominated and hence unusable.
| Quadrant | # 1 sec bins | Bins with >0 counts | Bins with >2000 counts | High rate bins dominated by noise | Noise dominated (total time) | Noise dominated (detector-on time) | Marked lightcurve |
|---|---|---|---|---|---|---|---|
| A | 7539 | 6550 | 31 | 31 | 0.41% | 0.47% | 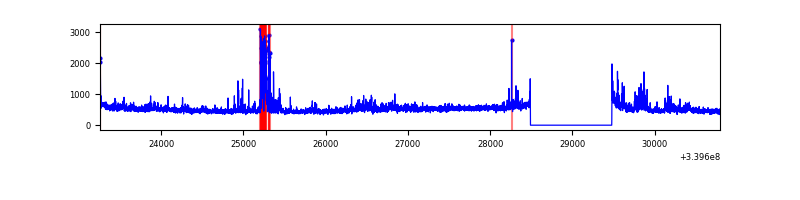 |
| B | 7540 | 6551 | 9 | 9 | 0.12% | 0.14% | 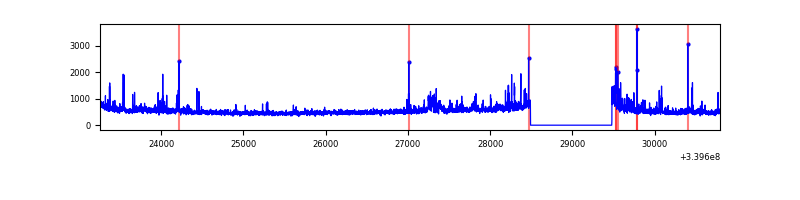 |
| C | 7540 | 6551 | 7 | 7 | 0.09% | 0.11% | 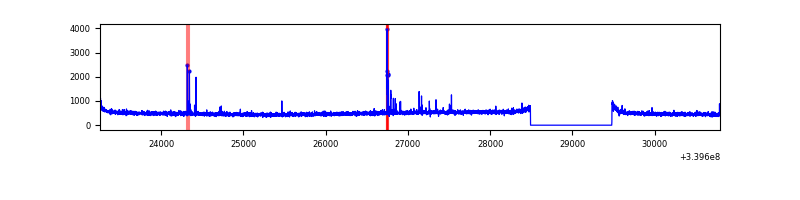 |
| D | 7540 | 6551 | 215 | 215 | 2.85% | 3.28% | 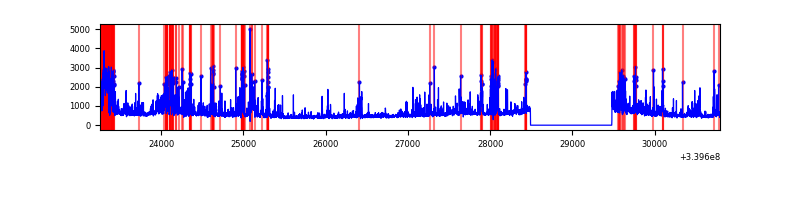 |
Top three noisy pixels from each quadrant. If the there are fewer than three noisy pixels in the level2.evt file, extra rows are filled as -1
| Pixel properties | Quadrant properties | ||||||
|---|---|---|---|---|---|---|---|
| Quadrant | DetID | PixID | Counts | Sigma | Mean | Median | Sigma |
| A | 0 | 13 | 239597 | 1454.69 | 820 | 803 | 164.2 |
| A | 14 | 235 | 160561 | 973.22 | 820 | 803 | 164.2 |
| A | 8 | 192 | 14246 | 81.89 | 820 | 803 | 164.2 |
| B | 3 | 112 | 150525 | 962.53 | 823 | 802 | 155.6 |
| B | 0 | 189 | 115943 | 740.21 | 823 | 802 | 155.6 |
| B | 15 | 32 | 66633 | 423.21 | 823 | 802 | 155.6 |
| C | 14 | 238 | 125907 | 677.3 | 786 | 791 | 184.7 |
| C | 15 | 208 | 50085 | 266.85 | 786 | 791 | 184.7 |
| C | 13 | 61 | 5438 | 25.16 | 786 | 791 | 184.7 |
| D | 1 | 52 | 831933 | 4053.1 | 768 | 755 | 205.1 |
| D | 7 | 38 | 448912 | 2185.36 | 768 | 755 | 205.1 |
| D | 13 | 172 | 222115 | 1079.42 | 768 | 755 | 205.1 |
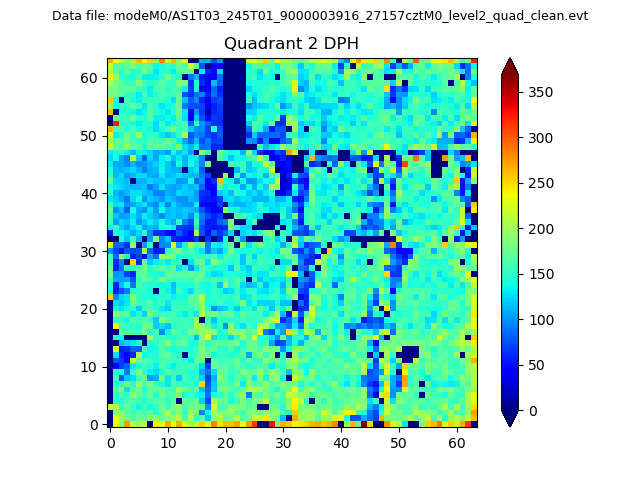
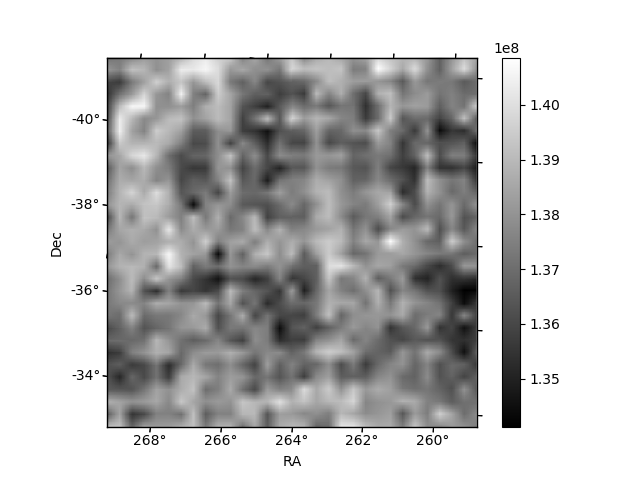
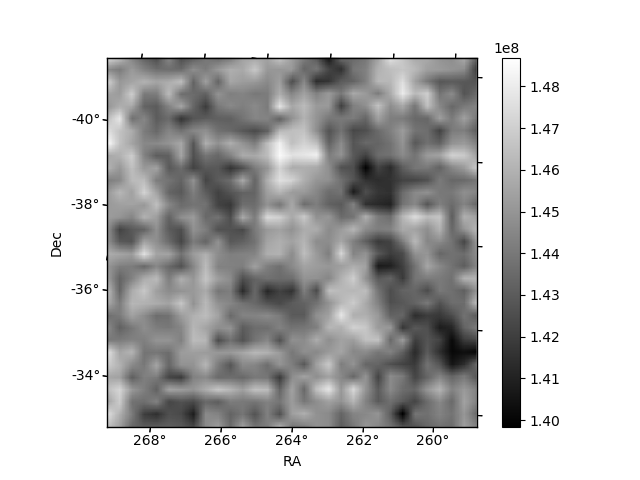
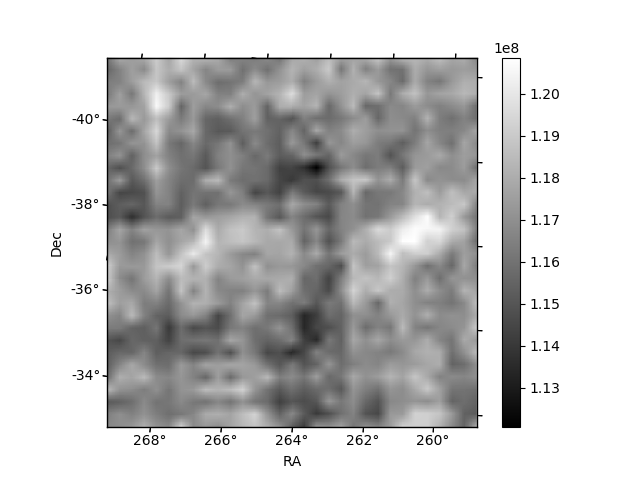
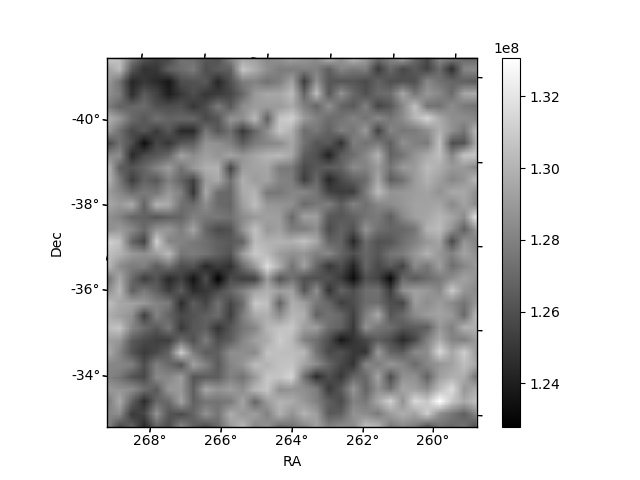
Histogram calculated using DETX and DETY for each event in the final _common_clean file
| Quadrant A |  |
 |
Quadrant B |
|---|---|---|---|
| Quadrant D | 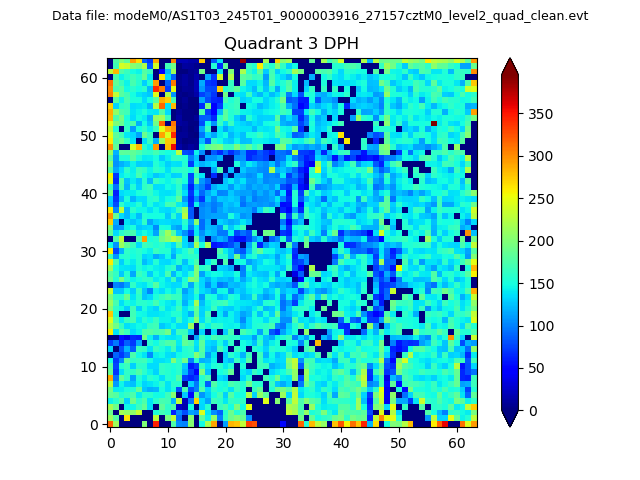 |
 |
Quadrant C |
| Plot type | Count rate plots | Images |
|---|---|---|
| Comparison with Poisson distribution Blue bars denote a histogram of data divided into 1 sec bins. Red curve is a Poisson curve with rate = median count rate of data. |
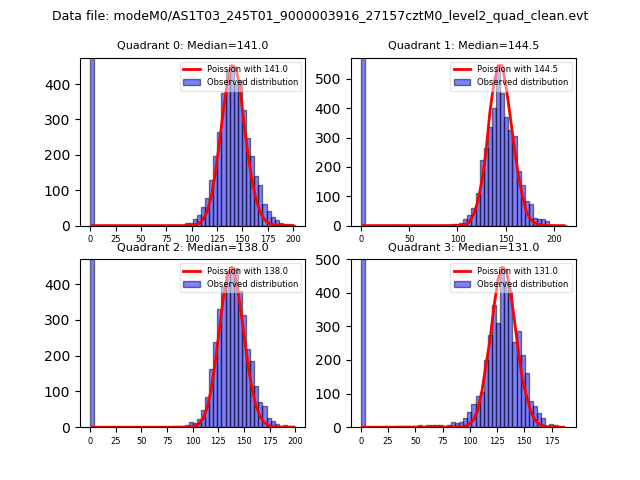 |
 |
| Quadrant-wise count rates Data is divided into 100 sec bins |
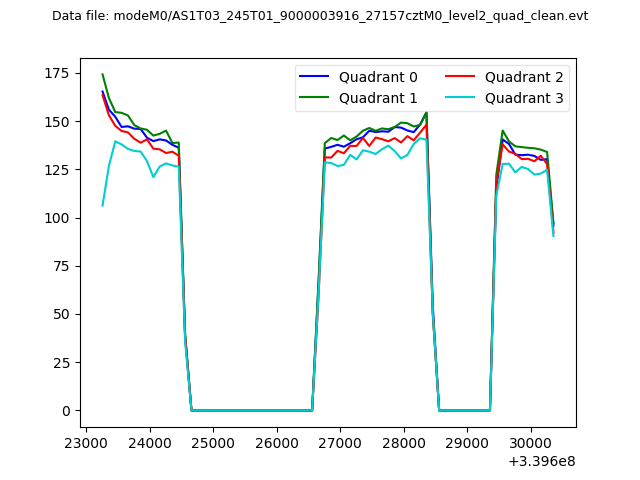 |
|
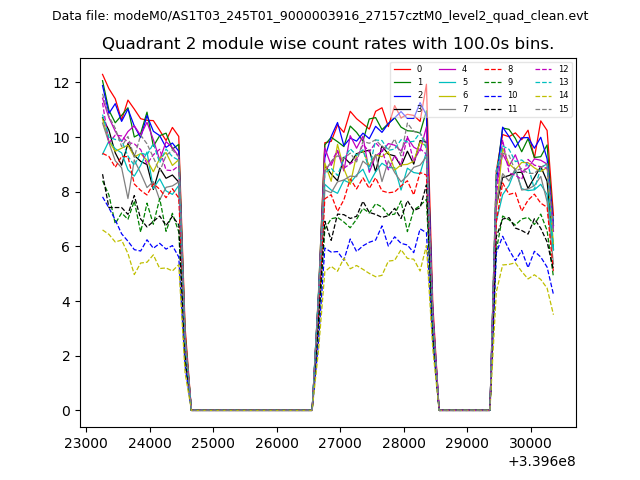
| Module-wise count rates for Quadrant A Data is divided into 100 sec bins |
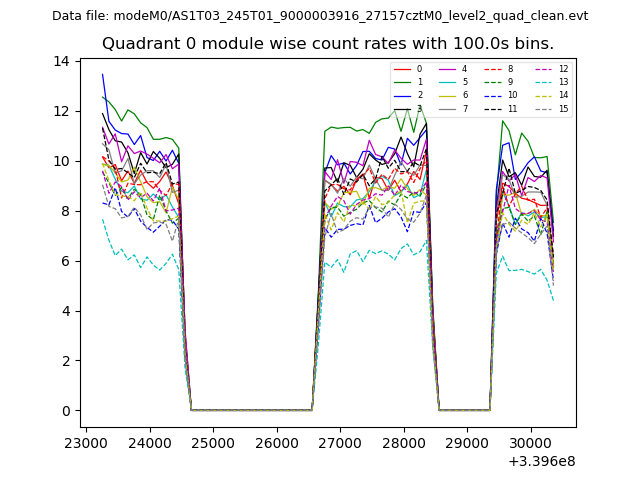 |
 |
| Module-wise count rates for Quadrant B Data is divided into 100 sec bins |
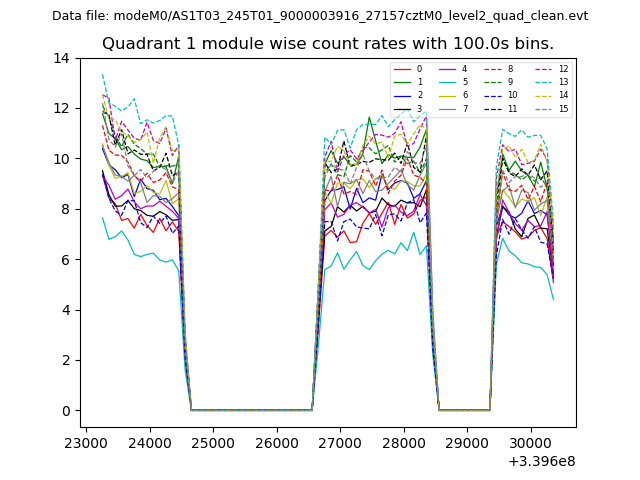 |
 |
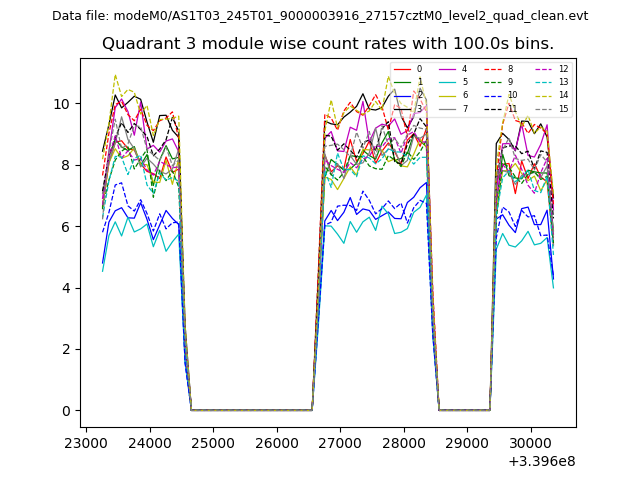
| Module-wise count rates for Quadrant C Data is divided into 100 sec bins |
 |
 |
| Module-wise count rates for Quadrant D Data is divided into 100 sec bins |
 |
 |
| Parameter | Plot |
|---|---|
| CZT HV Monitor | 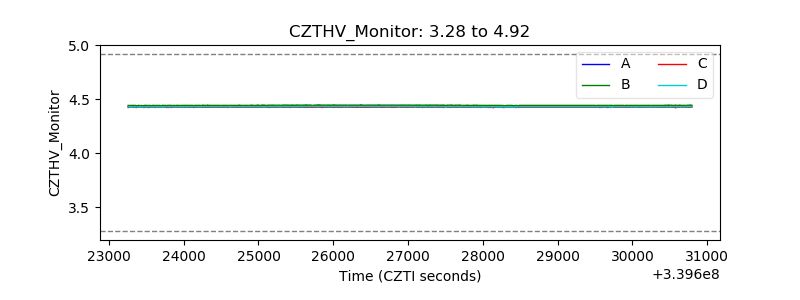 |
| D_VDD | 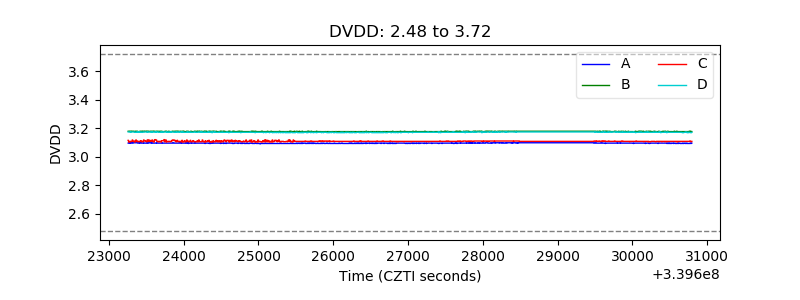 |
| Temperature 1 | 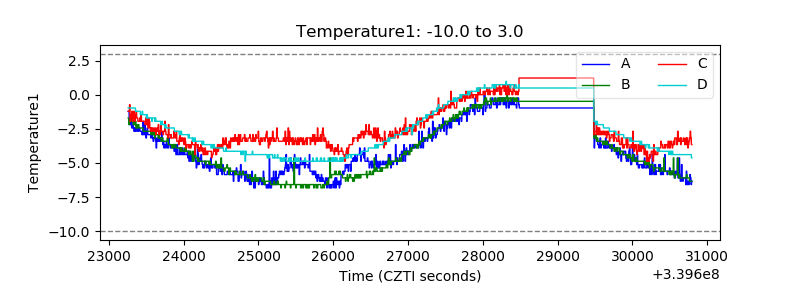 |
| Veto HV Monitor |  |
| Veto LLD | 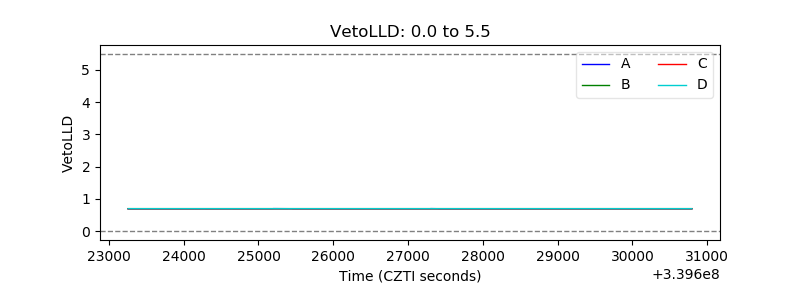 |
| Alpha Counter | 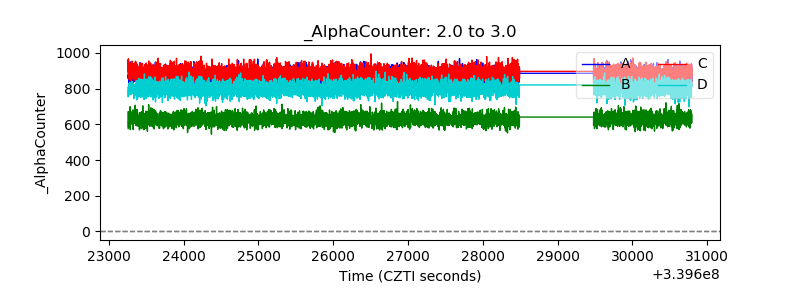 |
| _CPM_Rate |  |
| CZT Counter | 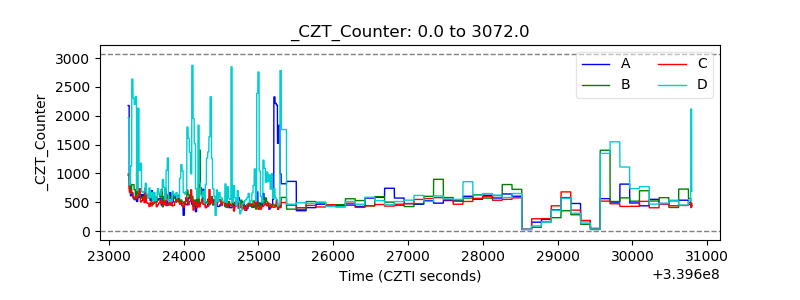 |
| +2.5 Volts monitor |  |
| +5 Volts monitor |  |
| _ROLL_ROT | 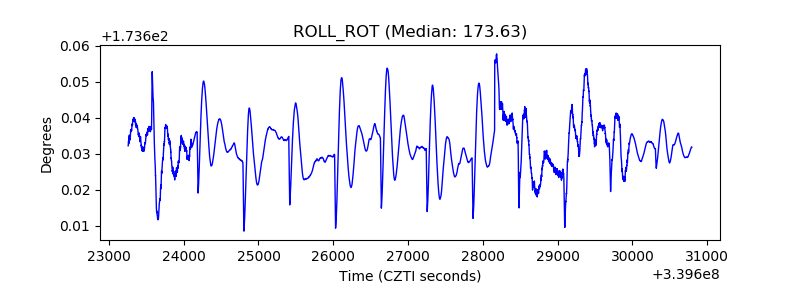 |
| _Roll_DEC |  |
| _Roll_RA | 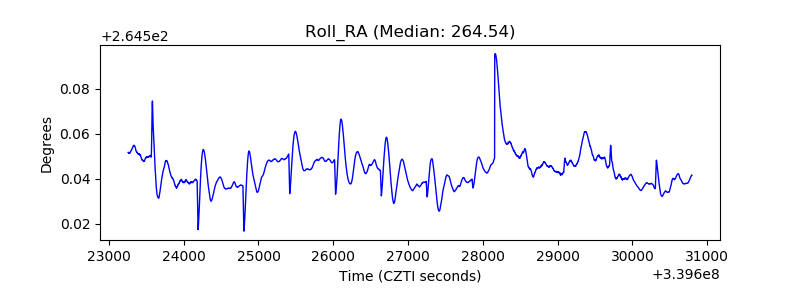 |
| Veto Counter | 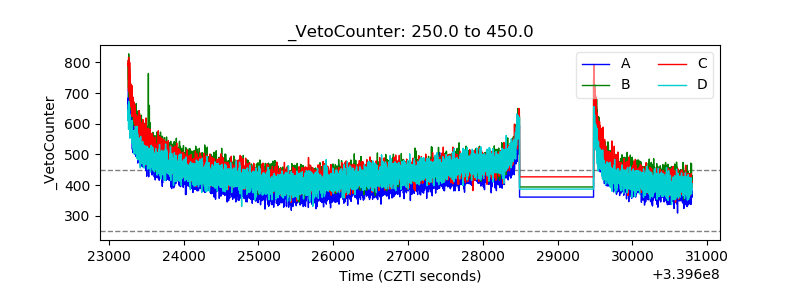 |