| Param | Original file | Final file |
|---|---|---|
| Filename | modeM0/AS1T03_245T01_9000003916_27158cztM0_level2.evt | modeM0/AS1T03_245T01_9000003916_27158cztM0_level2_quad_clean.evt |
| Size (bytes) | 516,303,360 | 87,575,040 |
| Size | 492.4 MB | 83.5 MB |
| Events in quadrant A | 3,613,772 | 549,510 |
| Events in quadrant B | 3,822,551 | 558,566 |
| Events in quadrant C | 3,310,021 | 539,729 |
| Events in quadrant D | 4,420,331 | 521,838 |
| Mode M0 | |||
|---|---|---|---|
| Quadrant | BADHDUFLAG | Total packets | Discarded packets |
| A | 0 | 15018 | 0 |
| B | 0 | 15706 | 0 |
| C | 0 | 14173 | 0 |
| D | 0 | 17726 | 0 |
| Mode M9 | |||
|---|---|---|---|
| Quadrant | BADHDUFLAG | Total packets | Discarded packets |
| A | 0 | 13 | 0 |
| B | 0 | 14 | 0 |
| C | 0 | 14 | 0 |
| D | 0 | 14 | 0 |
| Quadrant | Total seconds | Saturated seconds | Saturation percentage |
|---|---|---|---|
| A | 6924 | 39 | 0.563258% |
| B | 6924 | 76 | 1.097631% |
| C | 6924 | 52 | 0.751011% |
| D | 6924 | 115 | 1.660890% |
Noise dominated data is calculated using 1-second bins in cleaned event files. If a bin has >2000 counts, and if more than 50% of those come from <1% of pixels, then it is considered to be noise-dominated and hence unusable.
| Quadrant | # 1 sec bins | Bins with >0 counts | Bins with >2000 counts | High rate bins dominated by noise | Noise dominated (total time) | Noise dominated (detector-on time) | Marked lightcurve |
|---|---|---|---|---|---|---|---|
| A | 7544 | 6925 | 10 | 10 | 0.13% | 0.14% | 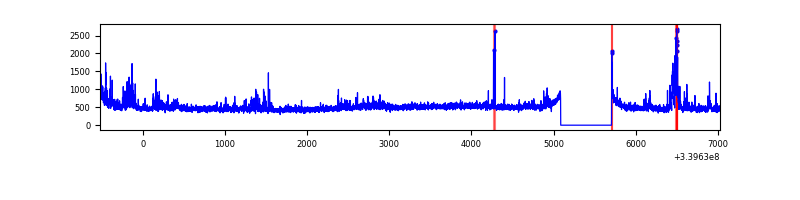 |
| B | 7544 | 6925 | 17 | 17 | 0.23% | 0.25% | 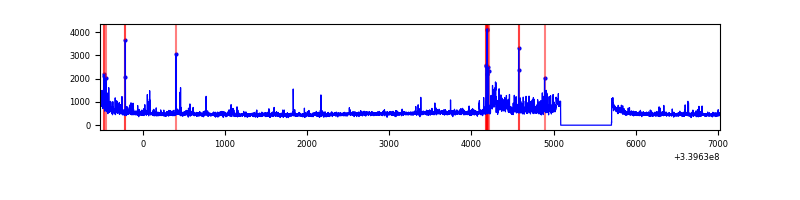 |
| C | 7544 | 6925 | 0 | 0 | 0.00% | 0.00% | 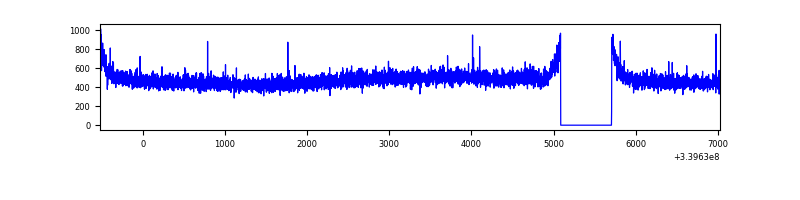 |
| D | 7544 | 6925 | 82 | 82 | 1.09% | 1.18% | 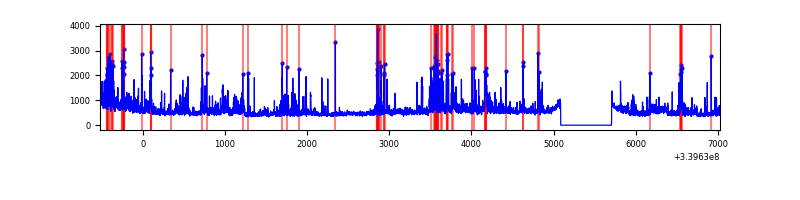 |
Top three noisy pixels from each quadrant. If the there are fewer than three noisy pixels in the level2.evt file, extra rows are filled as -1
| Pixel properties | Quadrant properties | ||||||
|---|---|---|---|---|---|---|---|
| Quadrant | DetID | PixID | Counts | Sigma | Mean | Median | Sigma |
| A | 0 | 13 | 213938 | 1244.28 | 850 | 833 | 171.3 |
| A | 15 | 174 | 72457 | 418.2 | 850 | 833 | 171.3 |
| A | 13 | 248 | 15904 | 87.99 | 850 | 833 | 171.3 |
| B | 15 | 33 | 168156 | 1029.24 | 850 | 829 | 162.6 |
| B | 3 | 112 | 121541 | 742.51 | 850 | 829 | 162.6 |
| B | 5 | 172 | 48523 | 293.37 | 850 | 829 | 162.6 |
| C | 14 | 238 | 129728 | 669.24 | 814 | 816 | 192.6 |
| C | 13 | 61 | 5665 | 25.17 | 814 | 816 | 192.6 |
| C | 15 | 208 | 5207 | 22.8 | 814 | 816 | 192.6 |
| D | 1 | 52 | 763842 | 3606.49 | 808 | 793 | 211.6 |
| D | 2 | 250 | 194445 | 915.28 | 808 | 793 | 211.6 |
| D | 13 | 172 | 136364 | 640.77 | 808 | 793 | 211.6 |
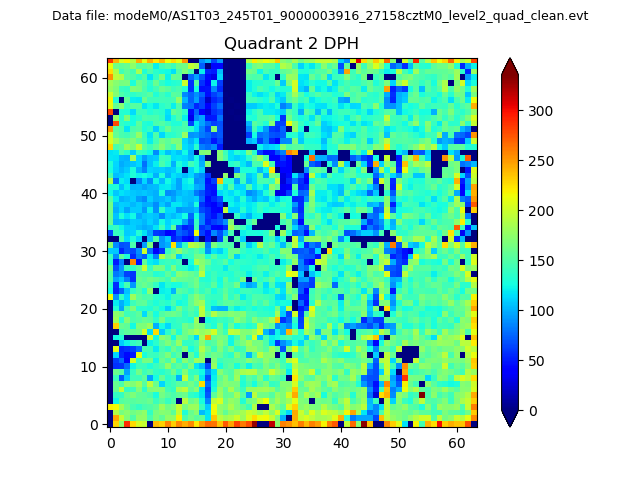
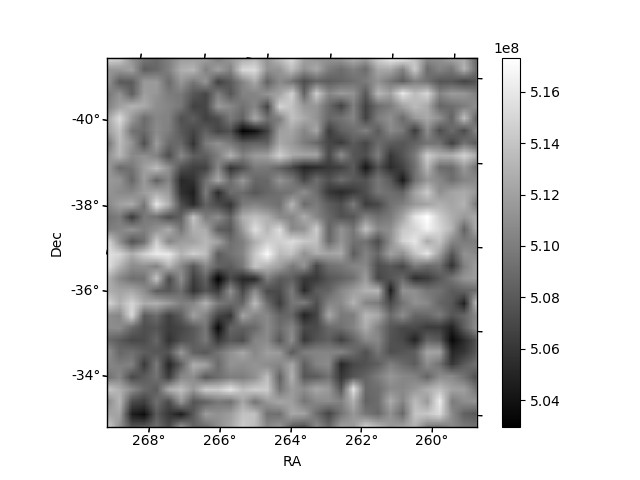
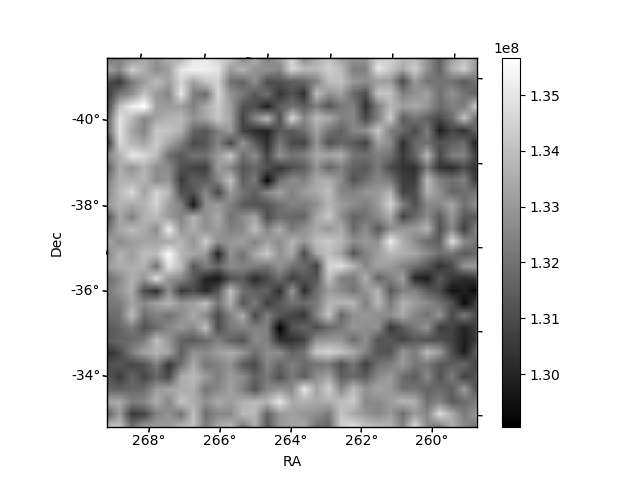
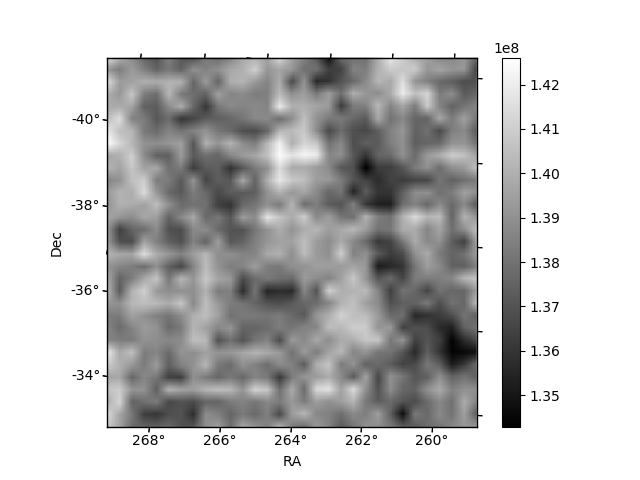
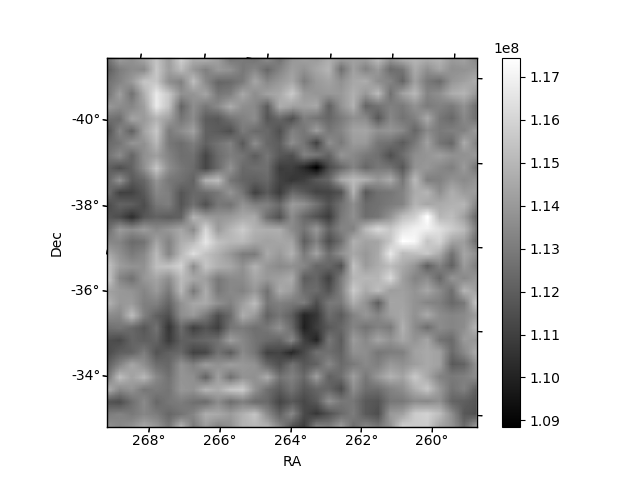
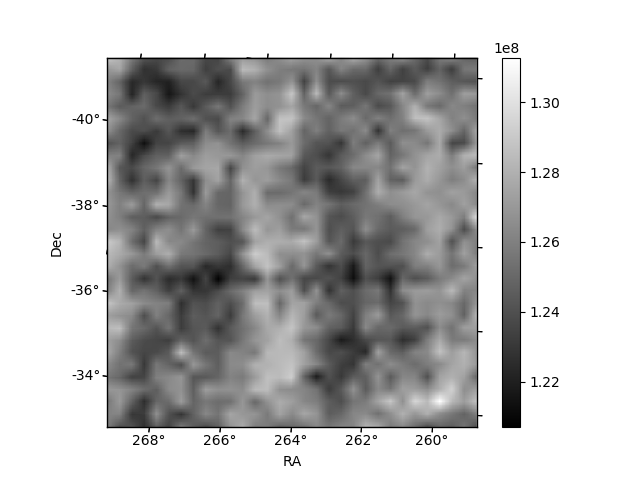
Histogram calculated using DETX and DETY for each event in the final _common_clean file
| Quadrant A | 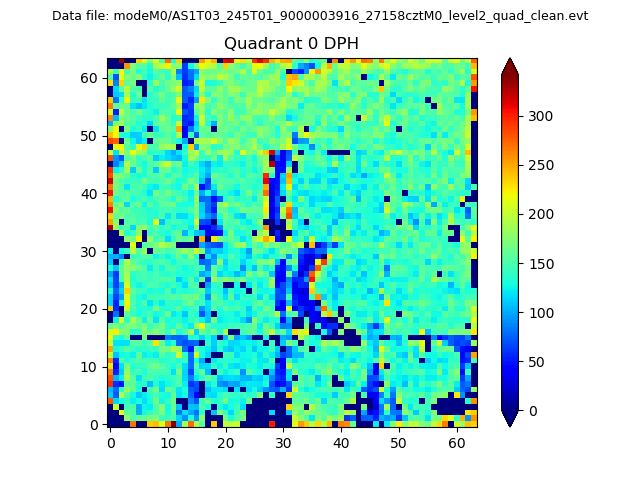 |
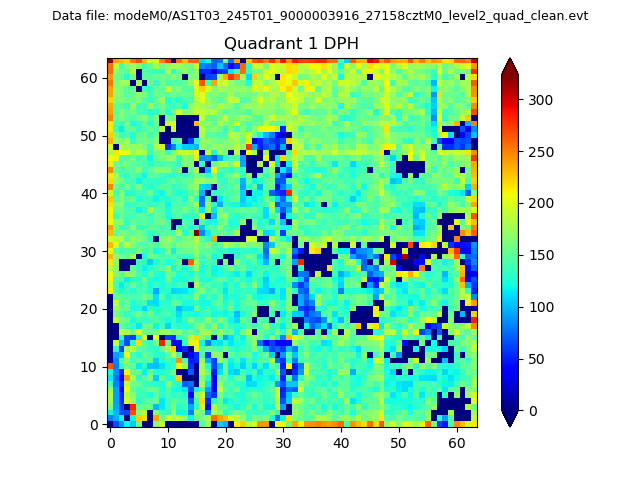 |
Quadrant B |
|---|---|---|---|
| Quadrant D | 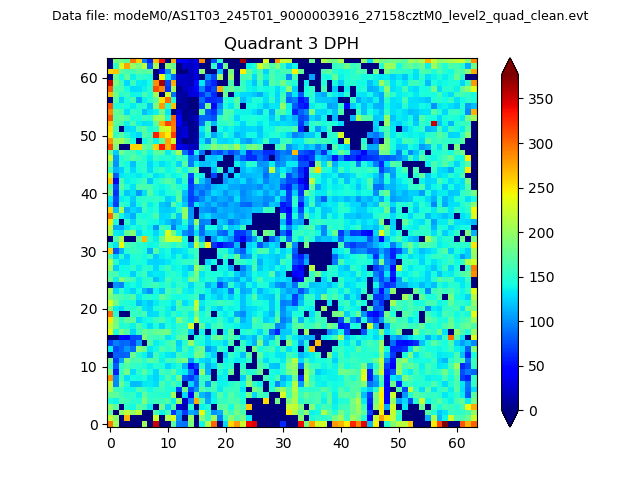 |
 |
Quadrant C |
| Plot type | Count rate plots | Images |
|---|---|---|
| Comparison with Poisson distribution Blue bars denote a histogram of data divided into 1 sec bins. Red curve is a Poisson curve with rate = median count rate of data. |
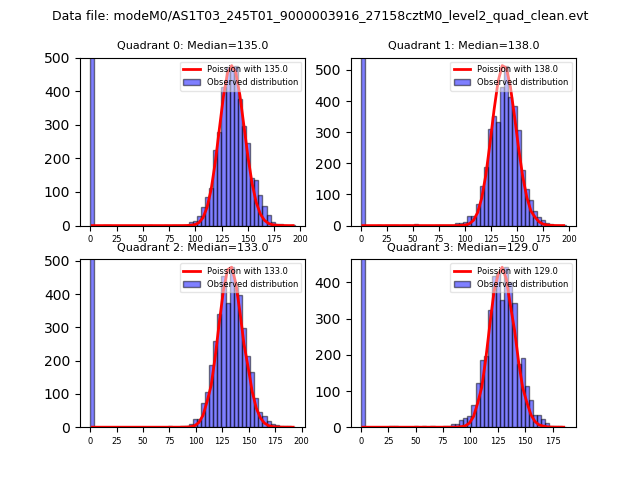 |
 |
| Quadrant-wise count rates Data is divided into 100 sec bins |
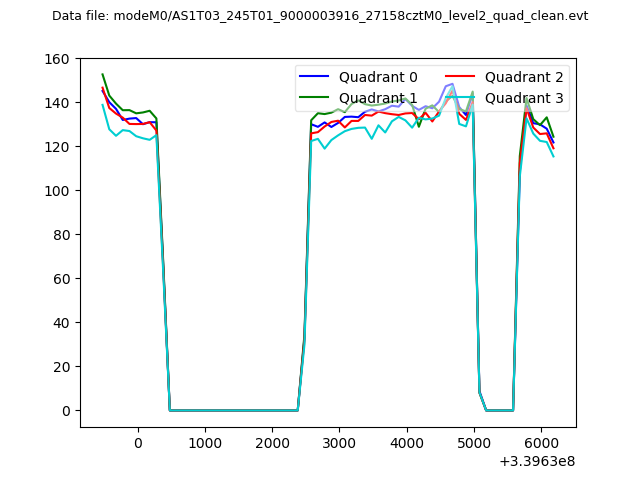 |
|
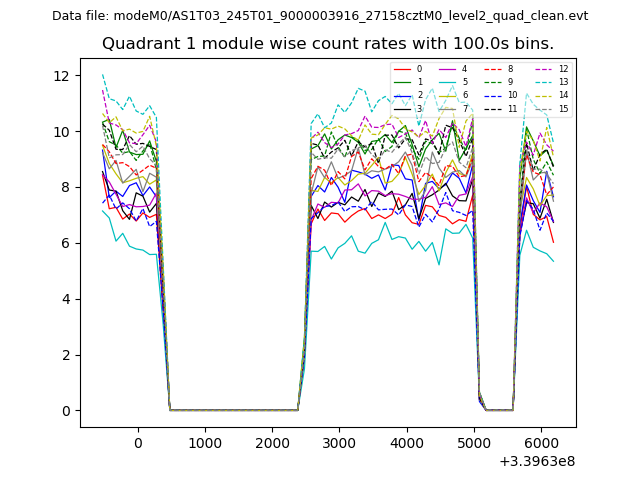
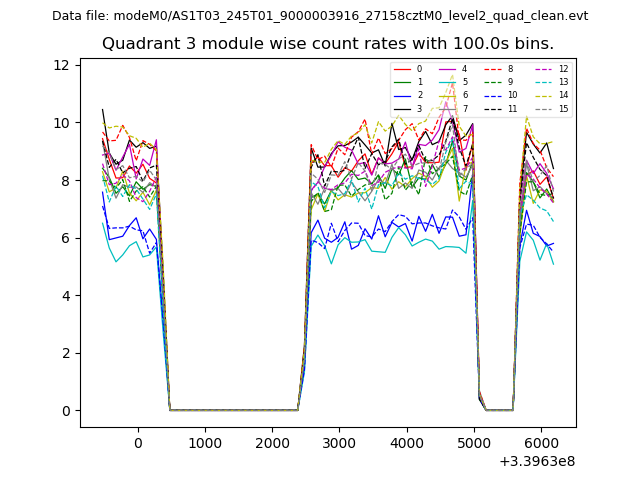
| Module-wise count rates for Quadrant A Data is divided into 100 sec bins |
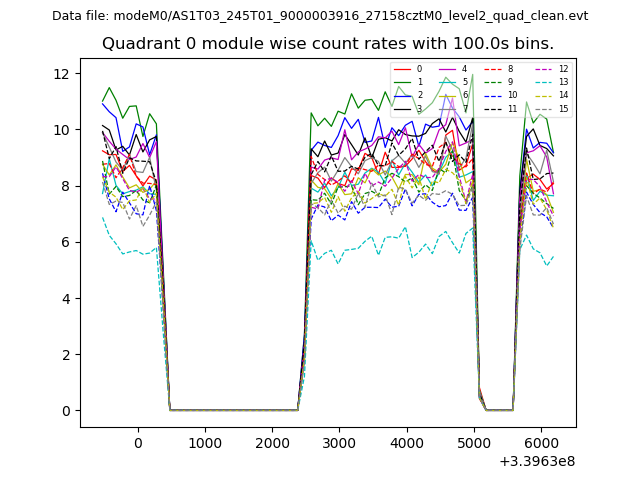 |
 |
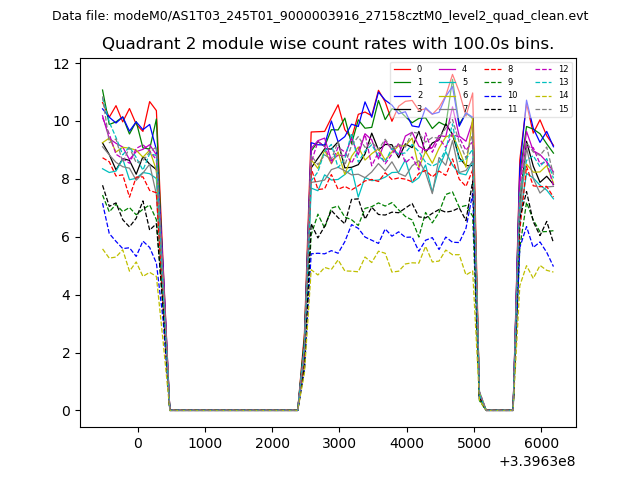
| Module-wise count rates for Quadrant B Data is divided into 100 sec bins |
 |
 |
| Module-wise count rates for Quadrant C Data is divided into 100 sec bins |
 |
 |
| Module-wise count rates for Quadrant D Data is divided into 100 sec bins |
 |
 |
| Parameter | Plot |
|---|---|
| CZT HV Monitor | 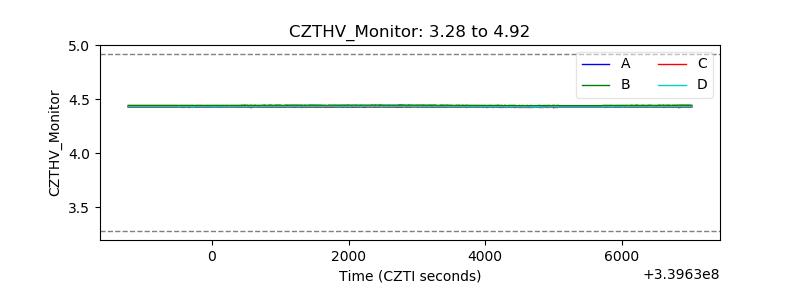 |
| D_VDD | 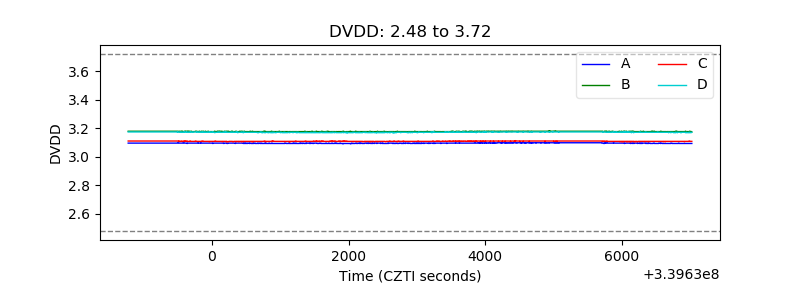 |
| Temperature 1 | 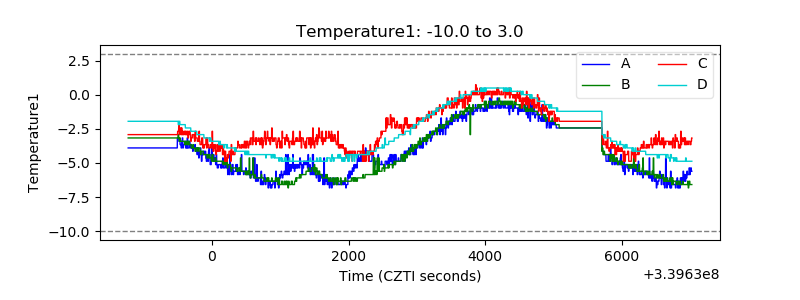 |
| Veto HV Monitor |  |
| Veto LLD |  |
| Alpha Counter | 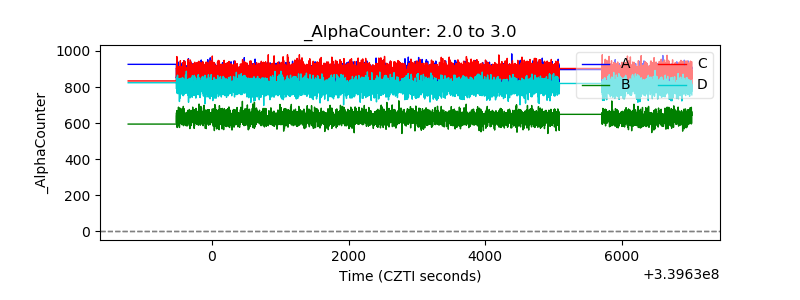 |
| _CPM_Rate | 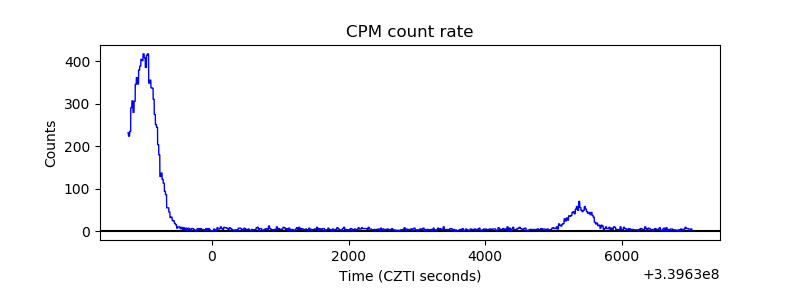 |
| CZT Counter | 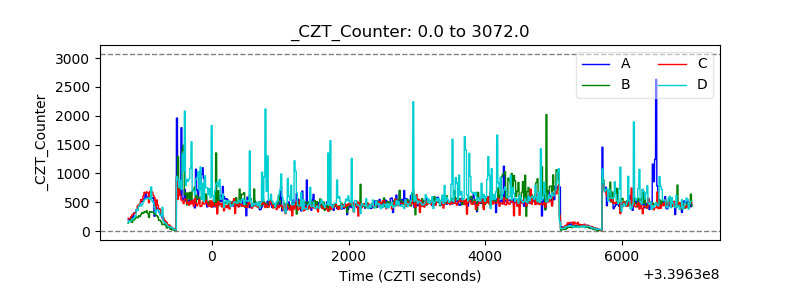 |
| +2.5 Volts monitor |  |
| +5 Volts monitor |  |
| _ROLL_ROT | 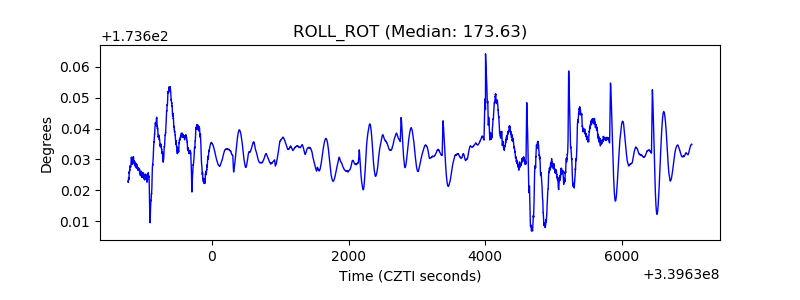 |
| _Roll_DEC | 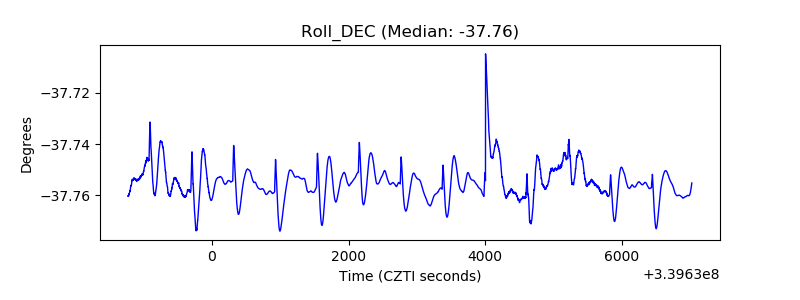 |
| _Roll_RA |  |
| Veto Counter | 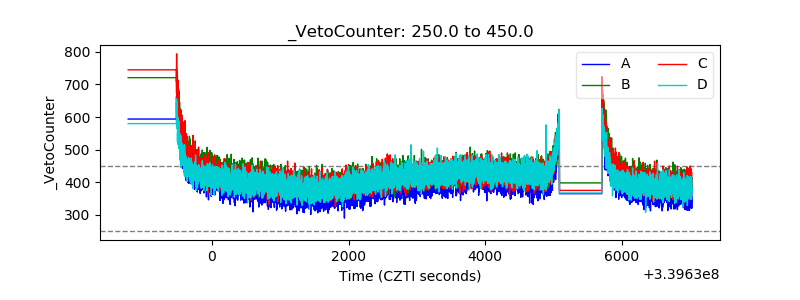 |