| Param | Original file | Final file |
|---|---|---|
| Filename | modeM0/AS1T03_245T01_9000003916_27159cztM0_level2.evt | modeM0/AS1T03_245T01_9000003916_27159cztM0_level2_quad_clean.evt |
| Size (bytes) | 598,538,880 | 89,510,400 |
| Size | 570.8 MB | 85.4 MB |
| Events in quadrant A | 4,227,337 | 549,339 |
| Events in quadrant B | 4,242,457 | 559,037 |
| Events in quadrant C | 3,801,379 | 540,495 |
| Events in quadrant D | 5,323,495 | 515,522 |
| Mode M0 | |||
|---|---|---|---|
| Quadrant | BADHDUFLAG | Total packets | Discarded packets |
| A | 0 | 17640 | 0 |
| B | 0 | 17559 | 0 |
| C | 0 | 16346 | 0 |
| D | 0 | 21235 | 0 |
| Mode M9 | |||
|---|---|---|---|
| Quadrant | BADHDUFLAG | Total packets | Discarded packets |
| A | 0 | 7 | 0 |
| B | 0 | 7 | 0 |
| C | 0 | 7 | 0 |
| D | 0 | 7 | 0 |
| Quadrant | Total seconds | Saturated seconds | Saturation percentage |
|---|---|---|---|
| A | 7844 | 179 | 2.281999% |
| B | 7844 | 202 | 2.575217% |
| C | 7845 | 214 | 2.727852% |
| D | 7845 | 358 | 4.563416% |
Noise dominated data is calculated using 1-second bins in cleaned event files. If a bin has >2000 counts, and if more than 50% of those come from <1% of pixels, then it is considered to be noise-dominated and hence unusable.
| Quadrant | # 1 sec bins | Bins with >0 counts | Bins with >2000 counts | High rate bins dominated by noise | Noise dominated (total time) | Noise dominated (detector-on time) | Marked lightcurve |
|---|---|---|---|---|---|---|---|
| A | 8609 | 7848 | 32 | 32 | 0.37% | 0.41% | 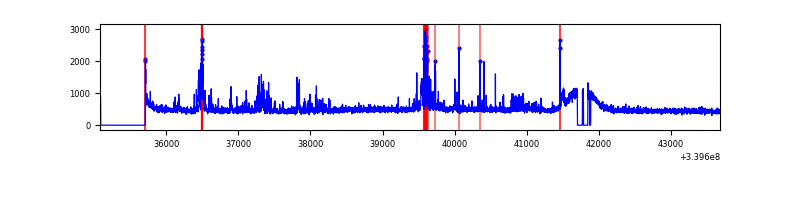 |
| B | 8609 | 7848 | 2 | 2 | 0.02% | 0.03% | 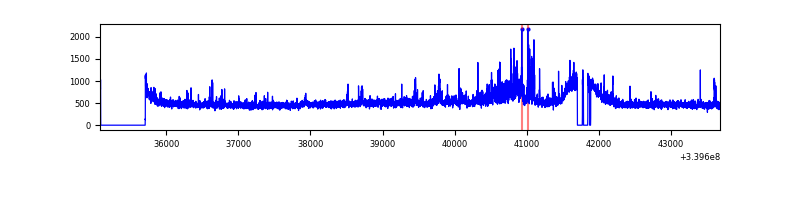 |
| C | 8610 | 7849 | 0 | 0 | 0.00% | 0.00% | 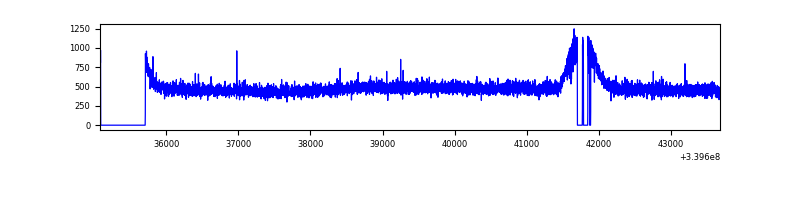 |
| D | 8610 | 7849 | 205 | 205 | 2.38% | 2.61% | 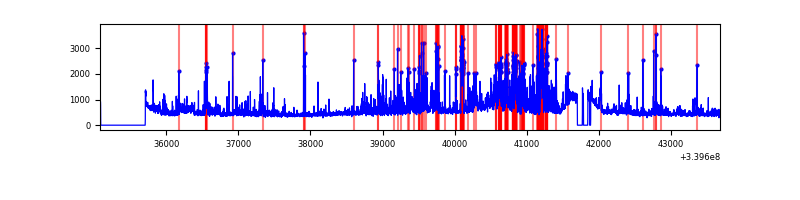 |
Top three noisy pixels from each quadrant. If the there are fewer than three noisy pixels in the level2.evt file, extra rows are filled as -1
| Pixel properties | Quadrant properties | ||||||
|---|---|---|---|---|---|---|---|
| Quadrant | DetID | PixID | Counts | Sigma | Mean | Median | Sigma |
| A | 15 | 174 | 225667 | 1139.41 | 975 | 956 | 197.2 |
| A | 0 | 13 | 136286 | 686.2 | 975 | 956 | 197.2 |
| A | 12 | 189 | 60793 | 303.41 | 975 | 956 | 197.2 |
| B | 15 | 33 | 114190 | 597.37 | 975 | 949 | 189.6 |
| B | 3 | 112 | 92375 | 482.29 | 975 | 949 | 189.6 |
| B | 0 | 190 | 60711 | 315.26 | 975 | 949 | 189.6 |
| C | 14 | 238 | 147615 | 659.83 | 935 | 941 | 222.3 |
| C | 13 | 61 | 6590 | 25.41 | 935 | 941 | 222.3 |
| C | 3 | 233 | 3749 | 12.63 | 935 | 941 | 222.3 |
| D | 12 | 233 | 757021 | 3078.78 | 925 | 904 | 245.6 |
| D | 1 | 52 | 623000 | 2533.07 | 925 | 904 | 245.6 |
| D | 2 | 250 | 194195 | 787.05 | 925 | 904 | 245.6 |
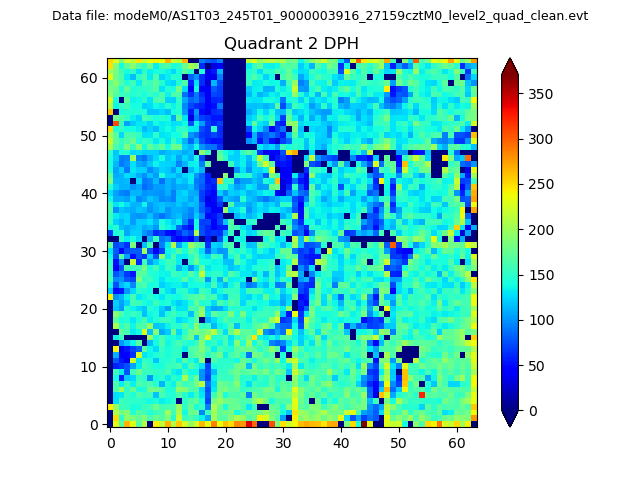
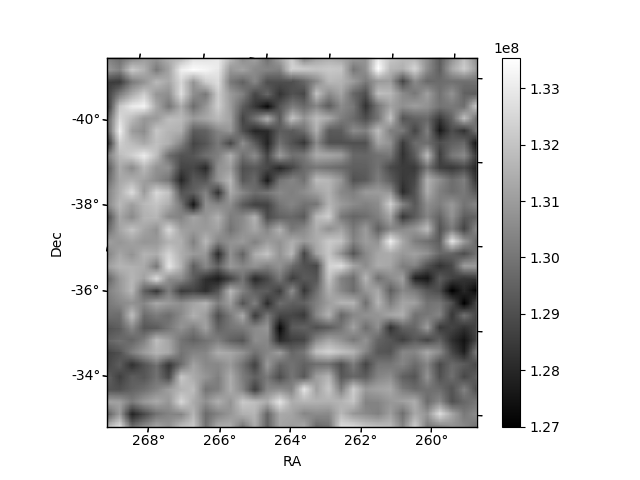
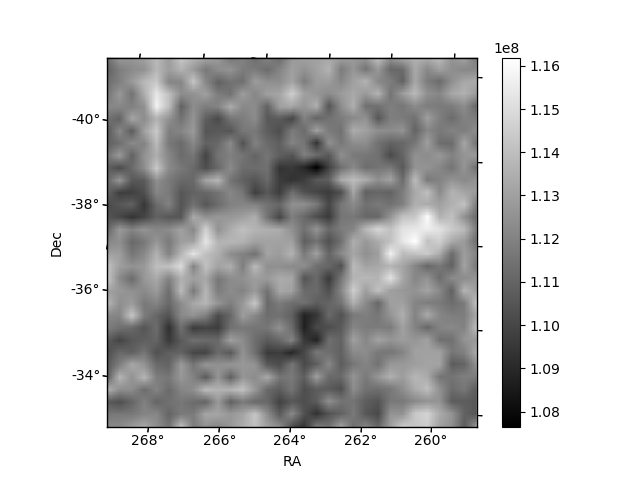
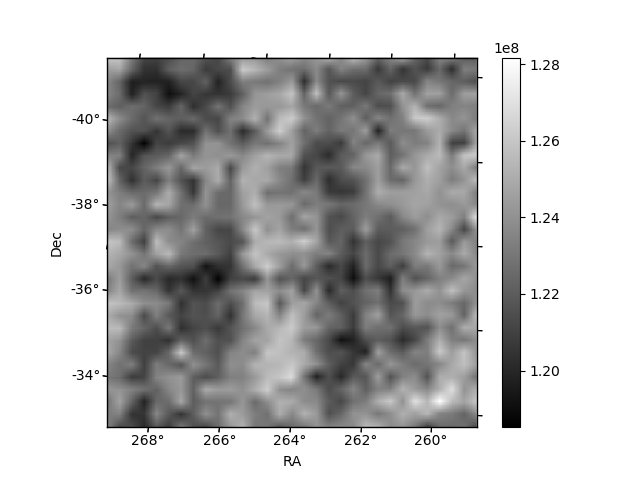
Histogram calculated using DETX and DETY for each event in the final _common_clean file
| Quadrant A |  |
 |
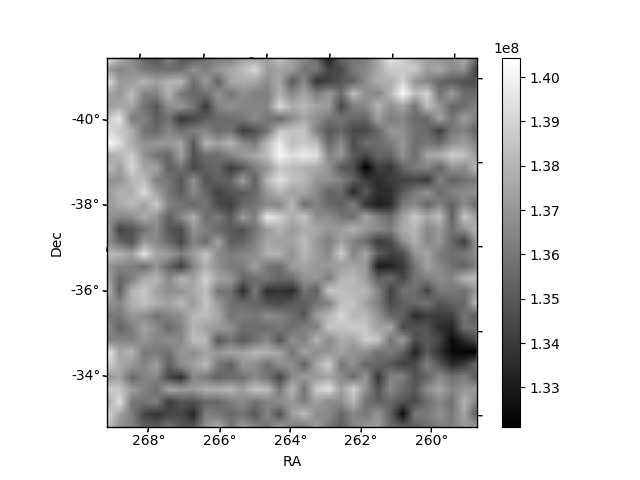
Quadrant B |
|---|---|---|---|
| Quadrant D | 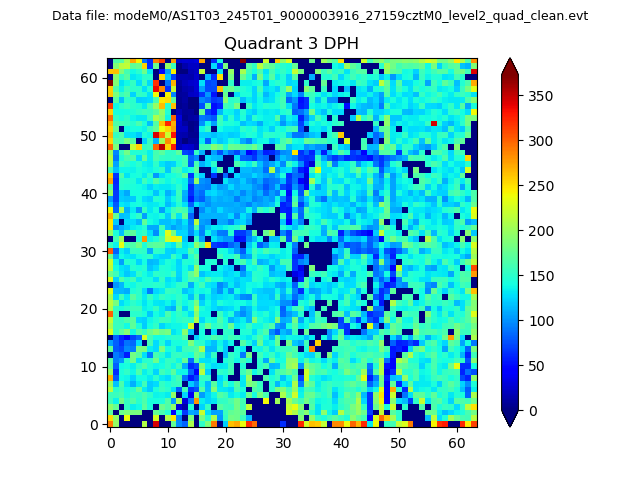 |
 |
Quadrant C |
| Plot type | Count rate plots | Images |
|---|---|---|
| Comparison with Poisson distribution Blue bars denote a histogram of data divided into 1 sec bins. Red curve is a Poisson curve with rate = median count rate of data. |
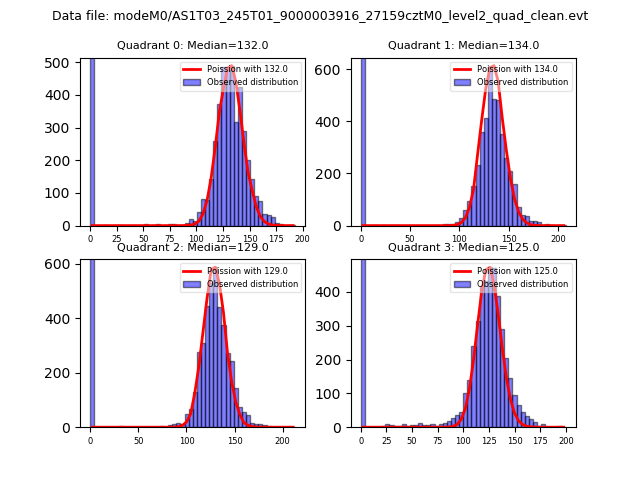 |
 |
| Quadrant-wise count rates Data is divided into 100 sec bins |
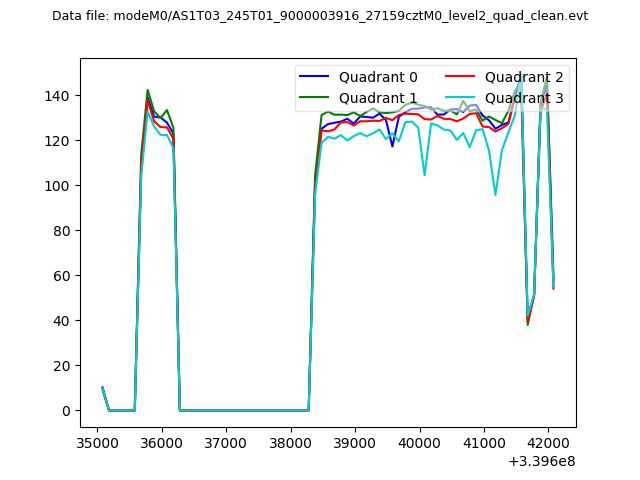 |
|
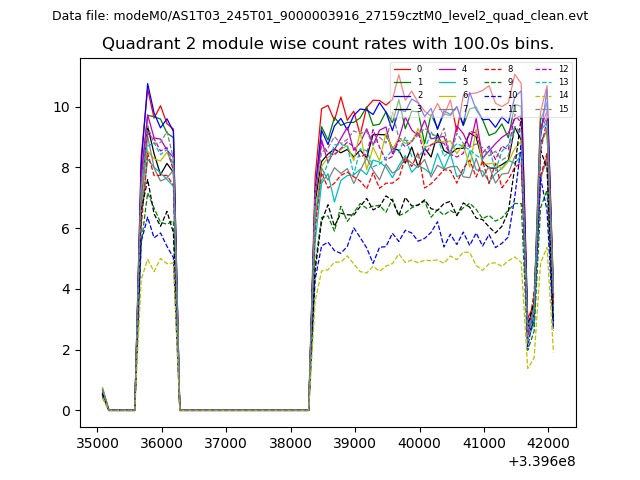
| Module-wise count rates for Quadrant A Data is divided into 100 sec bins |
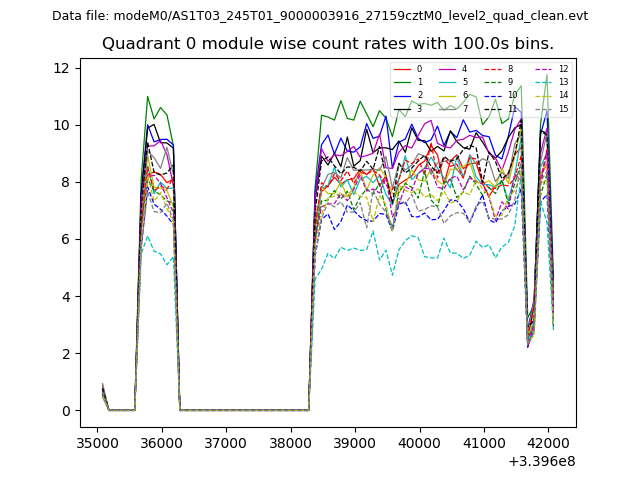 |
 |
| Module-wise count rates for Quadrant B Data is divided into 100 sec bins |
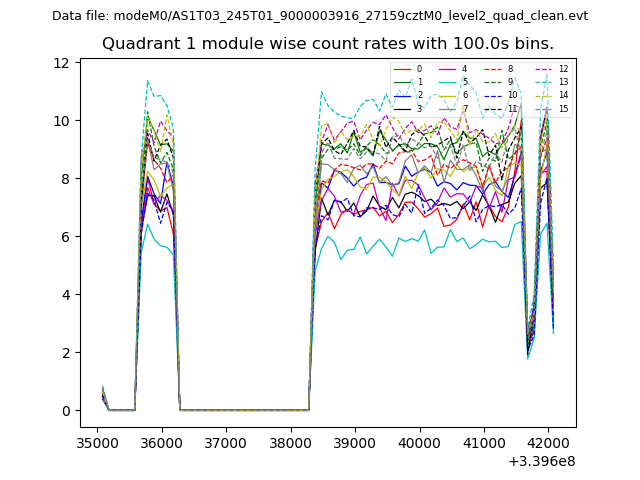 |
 |
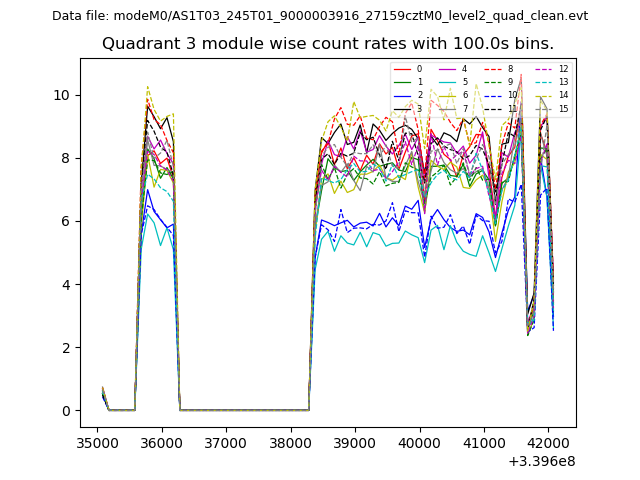
| Module-wise count rates for Quadrant C Data is divided into 100 sec bins |
 |
 |
| Module-wise count rates for Quadrant D Data is divided into 100 sec bins |
 |
 |
| Parameter | Plot |
|---|---|
| CZT HV Monitor | 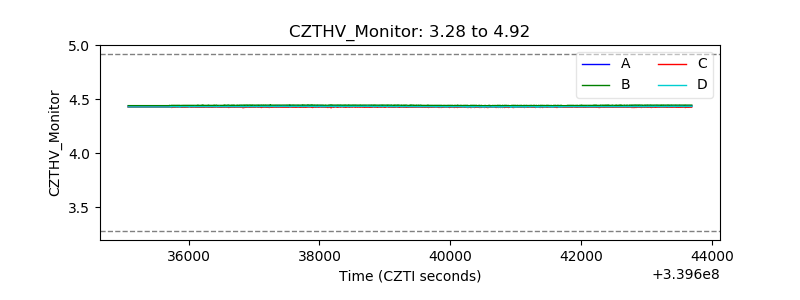 |
| D_VDD | 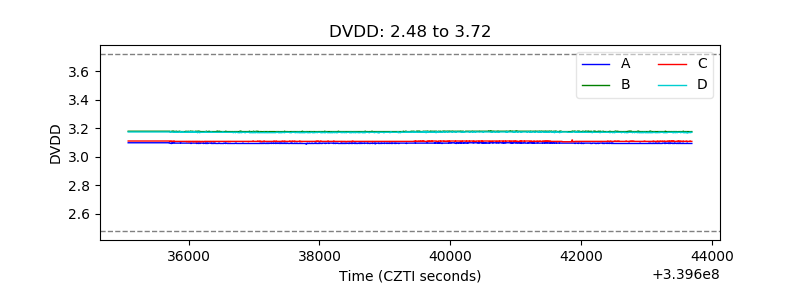 |
| Temperature 1 | 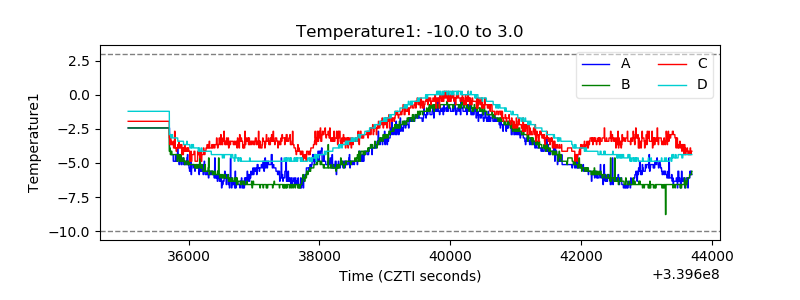 |
| Veto HV Monitor | 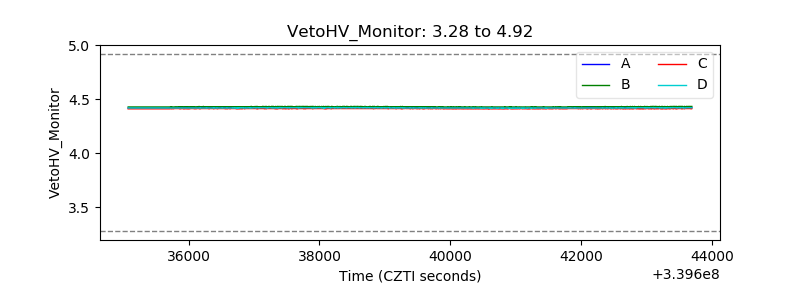 |
| Veto LLD |  |
| Alpha Counter | 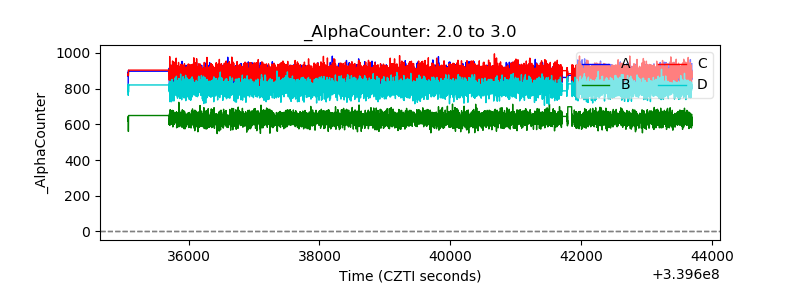 |
| _CPM_Rate | 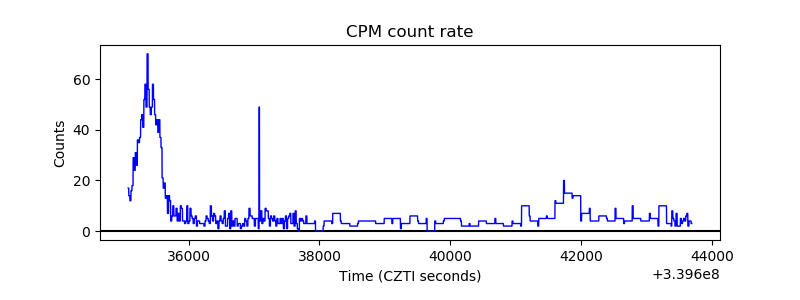 |
| CZT Counter |  |
| +2.5 Volts monitor |  |
| +5 Volts monitor | 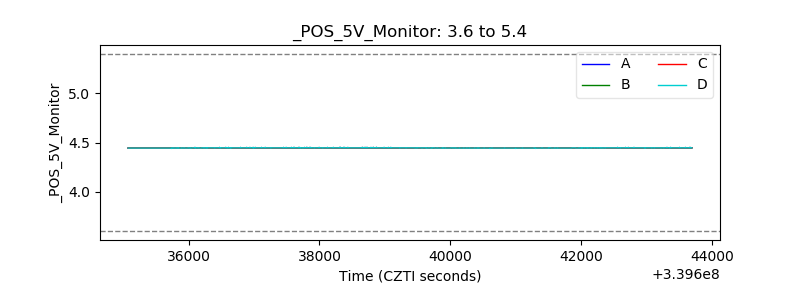 |
| _ROLL_ROT | 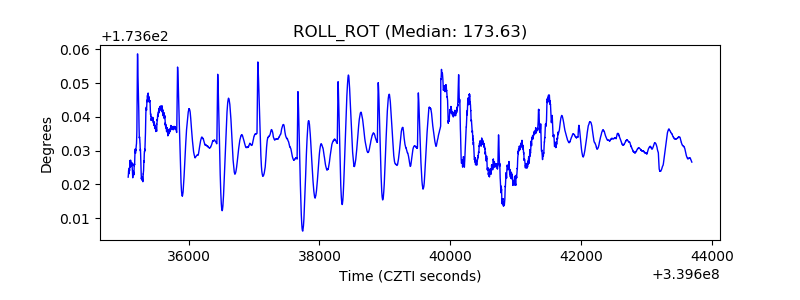 |
| _Roll_DEC | 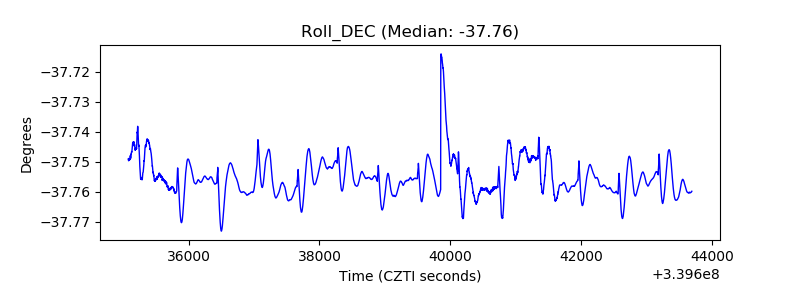 |
| _Roll_RA |  |
| Veto Counter | 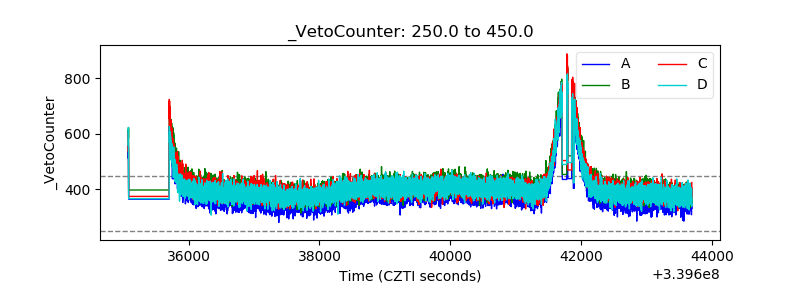 |