| Param | Original file | Final file |
|---|---|---|
| Filename | modeM0/AS1T03_245T01_9000003916_27163cztM0_level2.evt | modeM0/AS1T03_245T01_9000003916_27163cztM0_level2_quad_clean.evt |
| Size (bytes) | 1,405,128,960 | 242,314,560 |
| Size | 1.3 GB | 231.1 MB |
| Events in quadrant A | 8,895,266 | 1,546,474 |
| Events in quadrant B | 9,258,351 | 1,576,423 |
| Events in quadrant C | 8,859,644 | 1,510,970 |
| Events in quadrant D | 14,295,793 | 1,434,217 |
| Mode M0 | |||
|---|---|---|---|
| Quadrant | BADHDUFLAG | Total packets | Discarded packets |
| A | 0 | 38030 | 0 |
| B | 0 | 38429 | 0 |
| C | 0 | 37887 | 0 |
| D | 0 | 54718 | 0 |
| Mode M9 | |||
|---|---|---|---|
| Quadrant | BADHDUFLAG | Total packets | Discarded packets |
| A | 0 | 19 | 0 |
| B | 0 | 19 | 0 |
| C | 0 | 19 | 0 |
| D | 0 | 19 | 0 |
| Quadrant | Total seconds | Saturated seconds | Saturation percentage |
|---|---|---|---|
| A | 18446 | 248 | 1.344465% |
| B | 18447 | 242 | 1.311866% |
| C | 18447 | 339 | 1.837697% |
| D | 18446 | 1201 | 6.510897% |
Noise dominated data is calculated using 1-second bins in cleaned event files. If a bin has >2000 counts, and if more than 50% of those come from <1% of pixels, then it is considered to be noise-dominated and hence unusable.
| Quadrant | # 1 sec bins | Bins with >0 counts | Bins with >2000 counts | High rate bins dominated by noise | Noise dominated (total time) | Noise dominated (detector-on time) | Marked lightcurve |
|---|---|---|---|---|---|---|---|
| A | 20246 | 18449 | 8 | 8 | 0.04% | 0.04% | 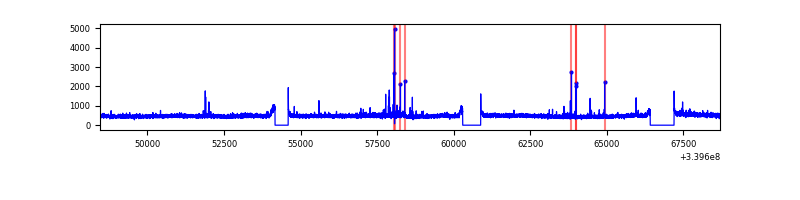 |
| B | 20247 | 18450 | 1 | 1 | 0.00% | 0.01% | 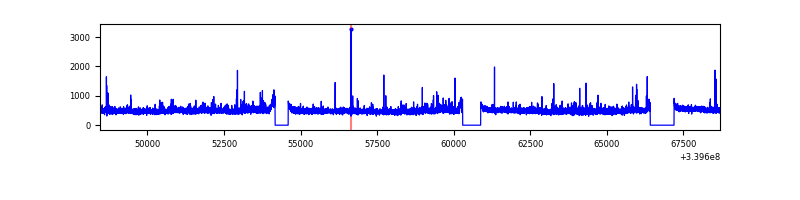 |
| C | 20247 | 18450 | 4 | 4 | 0.02% | 0.02% | 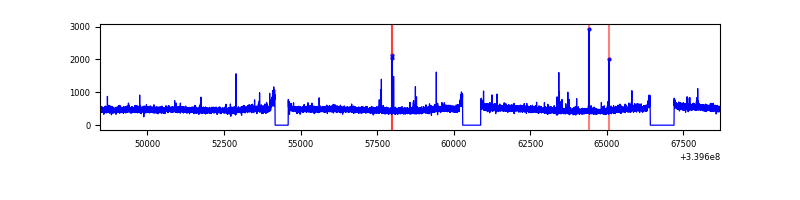 |
| D | 20246 | 18449 | 952 | 952 | 4.70% | 5.16% | 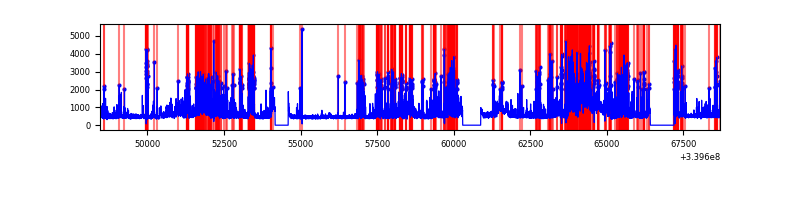 |
Top three noisy pixels from each quadrant. If the there are fewer than three noisy pixels in the level2.evt file, extra rows are filled as -1
| Pixel properties | Quadrant properties | ||||||
|---|---|---|---|---|---|---|---|
| Quadrant | DetID | PixID | Counts | Sigma | Mean | Median | Sigma |
| A | 4 | 2 | 89067 | 191.3 | 2253 | 2203 | 454.1 |
| A | 13 | 248 | 69946 | 149.19 | 2253 | 2203 | 454.1 |
| A | 13 | 254 | 30762 | 62.89 | 2253 | 2203 | 454.1 |
| B | 3 | 112 | 215169 | 499.88 | 2241 | 2180 | 426.1 |
| B | 0 | 190 | 60348 | 136.52 | 2241 | 2180 | 426.1 |
| B | 7 | 205 | 58294 | 131.7 | 2241 | 2180 | 426.1 |
| C | 14 | 238 | 342222 | 673.68 | 2156 | 2164 | 504.8 |
| C | 15 | 208 | 62068 | 118.67 | 2156 | 2164 | 504.8 |
| C | 2 | 16 | 23218 | 41.71 | 2156 | 2164 | 504.8 |
| D | 1 | 52 | 2832516 | 5260.93 | 2119 | 2069 | 538.0 |
| D | 7 | 38 | 1456233 | 2702.84 | 2119 | 2069 | 538.0 |
| D | 2 | 250 | 693935 | 1285.97 | 2119 | 2069 | 538.0 |
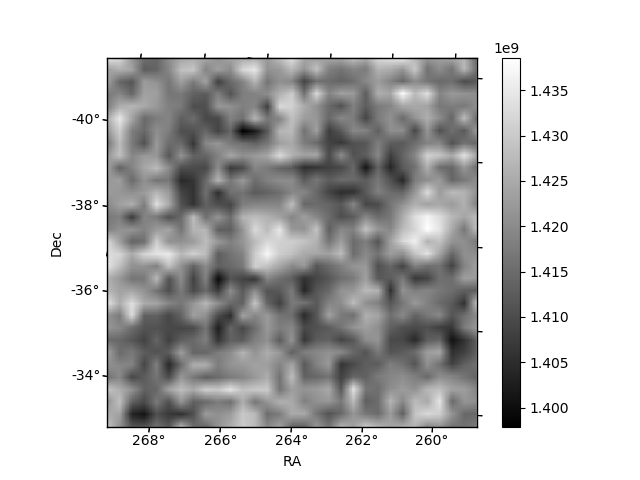
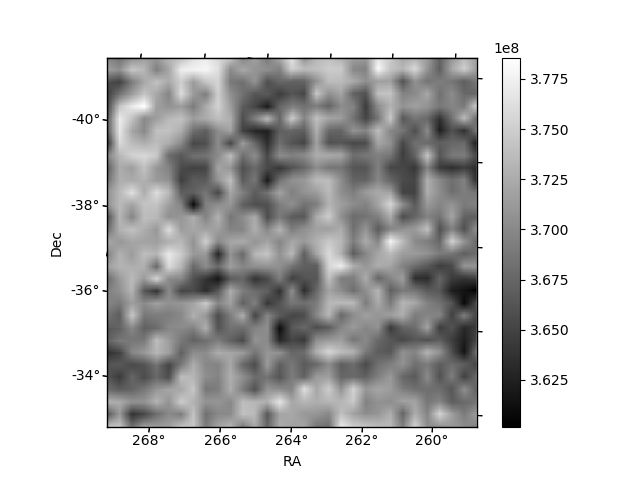
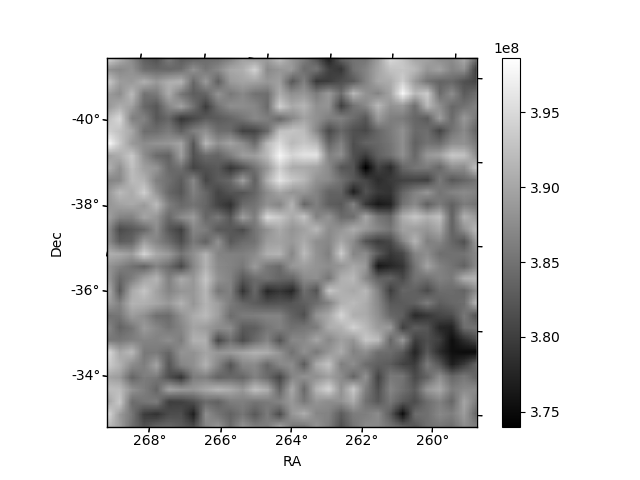
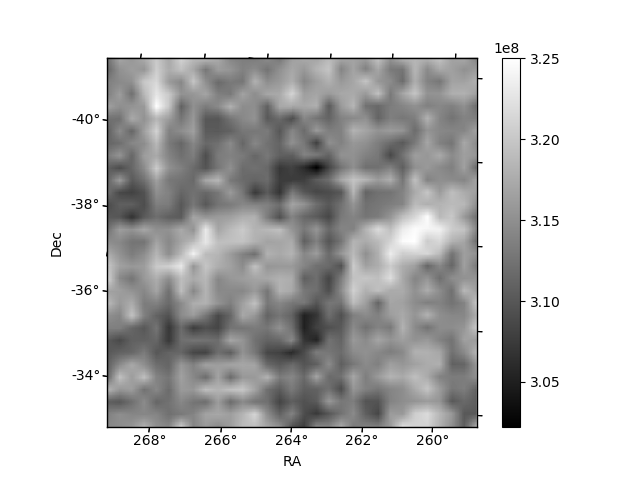
Histogram calculated using DETX and DETY for each event in the final _common_clean file
| Quadrant A | 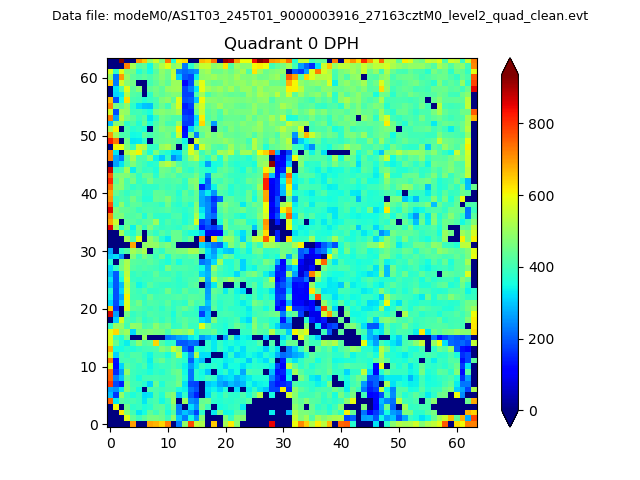 |
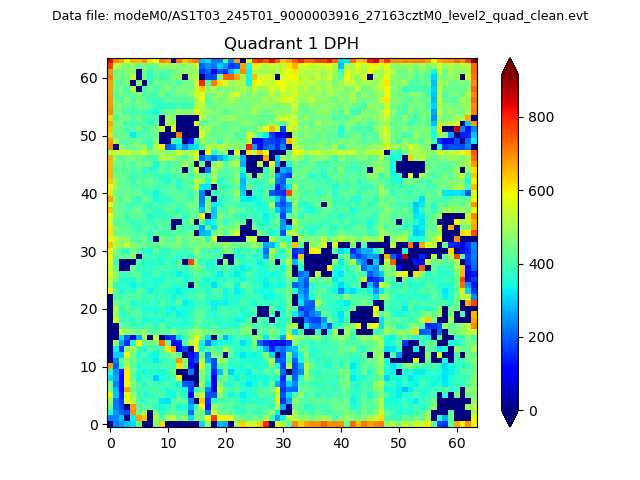 |
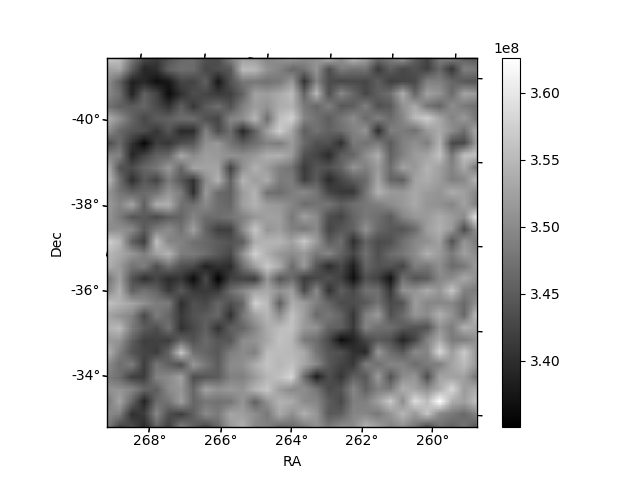
Quadrant B |
|---|---|---|---|
| Quadrant D | 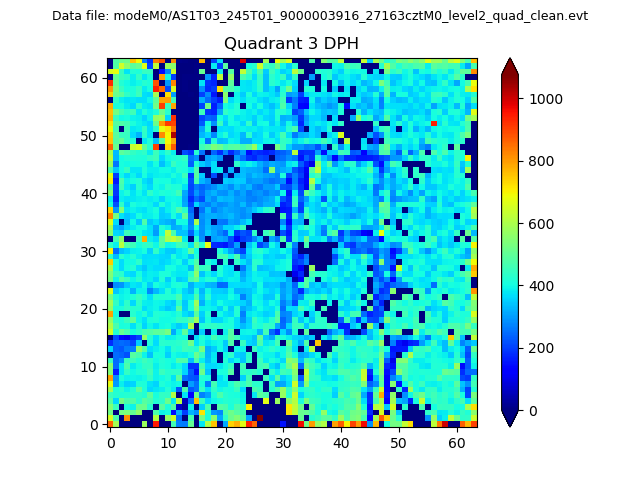 |
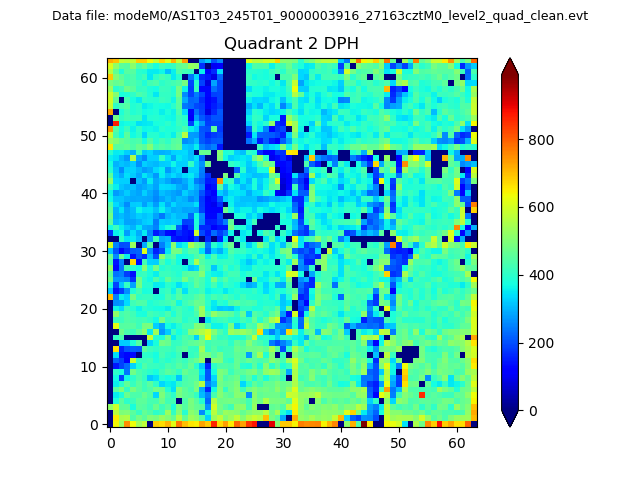 |
Quadrant C |
| Plot type | Count rate plots | Images |
|---|---|---|
| Comparison with Poisson distribution Blue bars denote a histogram of data divided into 1 sec bins. Red curve is a Poisson curve with rate = median count rate of data. |
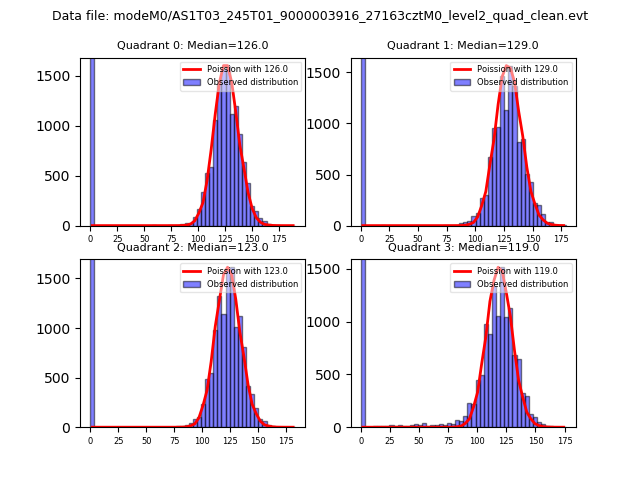 |
 |
| Quadrant-wise count rates Data is divided into 100 sec bins |
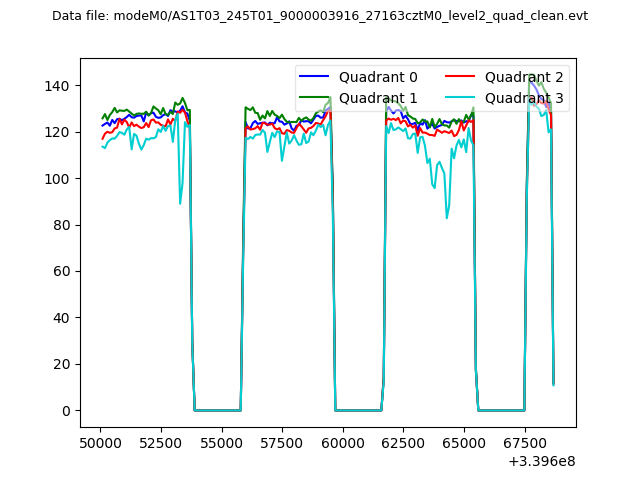 |
|
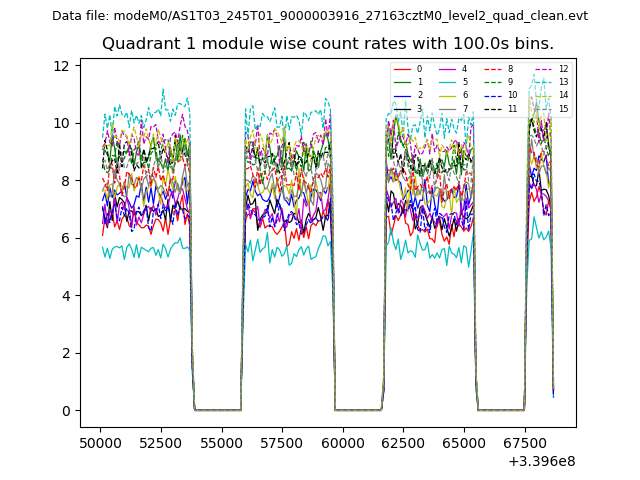
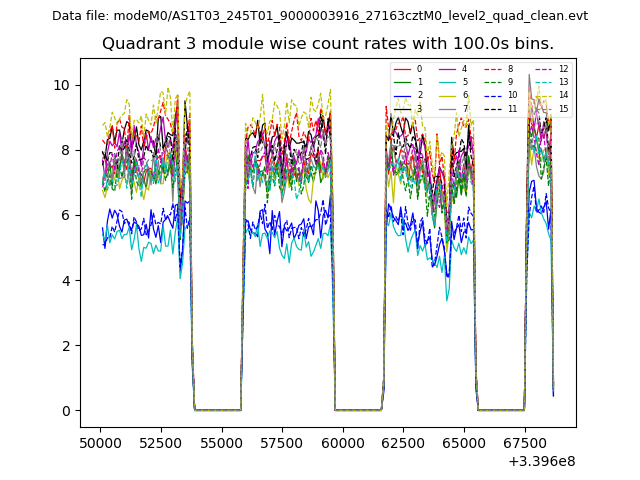
| Module-wise count rates for Quadrant A Data is divided into 100 sec bins |
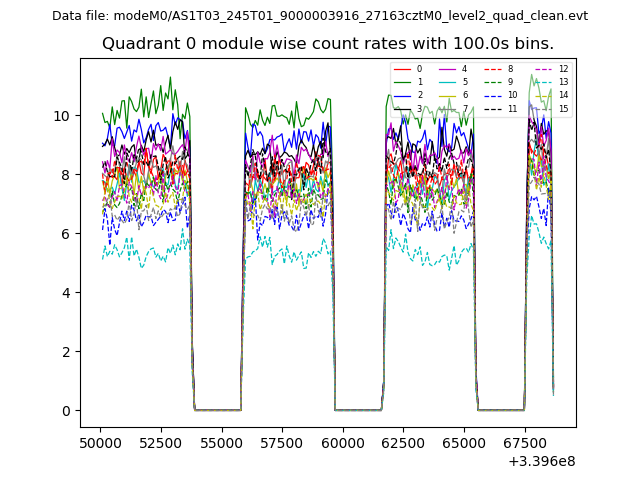 |
 |
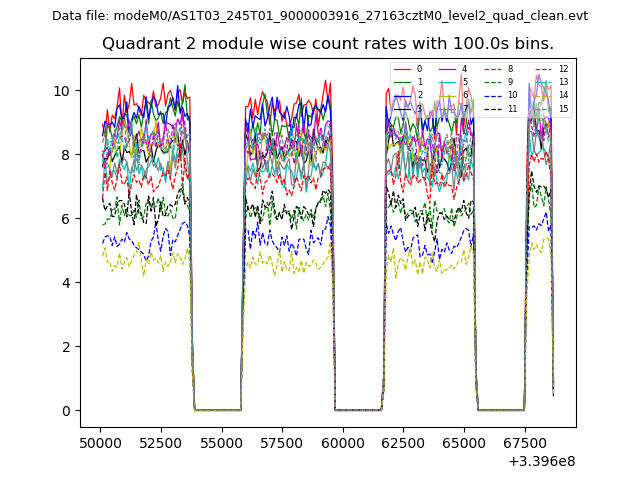
| Module-wise count rates for Quadrant B Data is divided into 100 sec bins |
 |
 |
| Module-wise count rates for Quadrant C Data is divided into 100 sec bins |
 |
 |
| Module-wise count rates for Quadrant D Data is divided into 100 sec bins |
 |
 |
| Parameter | Plot |
|---|---|
| CZT HV Monitor | 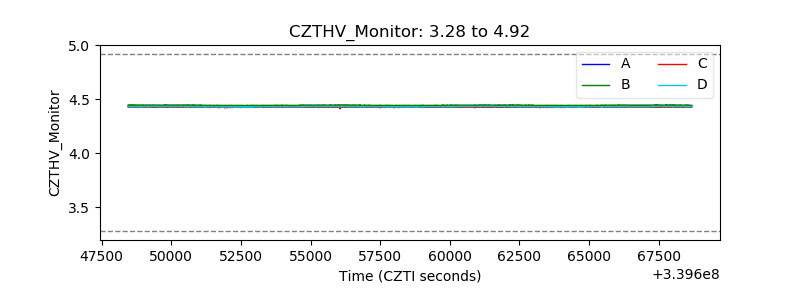 |
| D_VDD | 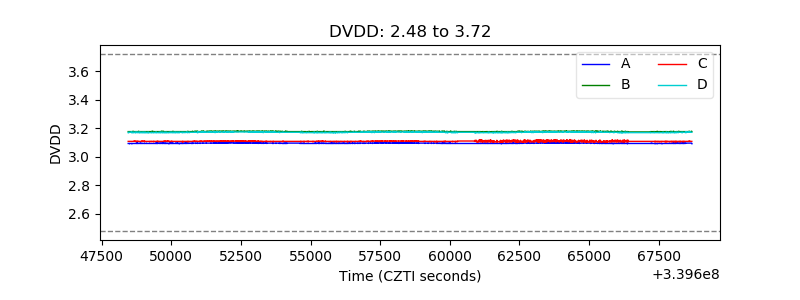 |
| Temperature 1 | 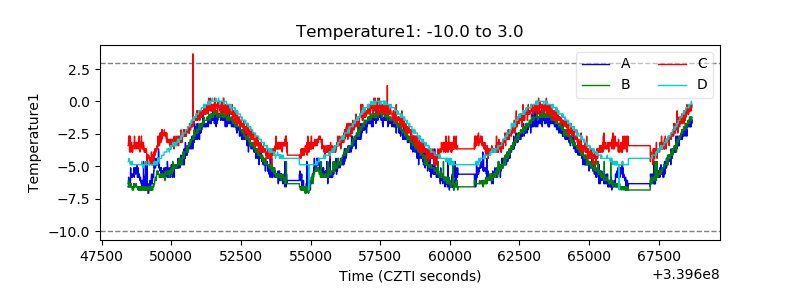 |
| Veto HV Monitor |  |
| Veto LLD | 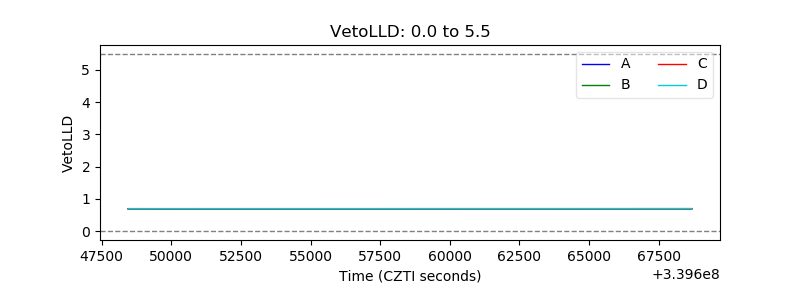 |
| Alpha Counter | 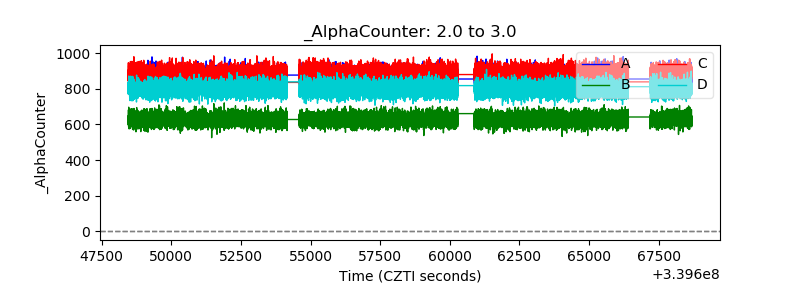 |
| _CPM_Rate | 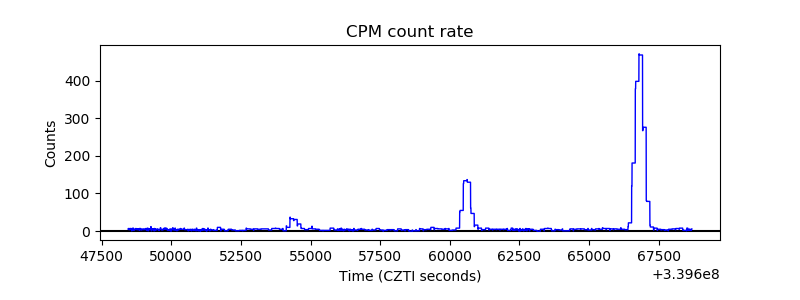 |
| CZT Counter | 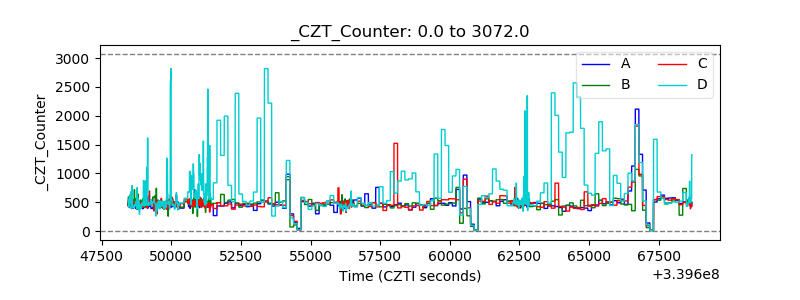 |
| +2.5 Volts monitor | 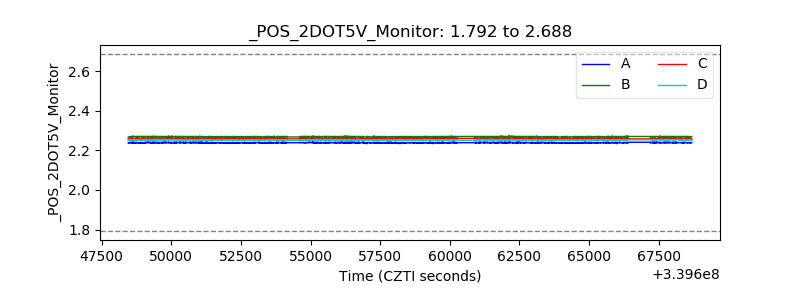 |
| +5 Volts monitor |  |
| _ROLL_ROT | 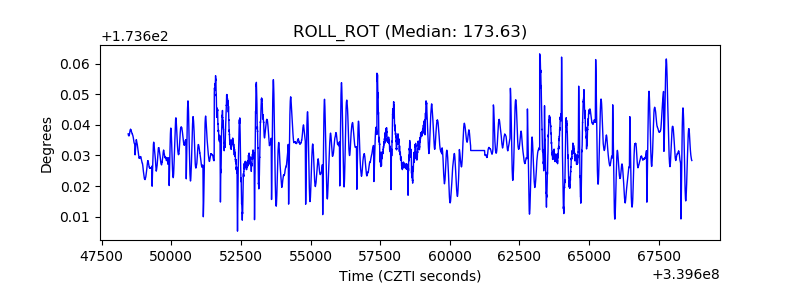 |
| _Roll_DEC | 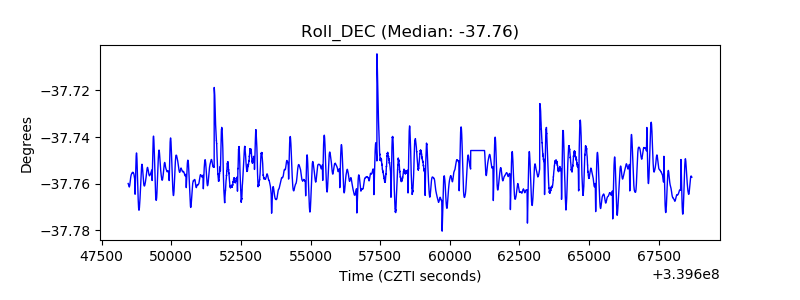 |
| _Roll_RA | 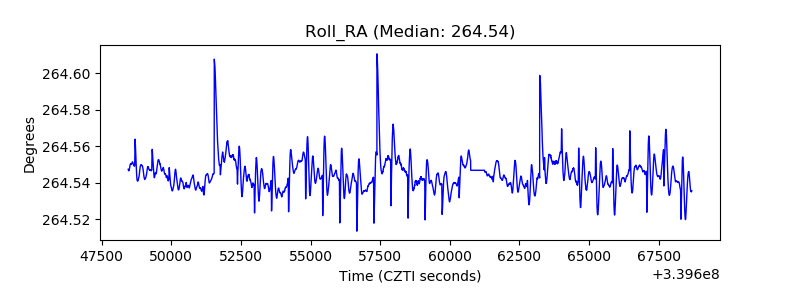 |
| Veto Counter | 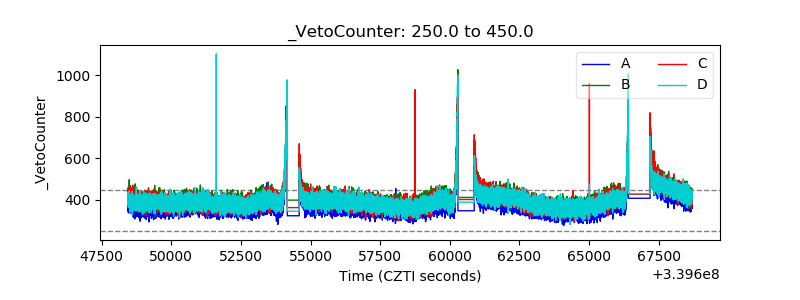 |