| Param | Original file | Final file |
|---|---|---|
| Filename | modeM0/AS1T03_245T01_9000003916_27166cztM0_level2.evt | modeM0/AS1T03_245T01_9000003916_27166cztM0_level2_quad_clean.evt |
| Size (bytes) | 631,797,120 | 90,996,480 |
| Size | 602.5 MB | 86.8 MB |
| Events in quadrant A | 4,862,022 | 586,333 |
| Events in quadrant B | 3,171,467 | 641,906 |
| Events in quadrant C | 2,939,727 | 609,542 |
| Events in quadrant D | 7,757,309 | 500,856 |
| Mode M0 | |||
|---|---|---|---|
| Quadrant | BADHDUFLAG | Total packets | Discarded packets |
| A | 0 | 18329 | 0 |
| B | 0 | 13245 | 0 |
| C | 0 | 12649 | 0 |
| D | 0 | 27140 | 0 |
| Mode M9 | |||
|---|---|---|---|
| Quadrant | BADHDUFLAG | Total packets | Discarded packets |
| A | 0 | 11 | 0 |
| B | 0 | 11 | 0 |
| C | 0 | 11 | 0 |
| D | 0 | 11 | 0 |
| Quadrant | Total seconds | Saturated seconds | Saturation percentage |
|---|---|---|---|
| A | 5955 | 782 | 13.131822% |
| B | 5956 | 70 | 1.175285% |
| C | 5956 | 77 | 1.292814% |
| D | 5956 | 1838 | 30.859637% |
Noise dominated data is calculated using 1-second bins in cleaned event files. If a bin has >2000 counts, and if more than 50% of those come from <1% of pixels, then it is considered to be noise-dominated and hence unusable.
| Quadrant | # 1 sec bins | Bins with >0 counts | Bins with >2000 counts | High rate bins dominated by noise | Noise dominated (total time) | Noise dominated (detector-on time) | Marked lightcurve |
|---|---|---|---|---|---|---|---|
| A | 7045 | 5956 | 650 | 650 | 9.23% | 10.91% | 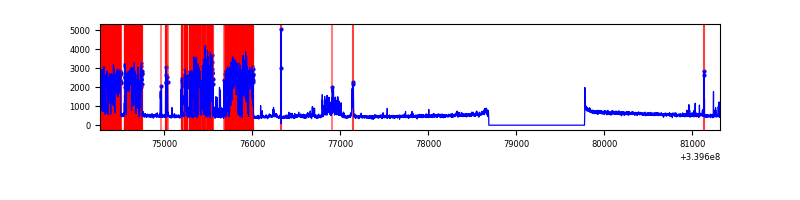 |
| B | 7046 | 5957 | 4 | 4 | 0.06% | 0.07% | 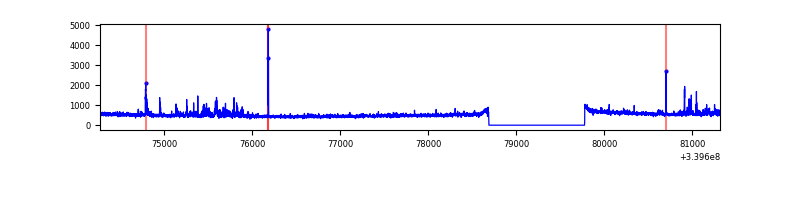 |
| C | 7046 | 5957 | 1 | 1 | 0.01% | 0.02% | 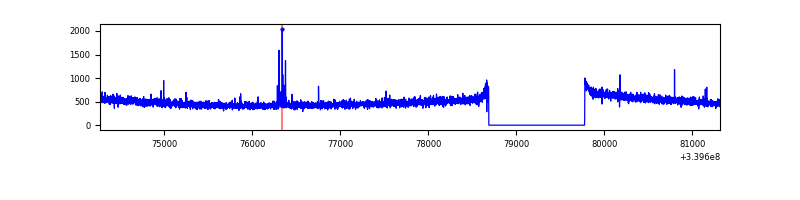 |
| D | 7046 | 5957 | 1515 | 1515 | 21.50% | 25.43% | 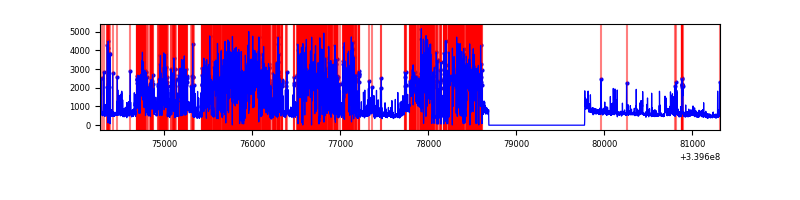 |
Top three noisy pixels from each quadrant. If the there are fewer than three noisy pixels in the level2.evt file, extra rows are filled as -1
| Pixel properties | Quadrant properties | ||||||
|---|---|---|---|---|---|---|---|
| Quadrant | DetID | PixID | Counts | Sigma | Mean | Median | Sigma |
| A | 6 | 16 | 2007723 | 13691.26 | 725 | 712 | 146.6 |
| A | 13 | 248 | 54455 | 366.62 | 725 | 712 | 146.6 |
| A | 13 | 254 | 10059 | 63.76 | 725 | 712 | 146.6 |
| B | 15 | 33 | 112979 | 784.0 | 754 | 737 | 143.2 |
| B | 5 | 172 | 42554 | 292.09 | 754 | 737 | 143.2 |
| B | 10 | 245 | 18486 | 123.98 | 754 | 737 | 143.2 |
| C | 14 | 238 | 115680 | 680.59 | 718 | 724 | 168.9 |
| C | 15 | 208 | 23039 | 132.11 | 718 | 724 | 168.9 |
| C | 13 | 61 | 4914 | 24.81 | 718 | 724 | 168.9 |
| D | 1 | 52 | 5089201 | 32029.7 | 598 | 589 | 158.9 |
| D | 7 | 38 | 171466 | 1075.57 | 598 | 589 | 158.9 |
| D | 2 | 250 | 74123 | 462.85 | 598 | 589 | 158.9 |
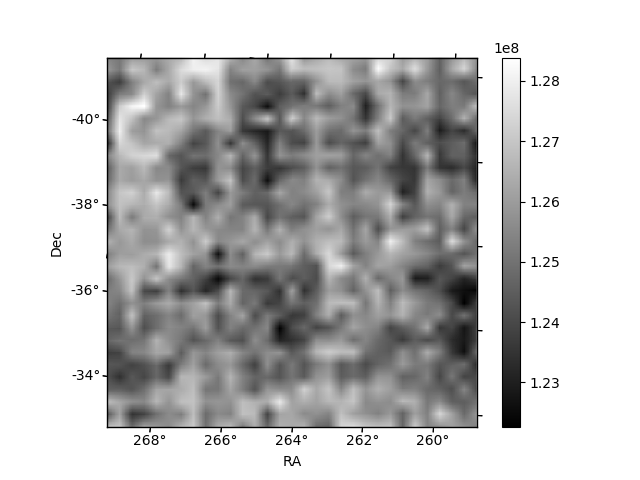
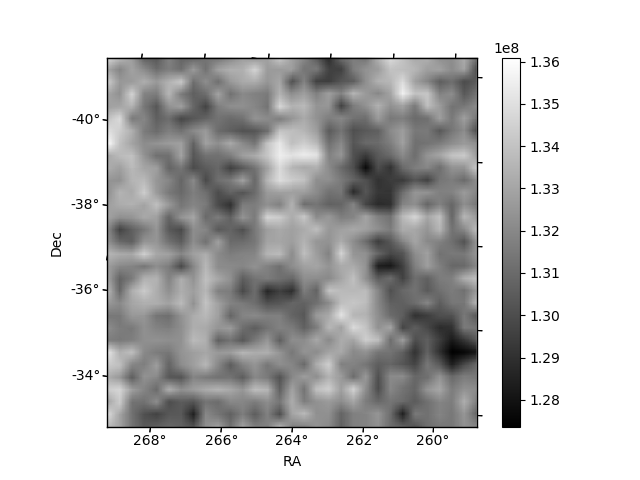
Histogram calculated using DETX and DETY for each event in the final _common_clean file
| Quadrant A | 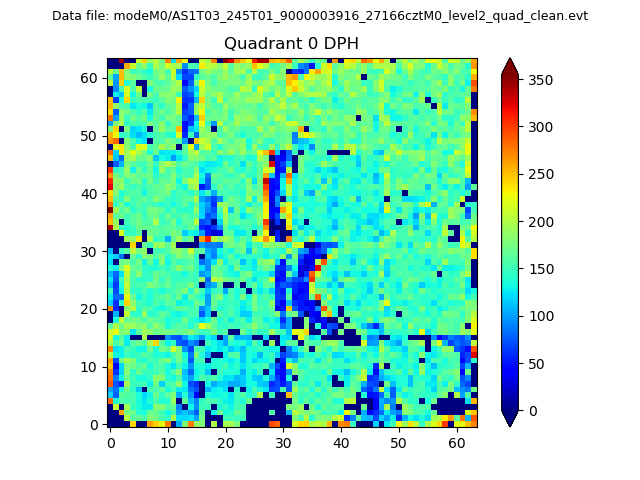 |
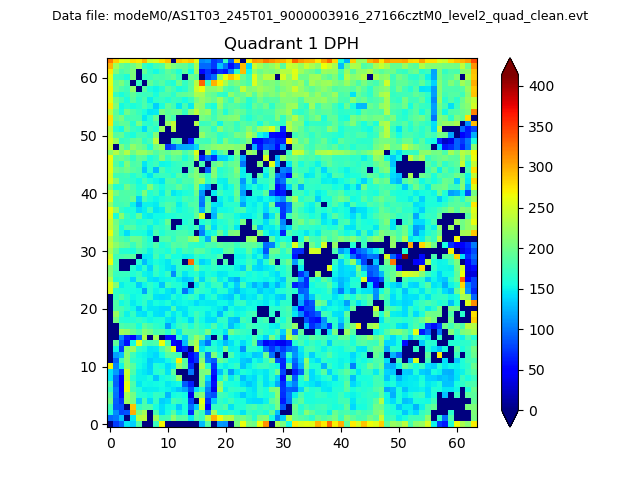 |
Quadrant B |
|---|---|---|---|
| Quadrant D | 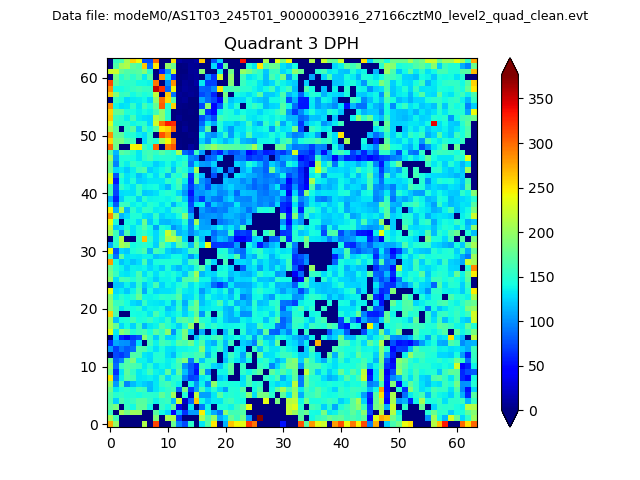 |
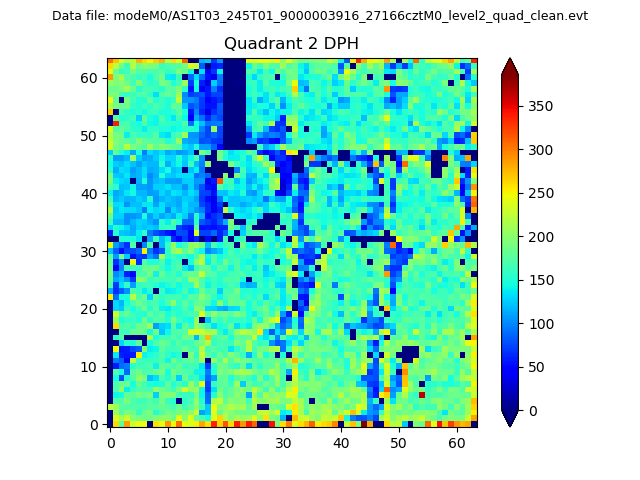 |
Quadrant C |
| Plot type | Count rate plots | Images |
|---|---|---|
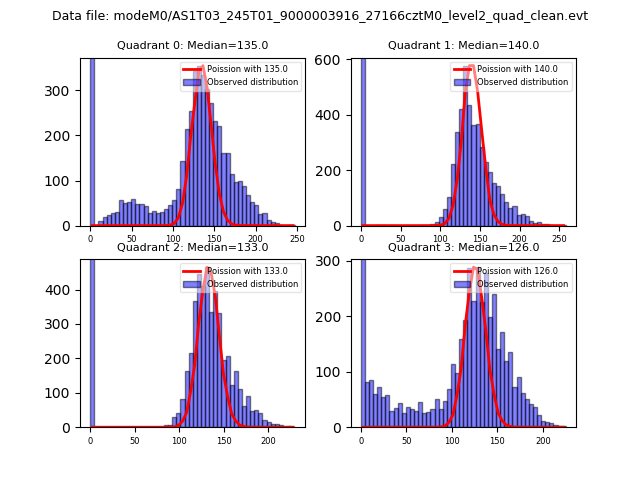
| Comparison with Poisson distribution Blue bars denote a histogram of data divided into 1 sec bins. Red curve is a Poisson curve with rate = median count rate of data. |
 |
 |
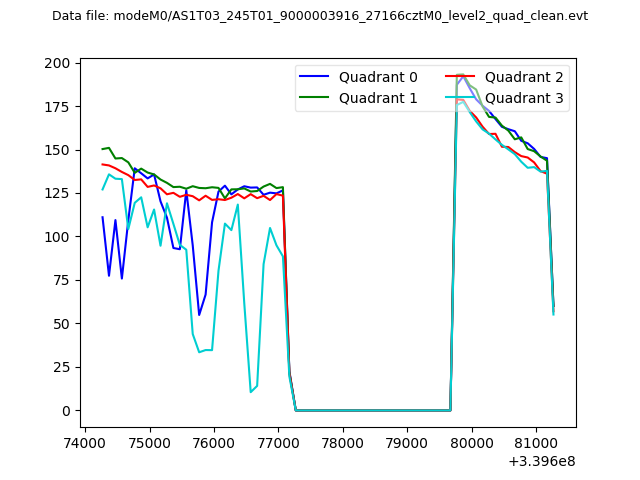
| Quadrant-wise count rates Data is divided into 100 sec bins |
 |
|
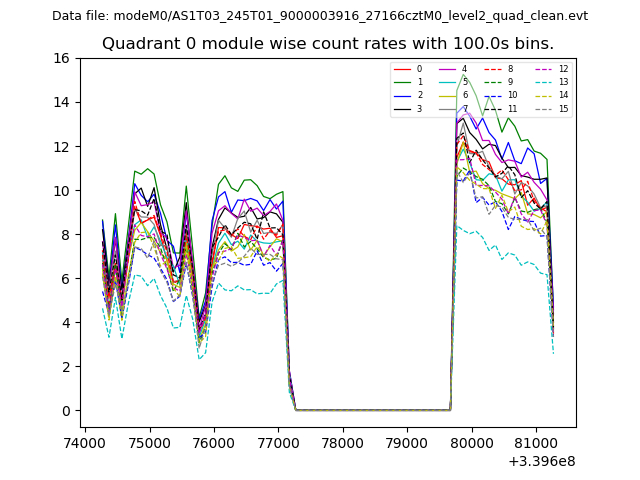
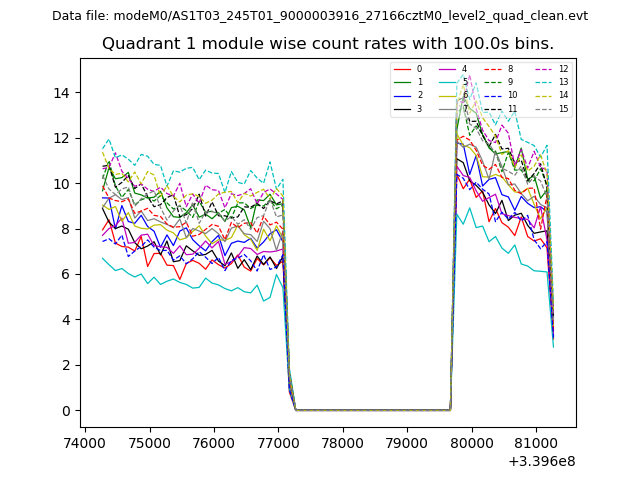
| Module-wise count rates for Quadrant A Data is divided into 100 sec bins |
 |
 |
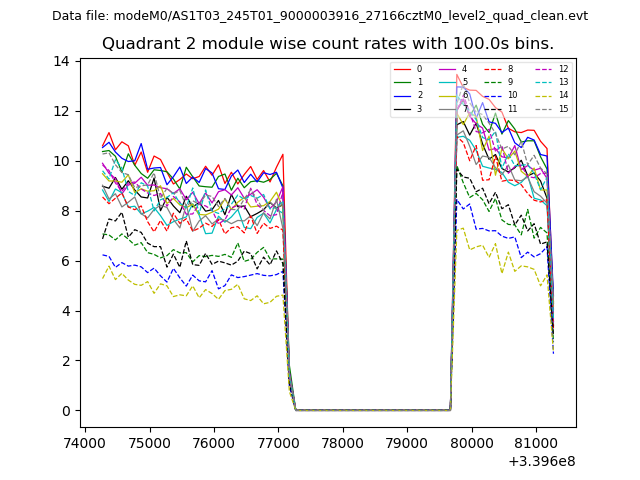
| Module-wise count rates for Quadrant B Data is divided into 100 sec bins |
 |
 |
| Module-wise count rates for Quadrant C Data is divided into 100 sec bins |
 |
 |
| Module-wise count rates for Quadrant D Data is divided into 100 sec bins |
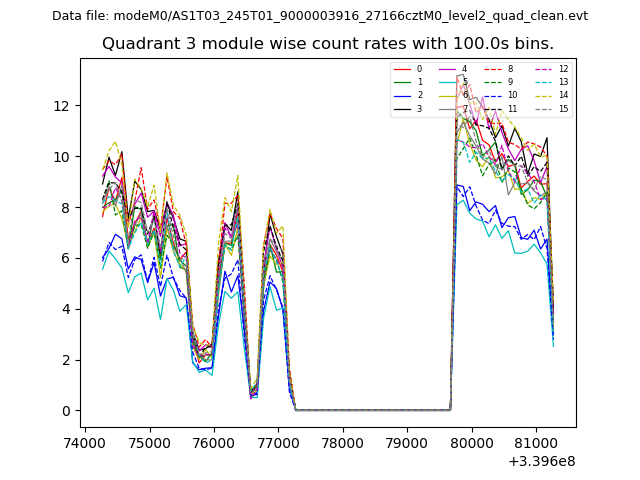 |
 |
| Parameter | Plot |
|---|---|
| CZT HV Monitor | 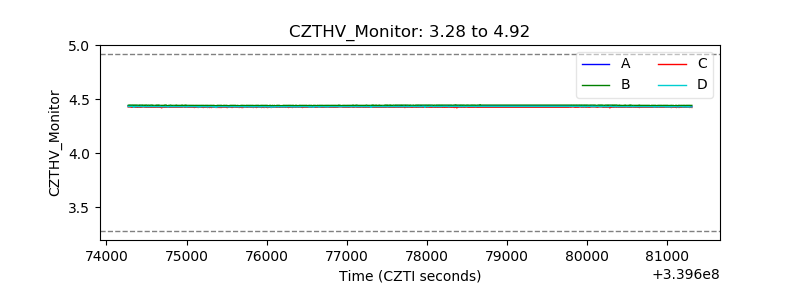 |
| D_VDD | 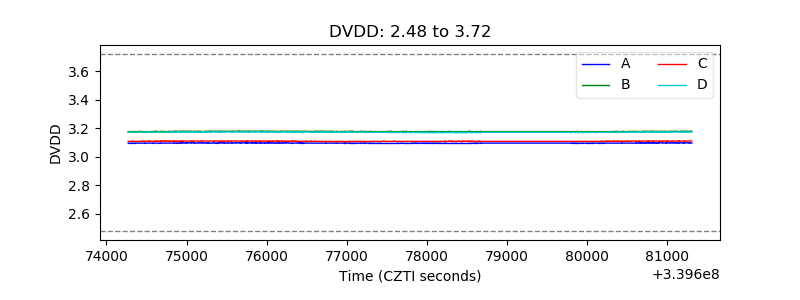 |
| Temperature 1 | 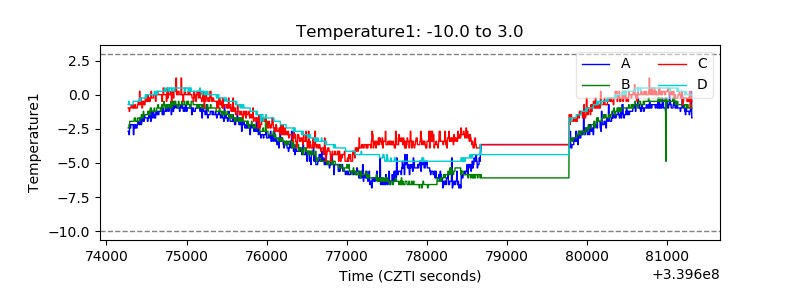 |
| Veto HV Monitor | 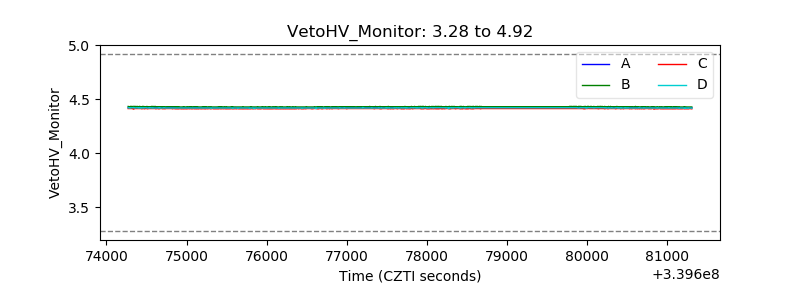 |
| Veto LLD | 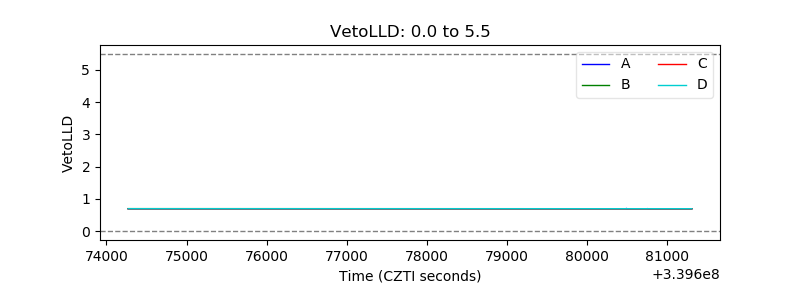 |
| Alpha Counter |  |
| _CPM_Rate | 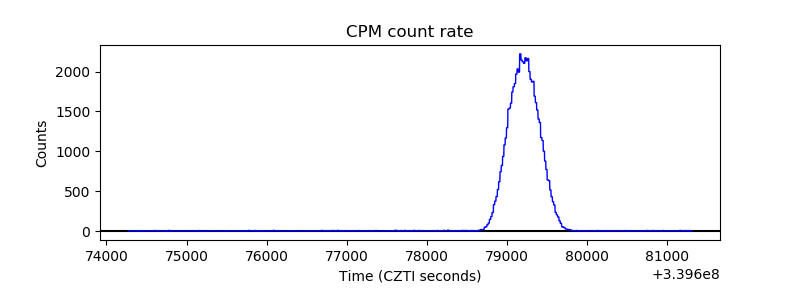 |
| CZT Counter | 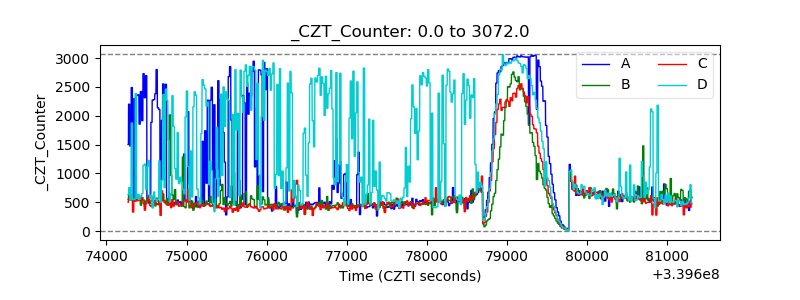 |
| +2.5 Volts monitor |  |
| +5 Volts monitor | 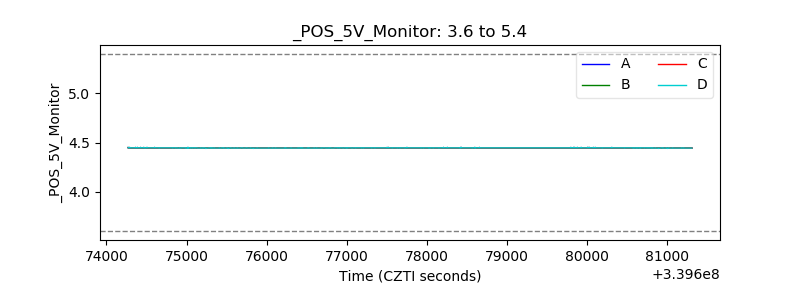 |
| _ROLL_ROT | 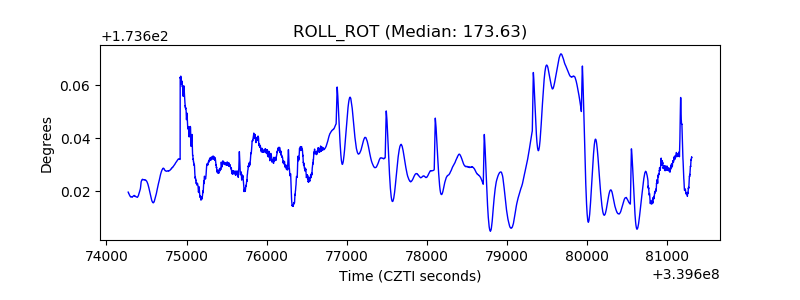 |
| _Roll_DEC | 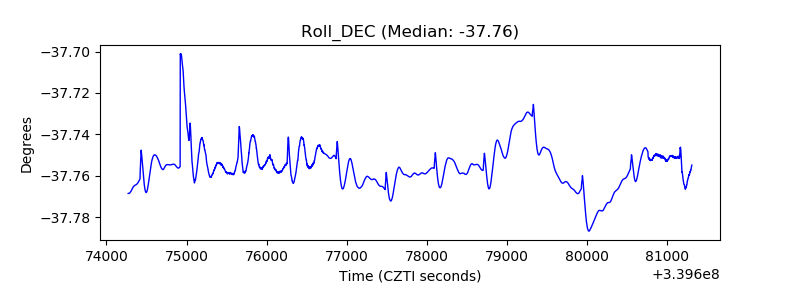 |
| _Roll_RA | 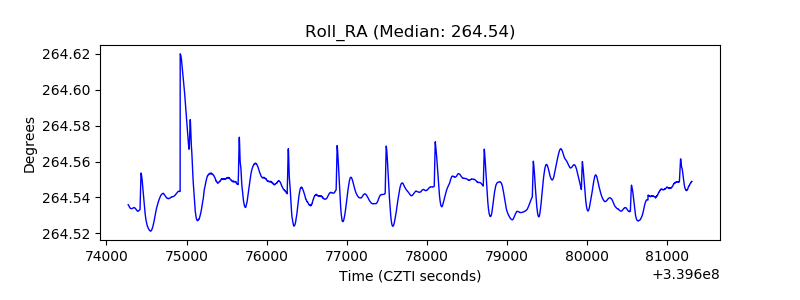 |
| Veto Counter | 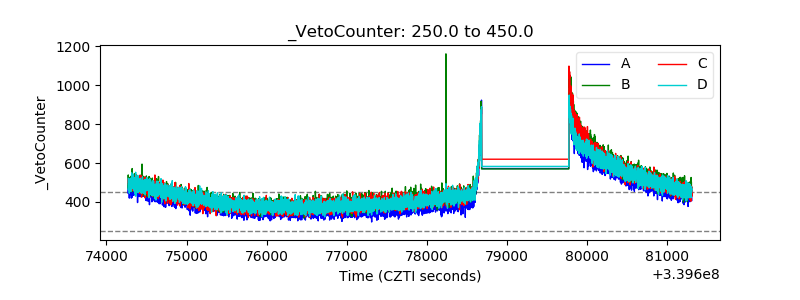 |