| Param | Original file | Final file |
|---|---|---|
| Filename | modeM0/AS1T03_245T01_9000003916_27167cztM0_level2.evt | modeM0/AS1T03_245T01_9000003916_27167cztM0_level2_quad_clean.evt |
| Size (bytes) | 507,723,840 | 98,976,960 |
| Size | 484.2 MB | 94.4 MB |
| Events in quadrant A | 3,314,060 | 671,717 |
| Events in quadrant B | 3,544,704 | 668,418 |
| Events in quadrant C | 3,099,889 | 631,397 |
| Events in quadrant D | 5,001,791 | 597,702 |
| Mode M0 | |||
|---|---|---|---|
| Quadrant | BADHDUFLAG | Total packets | Discarded packets |
| A | 0 | 13743 | 0 |
| B | 0 | 14544 | 0 |
| C | 0 | 13129 | 0 |
| D | 0 | 19031 | 0 |
| Mode M9 | |||
|---|---|---|---|
| Quadrant | BADHDUFLAG | Total packets | Discarded packets |
| A | 0 | 12 | 0 |
| B | 0 | 12 | 0 |
| C | 0 | 12 | 0 |
| D | 0 | 12 | 0 |
| Quadrant | Total seconds | Saturated seconds | Saturation percentage |
|---|---|---|---|
| A | 6136 | 60 | 0.977836% |
| B | 6137 | 97 | 1.580577% |
| C | 6137 | 78 | 1.270979% |
| D | 6137 | 486 | 7.919179% |
Noise dominated data is calculated using 1-second bins in cleaned event files. If a bin has >2000 counts, and if more than 50% of those come from <1% of pixels, then it is considered to be noise-dominated and hence unusable.
| Quadrant | # 1 sec bins | Bins with >0 counts | Bins with >2000 counts | High rate bins dominated by noise | Noise dominated (total time) | Noise dominated (detector-on time) | Marked lightcurve |
|---|---|---|---|---|---|---|---|
| A | 7351 | 6137 | 5 | 5 | 0.07% | 0.08% | 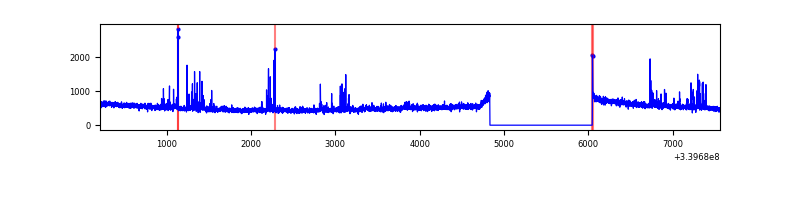 |
| B | 7352 | 6138 | 18 | 18 | 0.24% | 0.29% | 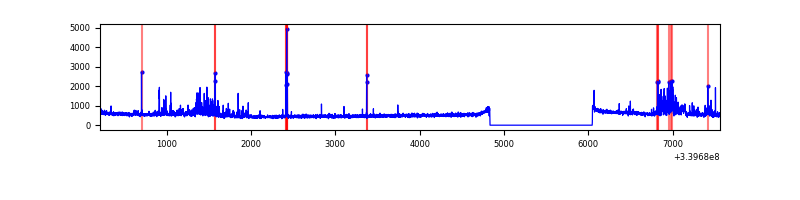 |
| C | 7352 | 6138 | 1 | 1 | 0.01% | 0.02% | 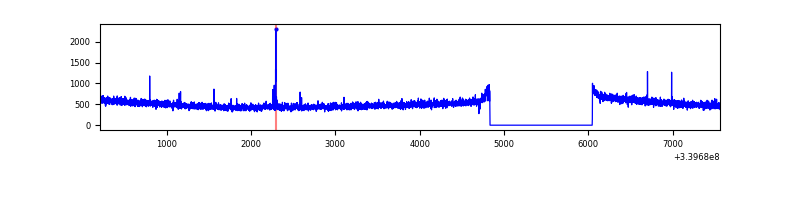 |
| D | 7352 | 6138 | 413 | 413 | 5.62% | 6.73% | 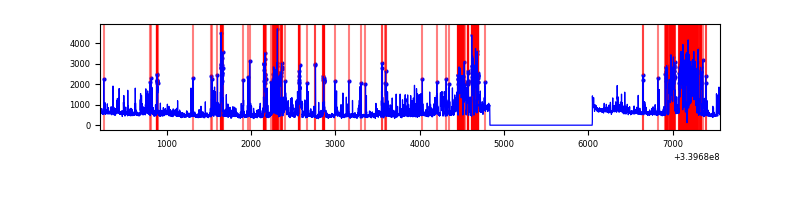 |
Top three noisy pixels from each quadrant. If the there are fewer than three noisy pixels in the level2.evt file, extra rows are filled as -1
| Pixel properties | Quadrant properties | ||||||
|---|---|---|---|---|---|---|---|
| Quadrant | DetID | PixID | Counts | Sigma | Mean | Median | Sigma |
| A | 13 | 248 | 93275 | 563.67 | 814 | 799 | 164.1 |
| A | 6 | 16 | 50642 | 303.81 | 814 | 799 | 164.1 |
| A | 4 | 2 | 19030 | 111.12 | 814 | 799 | 164.1 |
| B | 15 | 33 | 265247 | 1738.92 | 801 | 784 | 152.1 |
| B | 5 | 172 | 80950 | 527.11 | 801 | 784 | 152.1 |
| B | 0 | 182 | 26892 | 171.67 | 801 | 784 | 152.1 |
| C | 14 | 238 | 122789 | 693.41 | 757 | 760 | 176.0 |
| C | 15 | 208 | 13227 | 70.84 | 757 | 760 | 176.0 |
| C | 3 | 233 | 8598 | 44.54 | 757 | 760 | 176.0 |
| D | 1 | 52 | 1494584 | 7618.26 | 747 | 734 | 196.1 |
| D | 12 | 233 | 206957 | 1051.69 | 747 | 734 | 196.1 |
| D | 15 | 0 | 178825 | 908.22 | 747 | 734 | 196.1 |
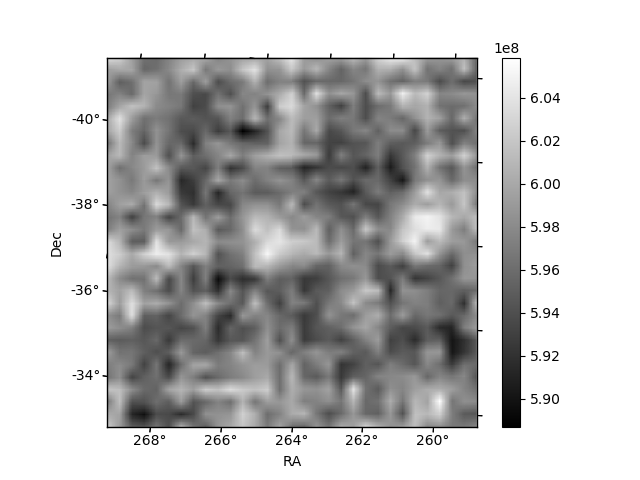
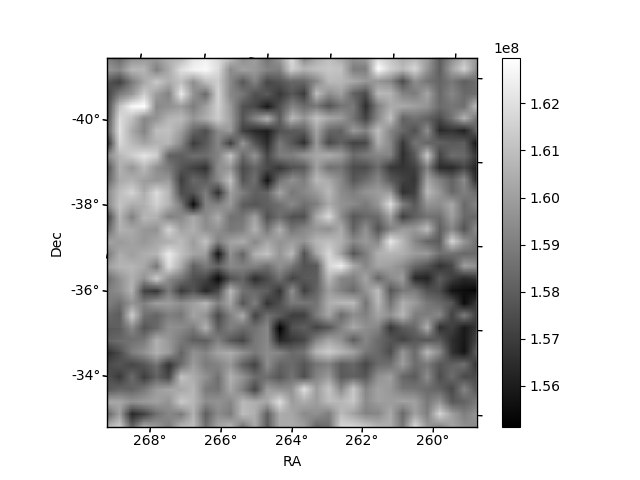
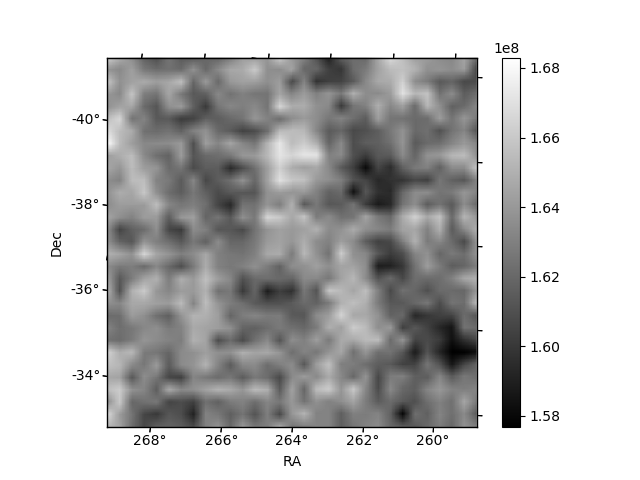
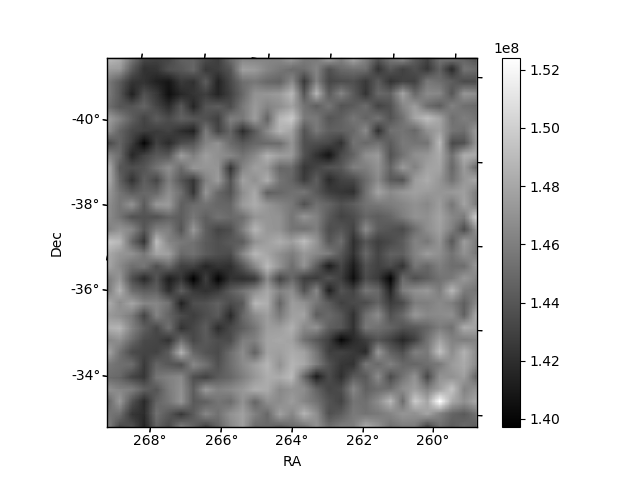
Histogram calculated using DETX and DETY for each event in the final _common_clean file
| Quadrant A | 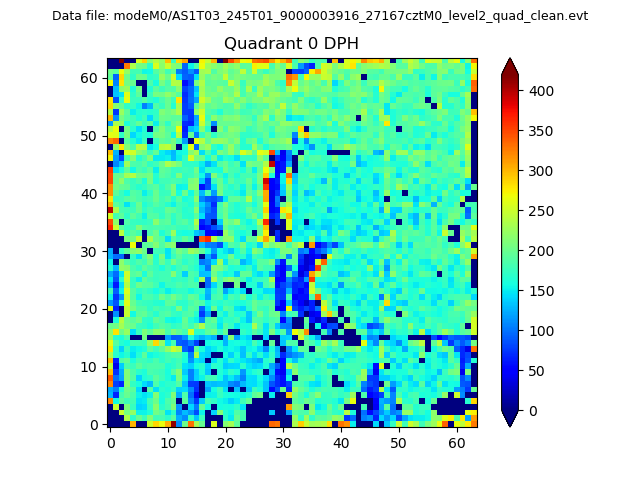 |
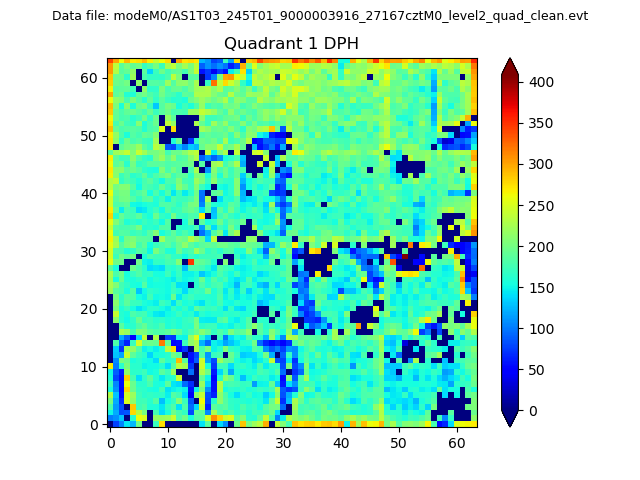 |
Quadrant B |
|---|---|---|---|
| Quadrant D | 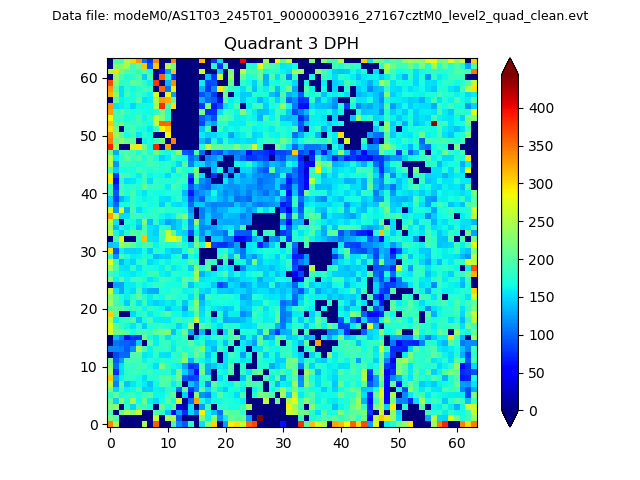 |
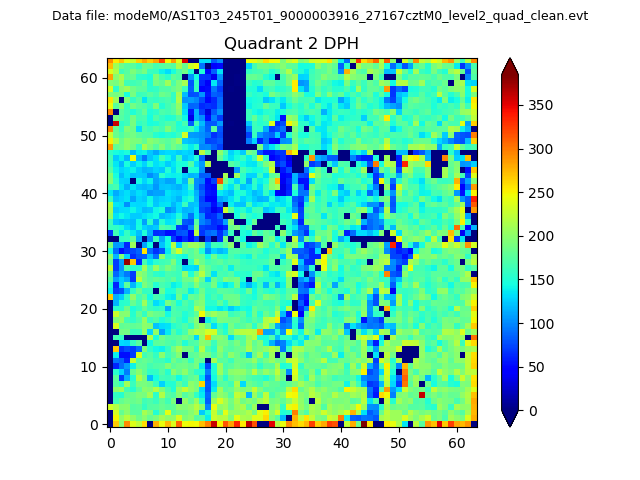 |
Quadrant C |
| Plot type | Count rate plots | Images |
|---|---|---|
| Comparison with Poisson distribution Blue bars denote a histogram of data divided into 1 sec bins. Red curve is a Poisson curve with rate = median count rate of data. |
 |
 |
| Quadrant-wise count rates Data is divided into 100 sec bins |
 |
|
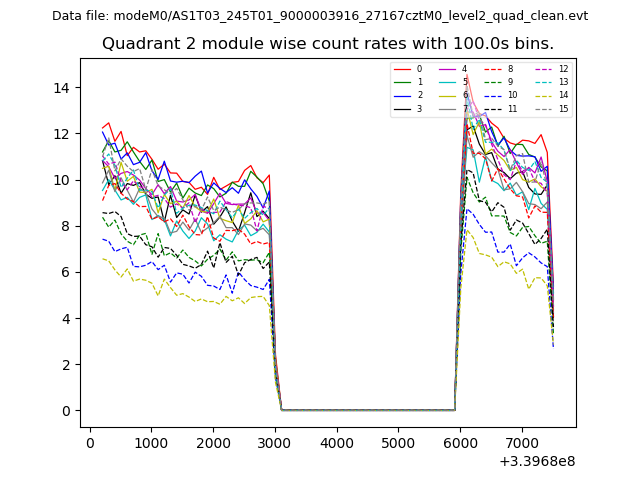
| Module-wise count rates for Quadrant A Data is divided into 100 sec bins |
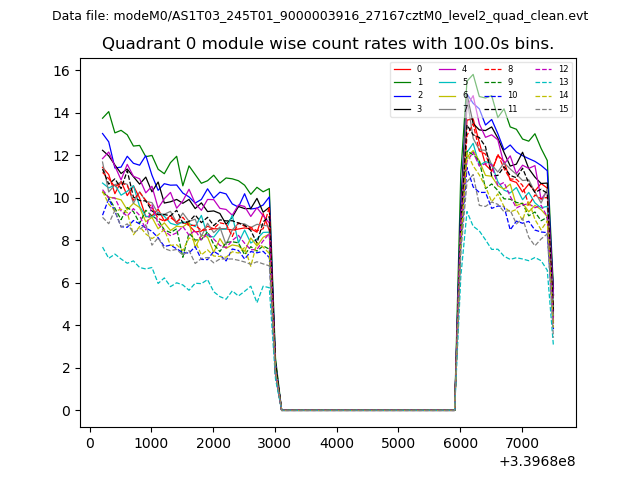 |
 |
| Module-wise count rates for Quadrant B Data is divided into 100 sec bins |
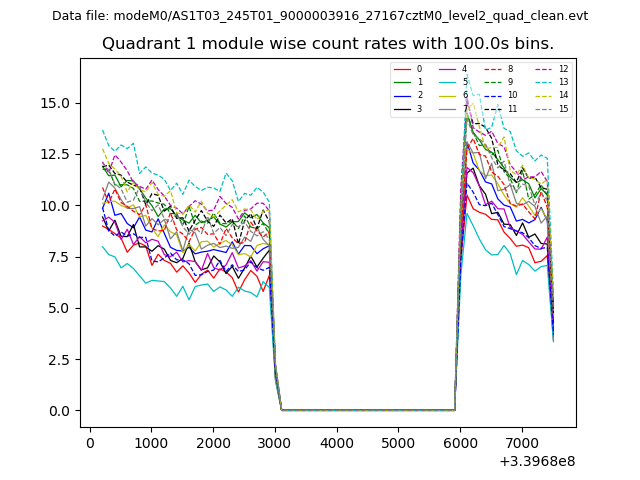 |
 |
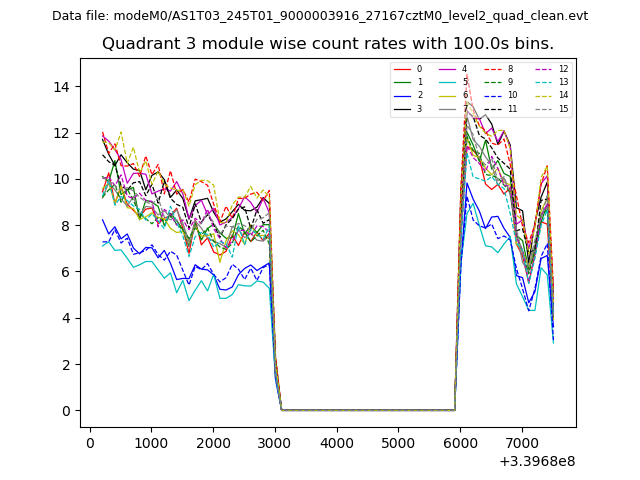
| Module-wise count rates for Quadrant C Data is divided into 100 sec bins |
 |
 |
| Module-wise count rates for Quadrant D Data is divided into 100 sec bins |
 |
 |
| Parameter | Plot |
|---|---|
| CZT HV Monitor | 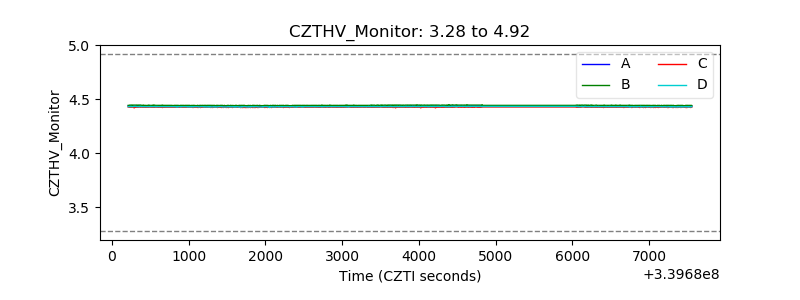 |
| D_VDD | 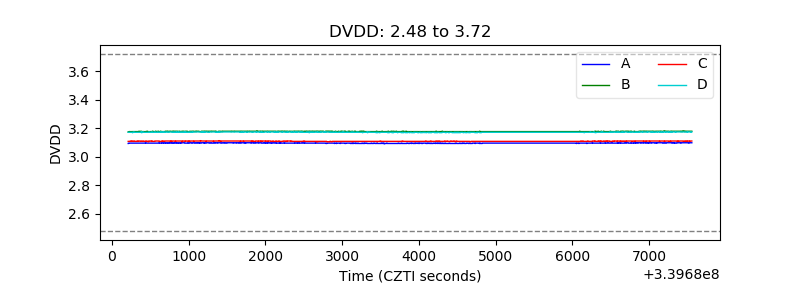 |
| Temperature 1 | 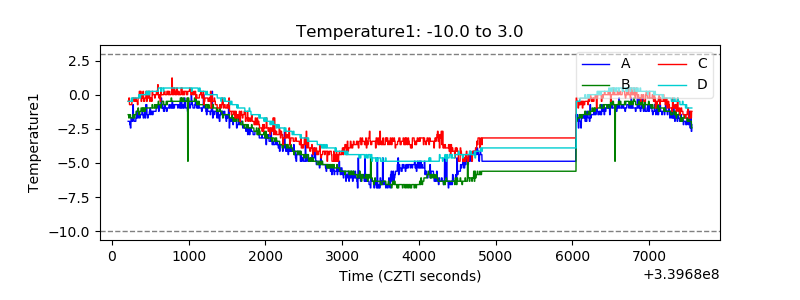 |
| Veto HV Monitor | 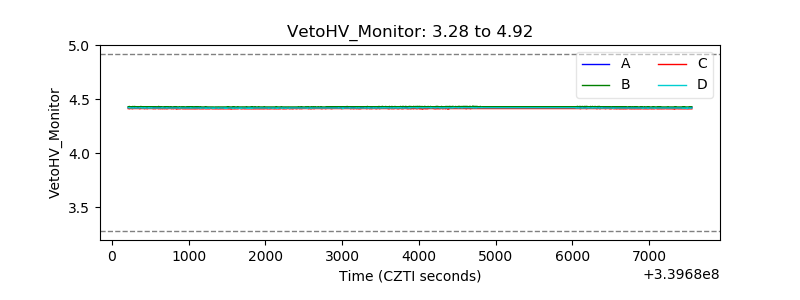 |
| Veto LLD | 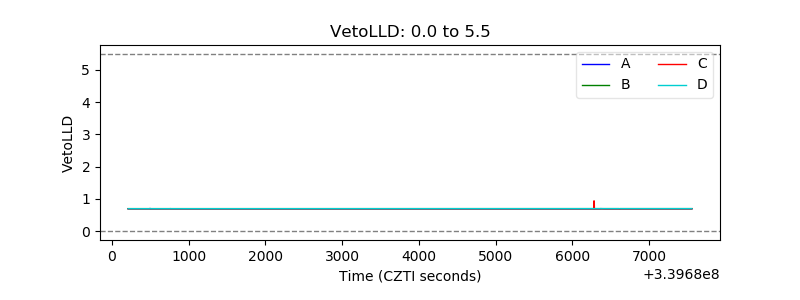 |
| Alpha Counter |  |
| _CPM_Rate |  |
| CZT Counter | 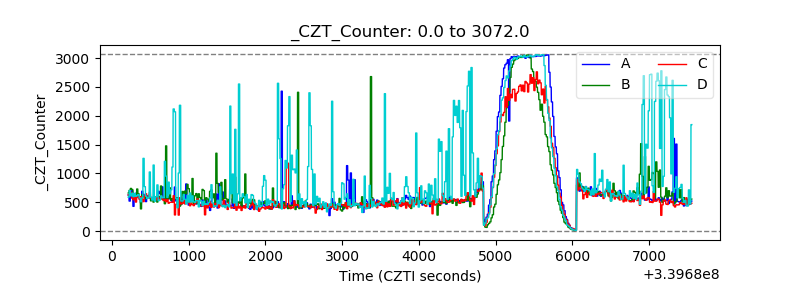 |
| +2.5 Volts monitor |  |
| +5 Volts monitor |  |
| _ROLL_ROT | 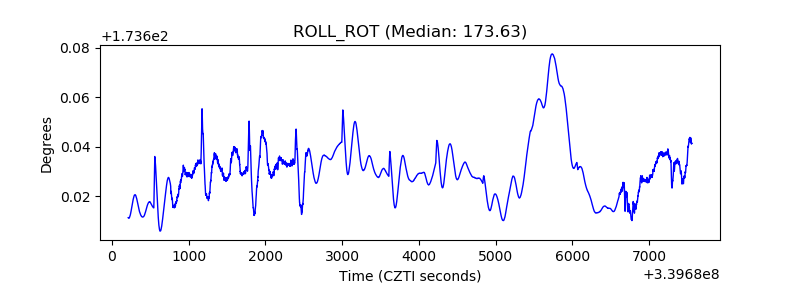 |
| _Roll_DEC | 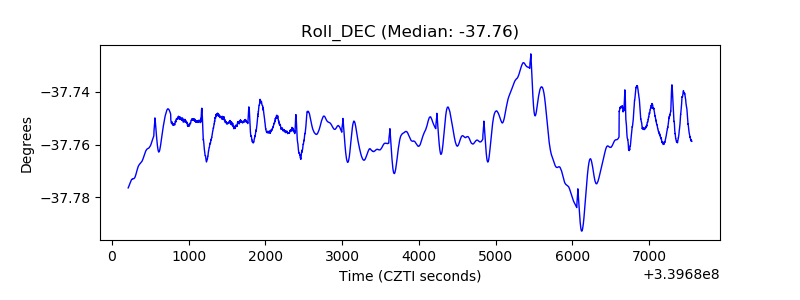 |
| _Roll_RA | 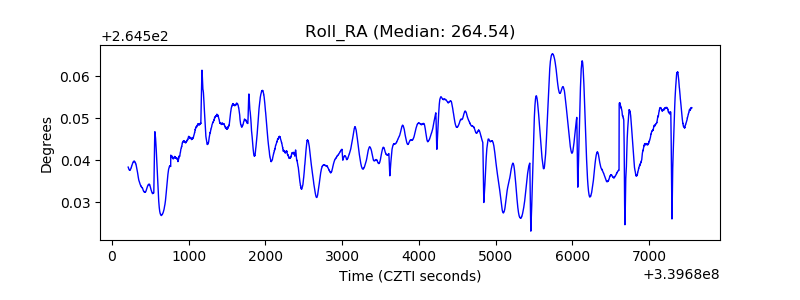 |
| Veto Counter | 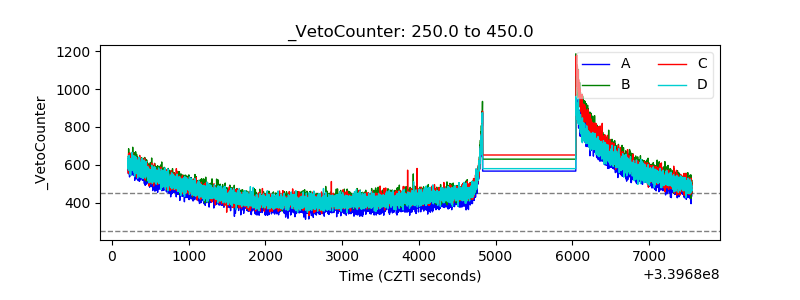 |