| Param | Original file | Final file |
|---|---|---|
| Filename | modeM0/AS1T03_245T01_9000003916_27168cztM0_level2.evt | modeM0/AS1T03_245T01_9000003916_27168cztM0_level2_quad_clean.evt |
| Size (bytes) | 478,756,800 | 88,836,480 |
| Size | 456.6 MB | 84.7 MB |
| Events in quadrant A | 3,121,036 | 596,851 |
| Events in quadrant B | 3,382,961 | 600,426 |
| Events in quadrant C | 2,979,811 | 559,533 |
| Events in quadrant D | 4,619,295 | 525,421 |
| Mode M0 | |||
|---|---|---|---|
| Quadrant | BADHDUFLAG | Total packets | Discarded packets |
| A | 0 | 12939 | 0 |
| B | 0 | 13823 | 0 |
| C | 0 | 12442 | 0 |
| D | 0 | 17552 | 0 |
| Mode M9 | |||
|---|---|---|---|
| Quadrant | BADHDUFLAG | Total packets | Discarded packets |
| A | 0 | 13 | 0 |
| B | 0 | 13 | 0 |
| C | 0 | 13 | 0 |
| D | 0 | 13 | 0 |
| Quadrant | Total seconds | Saturated seconds | Saturation percentage |
|---|---|---|---|
| A | 5832 | 72 | 1.234568% |
| B | 5833 | 98 | 1.680096% |
| C | 5833 | 101 | 1.731528% |
| D | 5833 | 442 | 7.577576% |
Noise dominated data is calculated using 1-second bins in cleaned event files. If a bin has >2000 counts, and if more than 50% of those come from <1% of pixels, then it is considered to be noise-dominated and hence unusable.
| Quadrant | # 1 sec bins | Bins with >0 counts | Bins with >2000 counts | High rate bins dominated by noise | Noise dominated (total time) | Noise dominated (detector-on time) | Marked lightcurve |
|---|---|---|---|---|---|---|---|
| A | 7142 | 5833 | 4 | 4 | 0.06% | 0.07% | 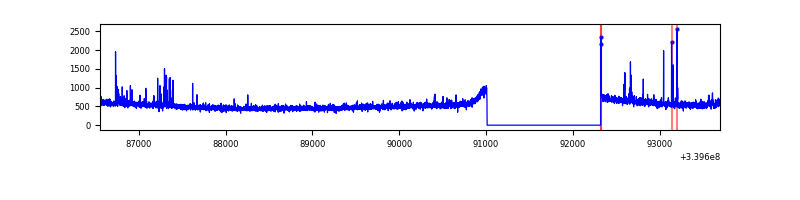 |
| B | 7143 | 5834 | 11 | 11 | 0.15% | 0.19% | 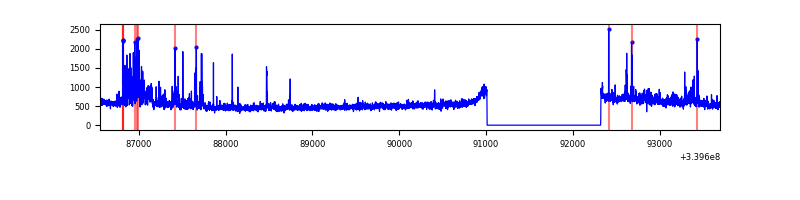 |
| C | 7143 | 5834 | 0 | 0 | 0.00% | 0.00% | 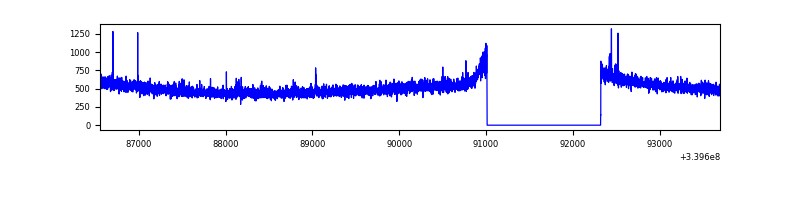 |
| D | 7143 | 5834 | 362 | 362 | 5.07% | 6.21% | 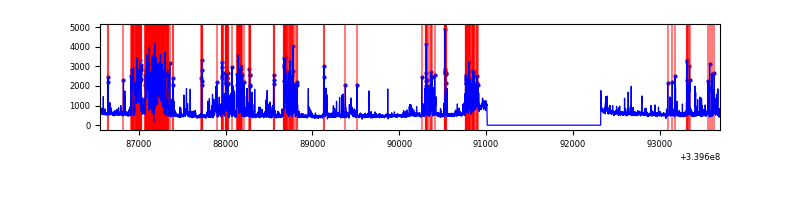 |
Top three noisy pixels from each quadrant. If the there are fewer than three noisy pixels in the level2.evt file, extra rows are filled as -1
| Pixel properties | Quadrant properties | ||||||
|---|---|---|---|---|---|---|---|
| Quadrant | DetID | PixID | Counts | Sigma | Mean | Median | Sigma |
| A | 13 | 248 | 59849 | 375.66 | 784 | 772 | 157.3 |
| A | 6 | 16 | 19451 | 118.78 | 784 | 772 | 157.3 |
| A | 13 | 254 | 9595 | 56.1 | 784 | 772 | 157.3 |
| B | 15 | 33 | 220187 | 1513.09 | 775 | 760 | 145.0 |
| B | 5 | 172 | 50908 | 345.8 | 775 | 760 | 145.0 |
| B | 0 | 190 | 28556 | 191.67 | 775 | 760 | 145.0 |
| C | 14 | 238 | 117676 | 687.42 | 730 | 737 | 170.1 |
| C | 15 | 208 | 15279 | 85.48 | 730 | 737 | 170.1 |
| C | 13 | 61 | 5090 | 25.59 | 730 | 737 | 170.1 |
| D | 1 | 52 | 1450900 | 7836.13 | 718 | 704 | 185.1 |
| D | 2 | 250 | 273500 | 1474.05 | 718 | 704 | 185.1 |
| D | 12 | 233 | 89398 | 479.26 | 718 | 704 | 185.1 |
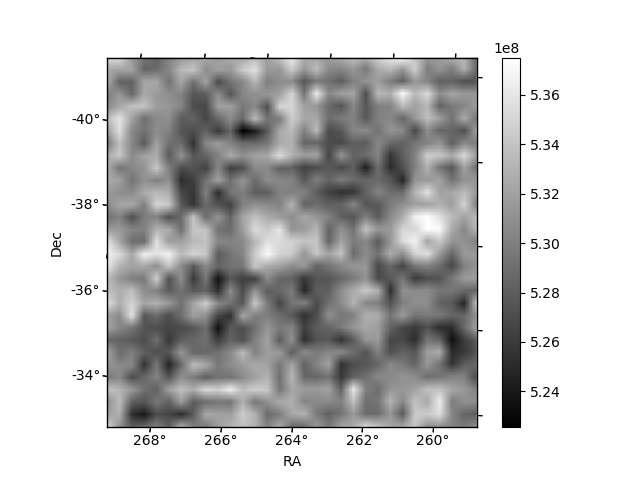
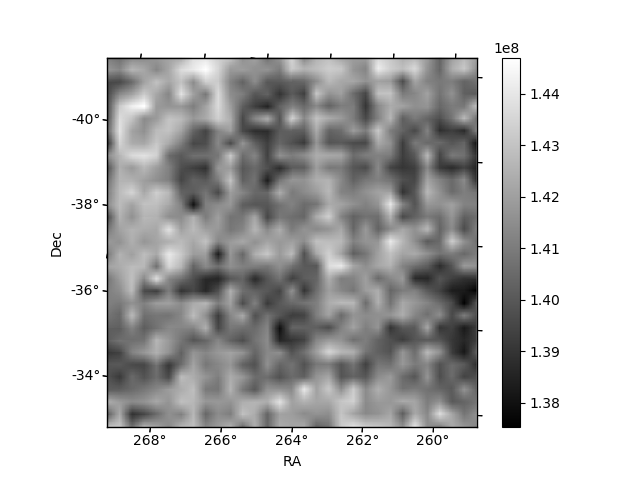
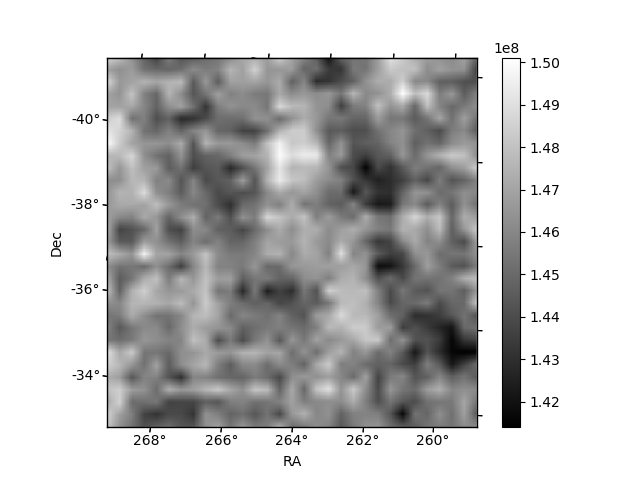
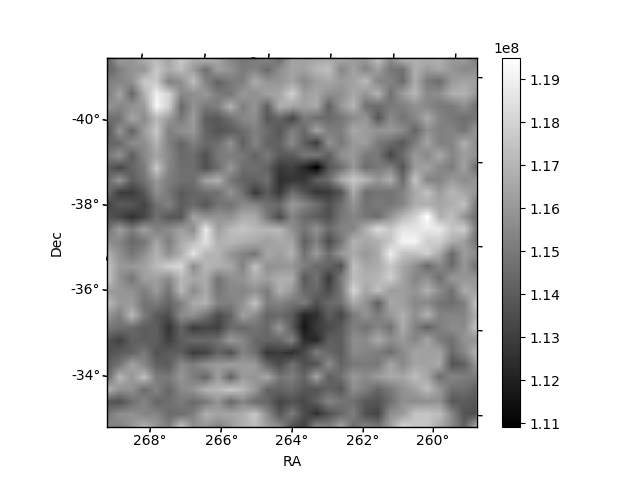
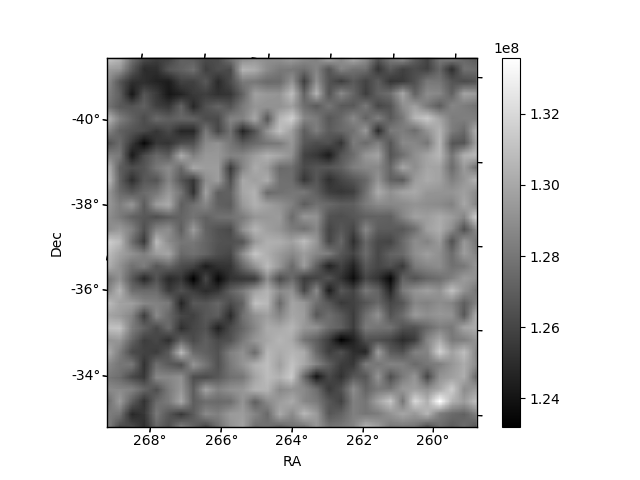
Histogram calculated using DETX and DETY for each event in the final _common_clean file
| Quadrant A | 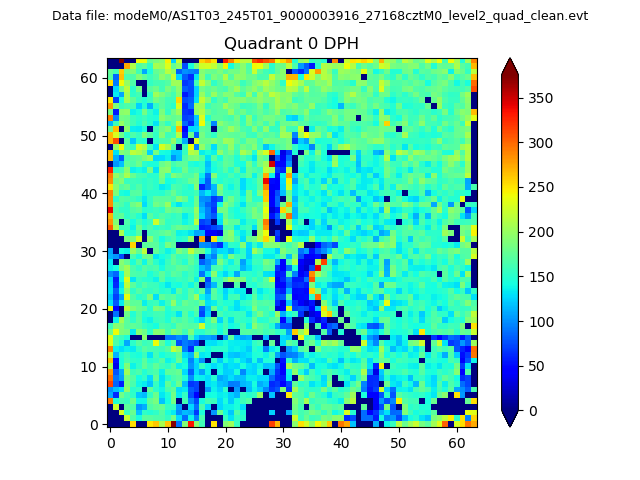 |
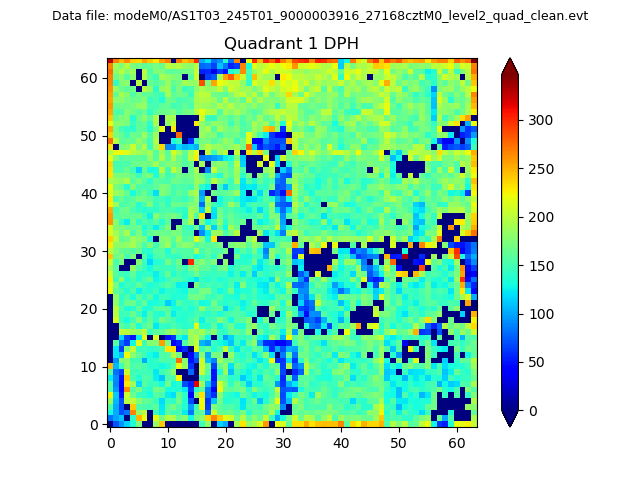 |
Quadrant B |
|---|---|---|---|
| Quadrant D | 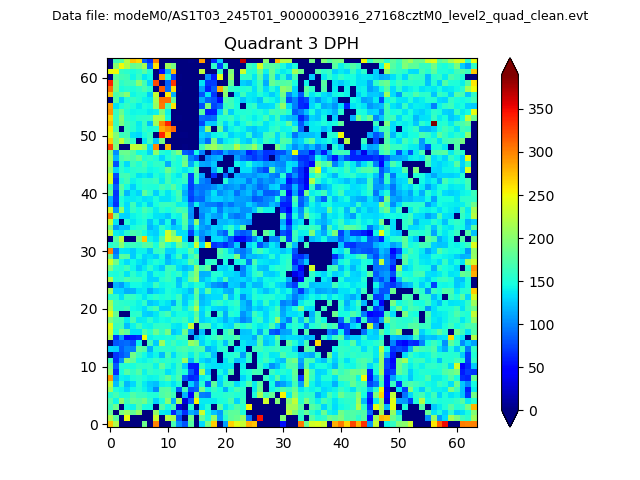 |
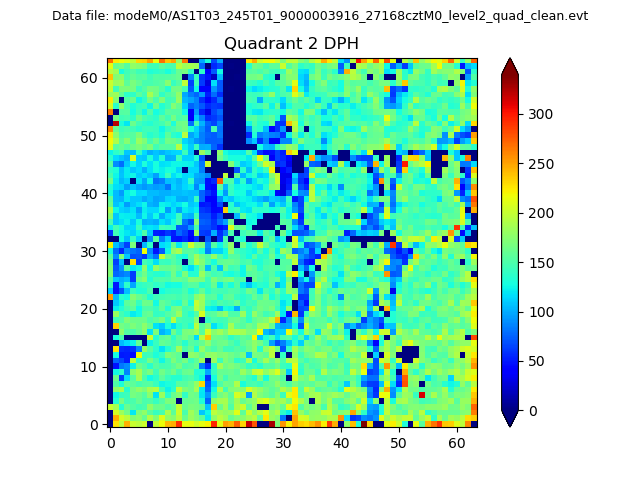 |
Quadrant C |
| Plot type | Count rate plots | Images |
|---|---|---|
| Comparison with Poisson distribution Blue bars denote a histogram of data divided into 1 sec bins. Red curve is a Poisson curve with rate = median count rate of data. |
 |
 |
| Quadrant-wise count rates Data is divided into 100 sec bins |
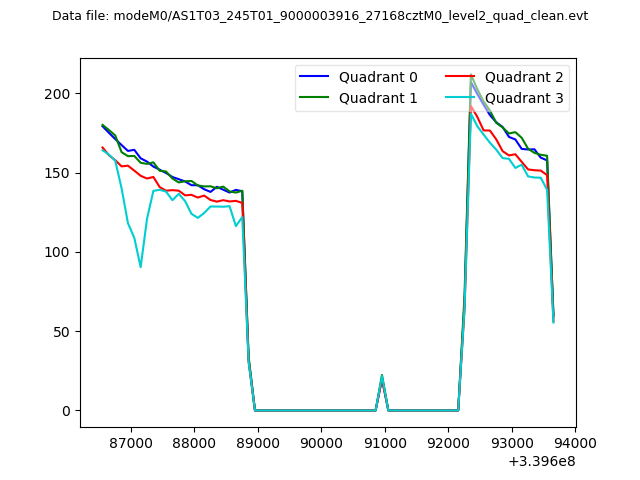 |
|
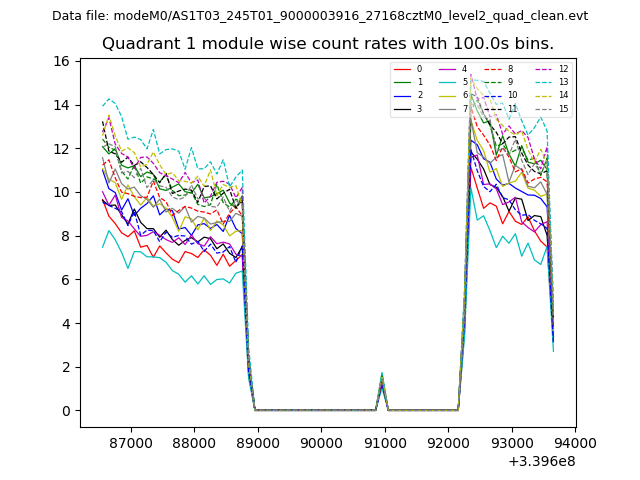
| Module-wise count rates for Quadrant A Data is divided into 100 sec bins |
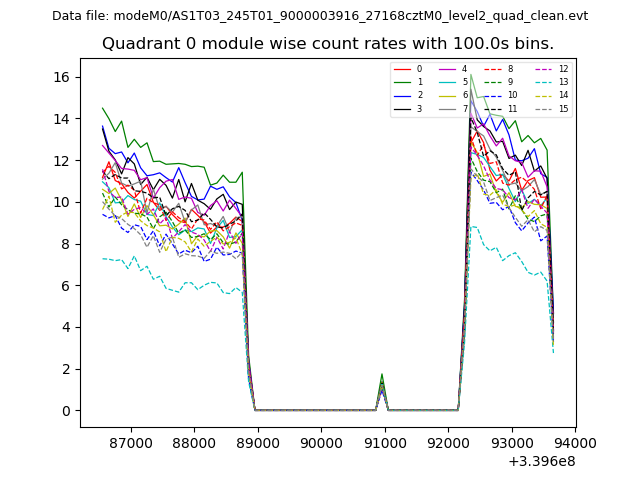 |
 |
| Module-wise count rates for Quadrant B Data is divided into 100 sec bins |
 |
 |
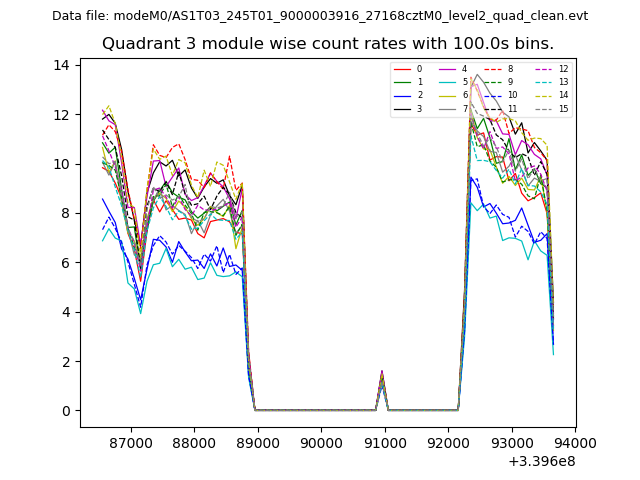
| Module-wise count rates for Quadrant C Data is divided into 100 sec bins |
 |
 |
| Module-wise count rates for Quadrant D Data is divided into 100 sec bins |
 |
 |
| Parameter | Plot |
|---|---|
| CZT HV Monitor | 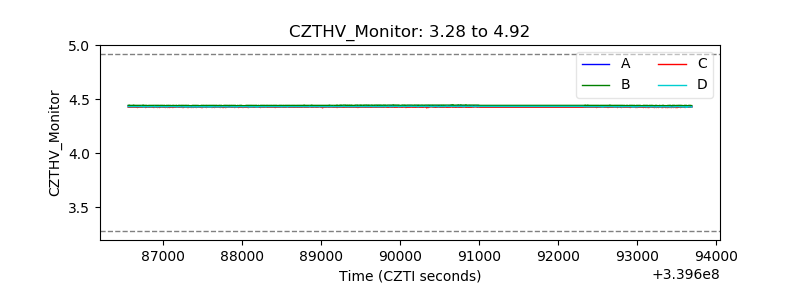 |
| D_VDD | 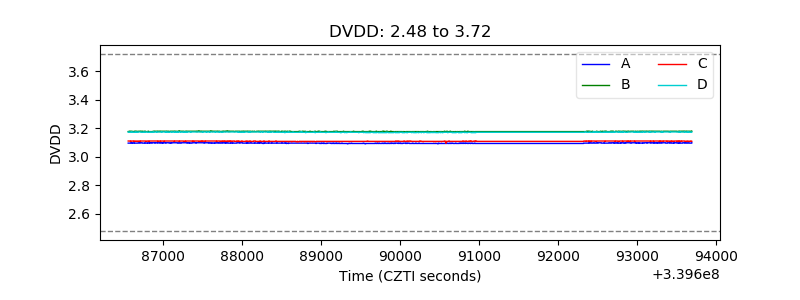 |
| Temperature 1 | 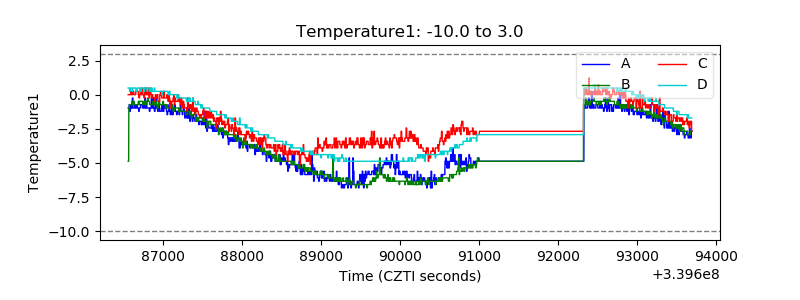 |
| Veto HV Monitor | 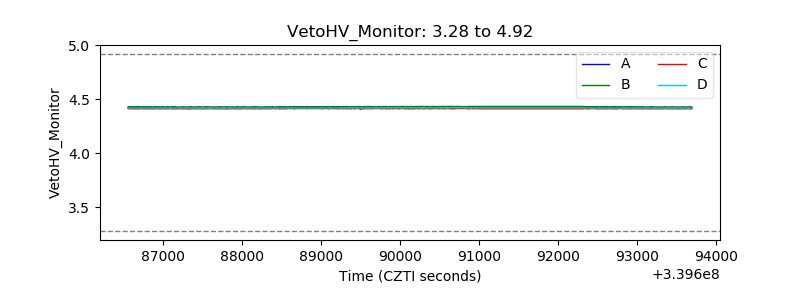 |
| Veto LLD | 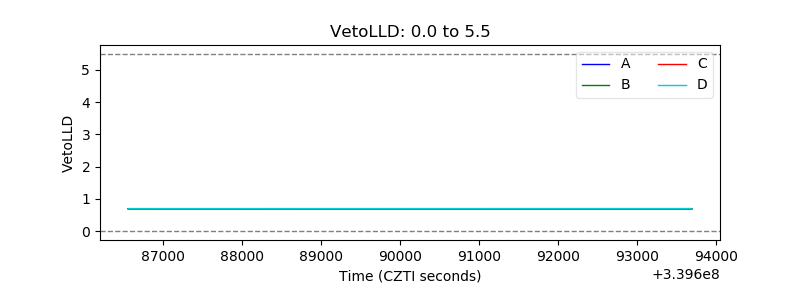 |
| Alpha Counter |  |
| _CPM_Rate | 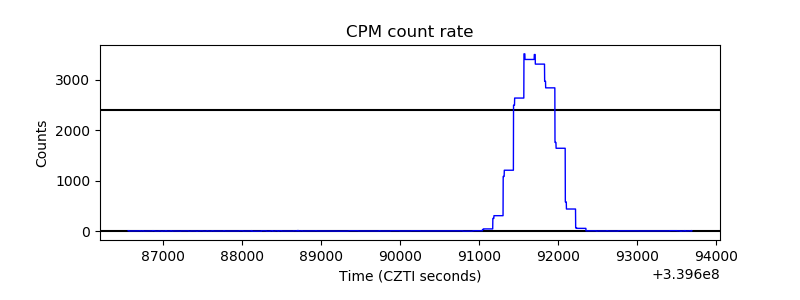 |
| CZT Counter |  |
| +2.5 Volts monitor |  |
| +5 Volts monitor |  |
| _ROLL_ROT | 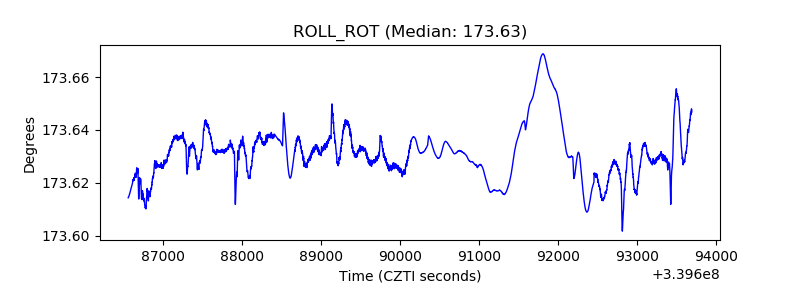 |
| _Roll_DEC | 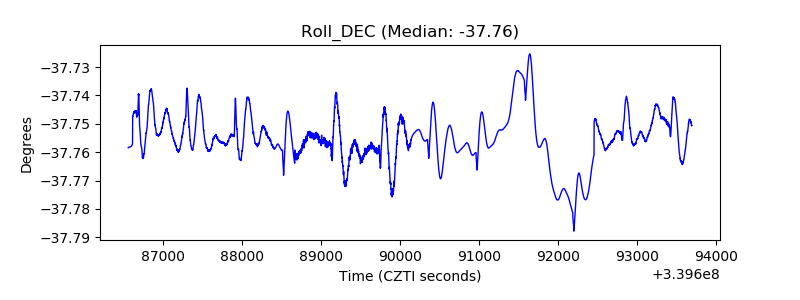 |
| _Roll_RA | 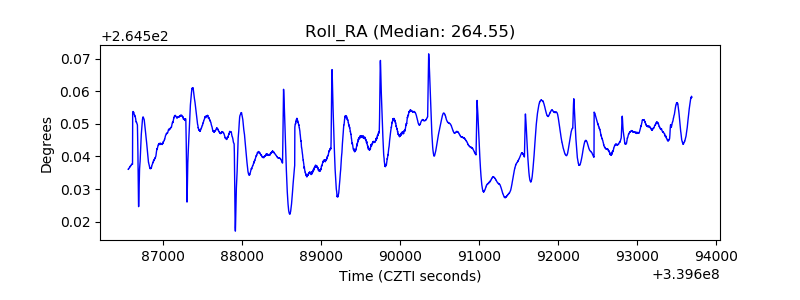 |
| Veto Counter | 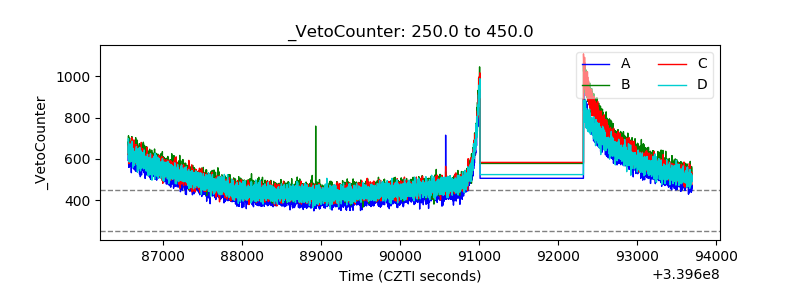 |