| Param | Original file | Final file |
|---|---|---|
| Filename | modeM0/AS1T03_245T01_9000003916_27169cztM0_level2.evt | modeM0/AS1T03_245T01_9000003916_27169cztM0_level2_quad_clean.evt |
| Size (bytes) | 514,987,200 | 94,636,800 |
| Size | 491.1 MB | 90.3 MB |
| Events in quadrant A | 3,361,956 | 639,509 |
| Events in quadrant B | 3,536,982 | 650,234 |
| Events in quadrant C | 3,130,764 | 607,302 |
| Events in quadrant D | 5,157,470 | 547,315 |
| Mode M0 | |||
|---|---|---|---|
| Quadrant | BADHDUFLAG | Total packets | Discarded packets |
| A | 0 | 13772 | 0 |
| B | 0 | 14361 | 0 |
| C | 0 | 12956 | 0 |
| D | 0 | 19324 | 0 |
| Mode M9 | |||
|---|---|---|---|
| Quadrant | BADHDUFLAG | Total packets | Discarded packets |
| A | 0 | 13 | 0 |
| B | 0 | 13 | 0 |
| C | 0 | 13 | 0 |
| D | 0 | 13 | 0 |
| Quadrant | Total seconds | Saturated seconds | Saturation percentage |
|---|---|---|---|
| A | 6036 | 74 | 1.225977% |
| B | 6037 | 74 | 1.225774% |
| C | 6037 | 98 | 1.623323% |
| D | 6037 | 690 | 11.429518% |
Noise dominated data is calculated using 1-second bins in cleaned event files. If a bin has >2000 counts, and if more than 50% of those come from <1% of pixels, then it is considered to be noise-dominated and hence unusable.
| Quadrant | # 1 sec bins | Bins with >0 counts | Bins with >2000 counts | High rate bins dominated by noise | Noise dominated (total time) | Noise dominated (detector-on time) | Marked lightcurve |
|---|---|---|---|---|---|---|---|
| A | 7381 | 6037 | 8 | 8 | 0.11% | 0.13% | 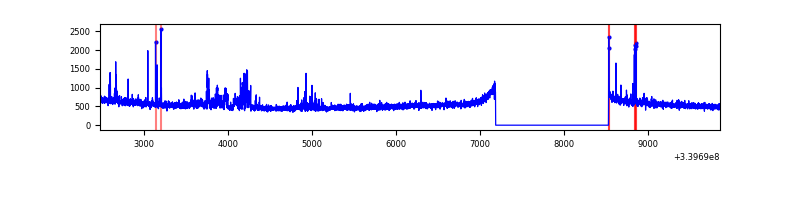 |
| B | 7382 | 6038 | 3 | 3 | 0.04% | 0.05% | 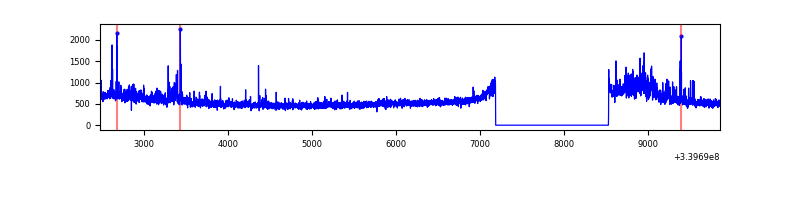 |
| C | 7382 | 6038 | 0 | 0 | 0.00% | 0.00% | 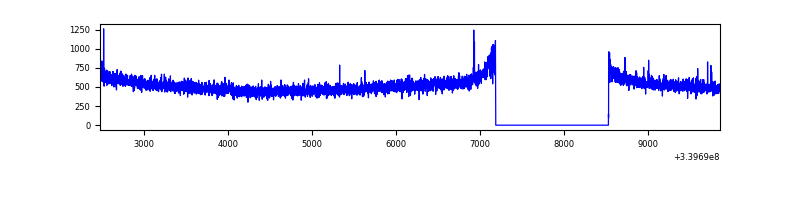 |
| D | 7382 | 6038 | 536 | 536 | 7.26% | 8.88% | 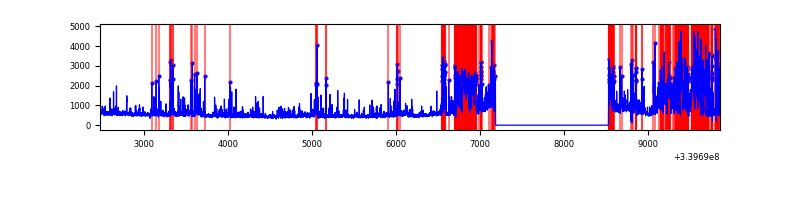 |
Top three noisy pixels from each quadrant. If the there are fewer than three noisy pixels in the level2.evt file, extra rows are filled as -1
| Pixel properties | Quadrant properties | ||||||
|---|---|---|---|---|---|---|---|
| Quadrant | DetID | PixID | Counts | Sigma | Mean | Median | Sigma |
| A | 6 | 16 | 124027 | 755.11 | 822 | 810 | 163.2 |
| A | 13 | 248 | 44439 | 267.37 | 822 | 810 | 163.2 |
| A | 14 | 235 | 16207 | 94.36 | 822 | 810 | 163.2 |
| B | 15 | 33 | 193998 | 1268.1 | 816 | 799 | 152.4 |
| B | 12 | 18 | 29003 | 185.12 | 816 | 799 | 152.4 |
| B | 5 | 172 | 28449 | 181.48 | 816 | 799 | 152.4 |
| C | 14 | 238 | 125279 | 693.86 | 768 | 775 | 179.4 |
| C | 15 | 208 | 10282 | 52.98 | 768 | 775 | 179.4 |
| C | 13 | 61 | 5394 | 25.74 | 768 | 775 | 179.4 |
| D | 1 | 52 | 1848771 | 9815.91 | 732 | 716 | 188.3 |
| D | 2 | 250 | 226436 | 1198.91 | 732 | 716 | 188.3 |
| D | 12 | 233 | 210821 | 1115.97 | 732 | 716 | 188.3 |
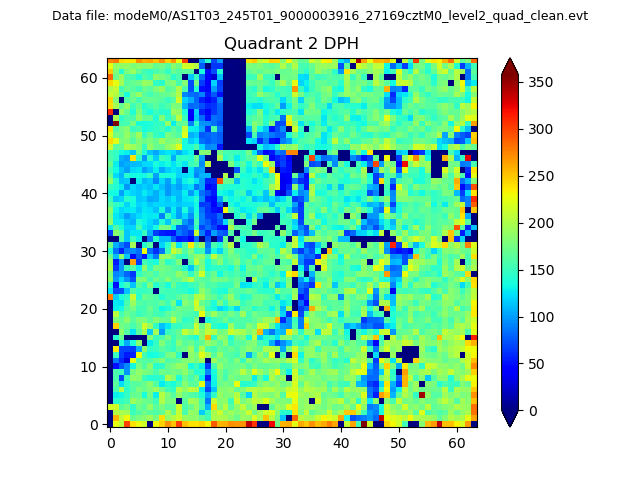
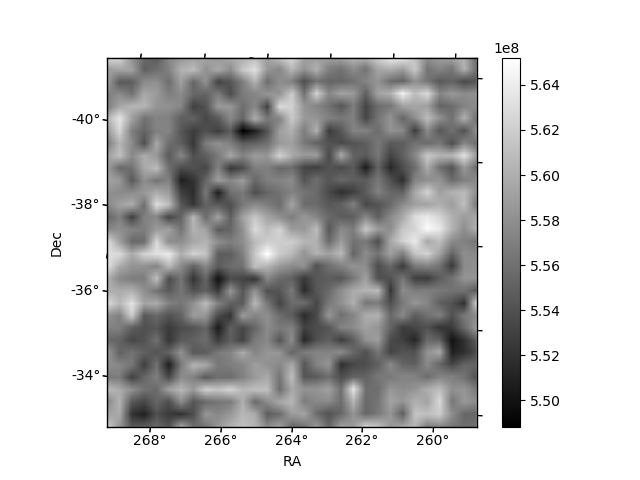
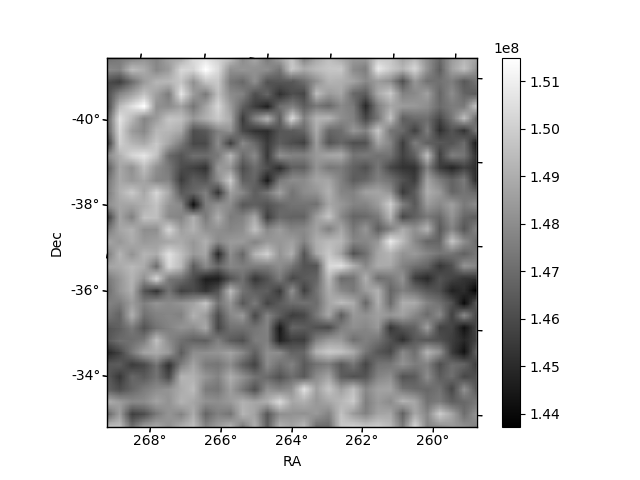
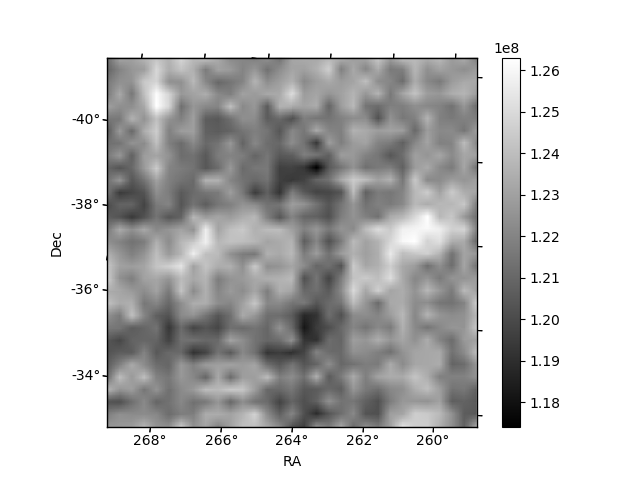
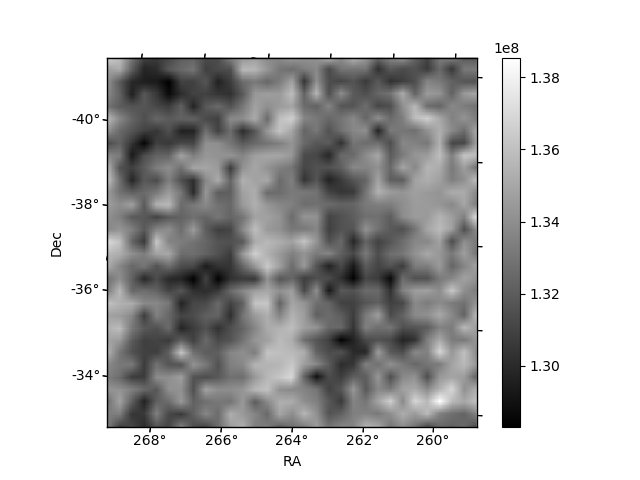
Histogram calculated using DETX and DETY for each event in the final _common_clean file
| Quadrant A | 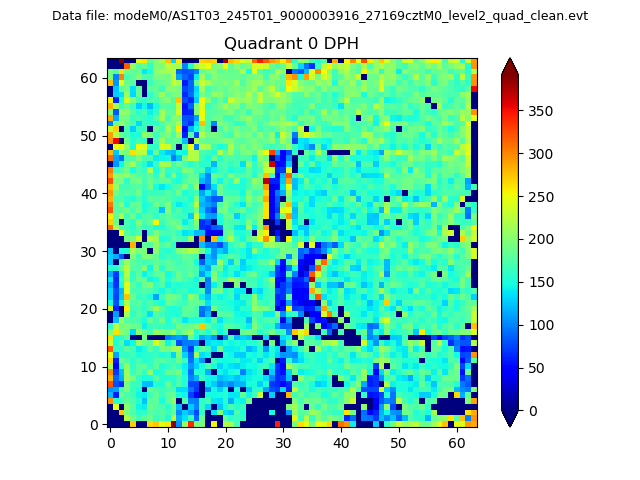 |
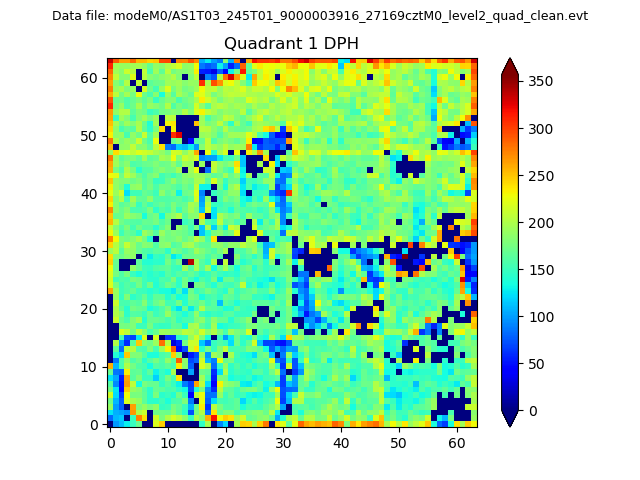 |
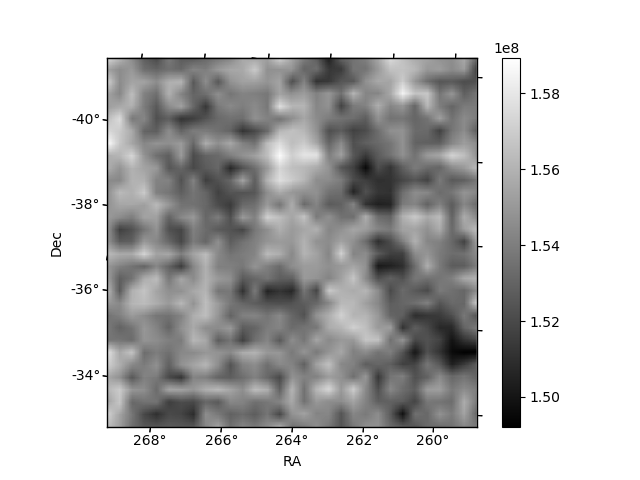
Quadrant B |
|---|---|---|---|
| Quadrant D | 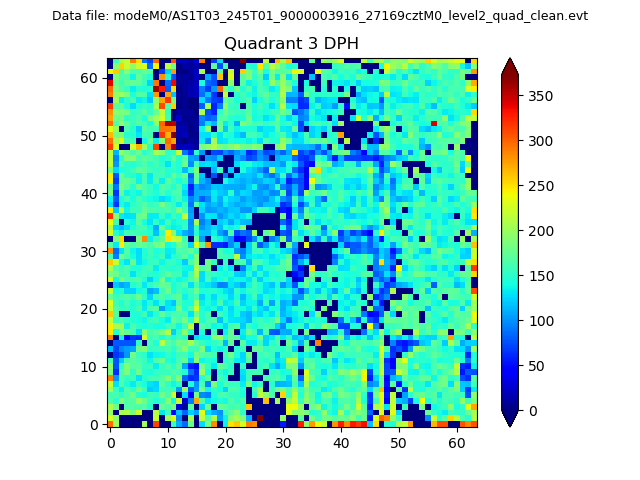 |
 |
Quadrant C |
| Plot type | Count rate plots | Images |
|---|---|---|
| Comparison with Poisson distribution Blue bars denote a histogram of data divided into 1 sec bins. Red curve is a Poisson curve with rate = median count rate of data. |
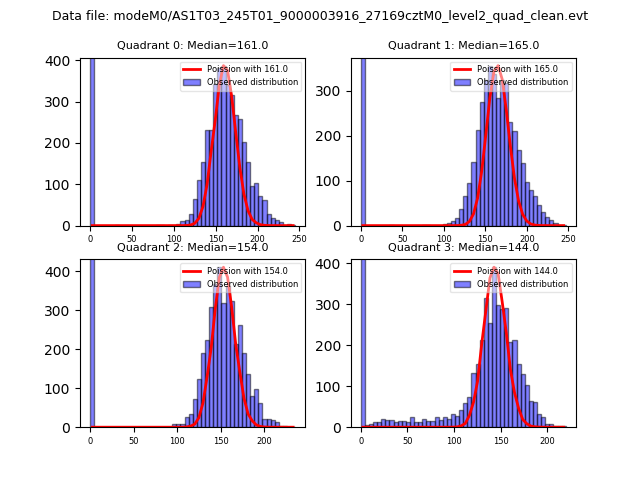 |
 |
| Quadrant-wise count rates Data is divided into 100 sec bins |
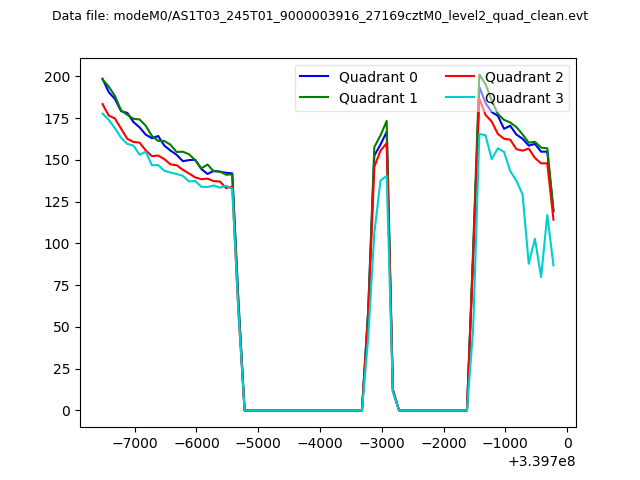 |
|
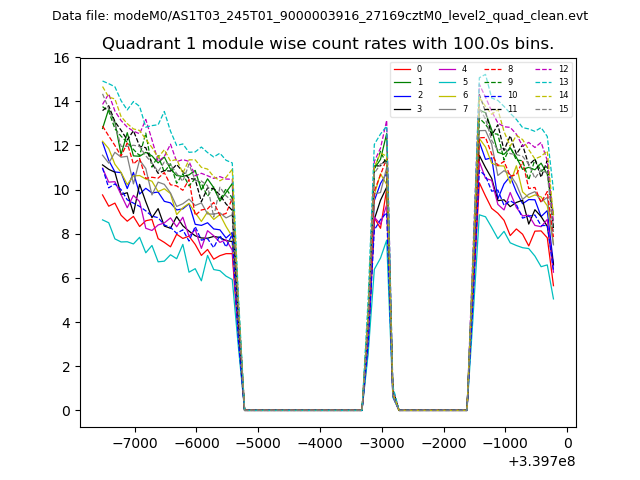
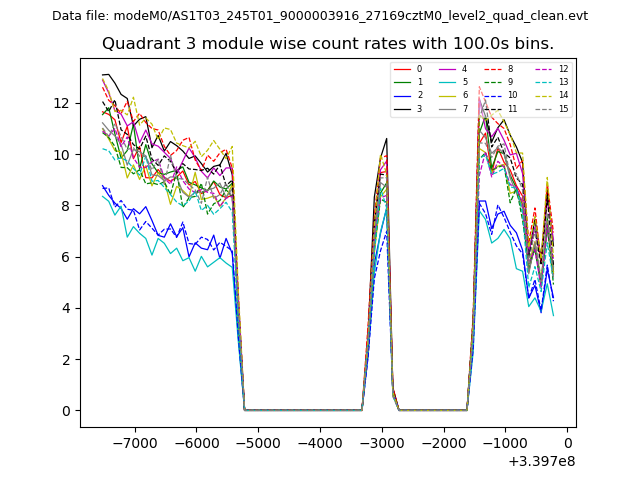
| Module-wise count rates for Quadrant A Data is divided into 100 sec bins |
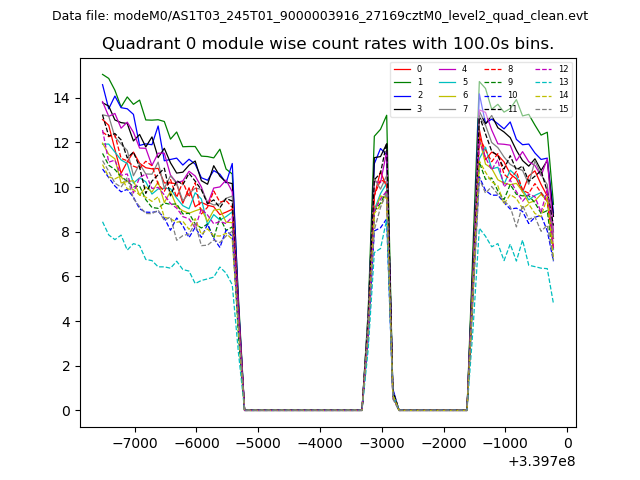 |
 |
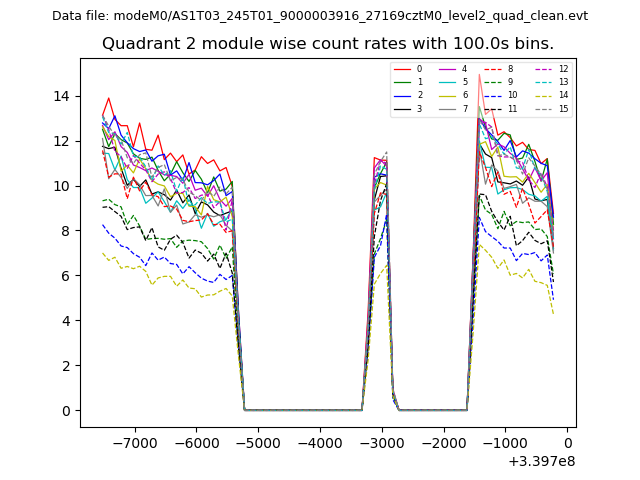
| Module-wise count rates for Quadrant B Data is divided into 100 sec bins |
 |
 |
| Module-wise count rates for Quadrant C Data is divided into 100 sec bins |
 |
 |
| Module-wise count rates for Quadrant D Data is divided into 100 sec bins |
 |
 |
| Parameter | Plot |
|---|---|
| CZT HV Monitor |  |
| D_VDD | 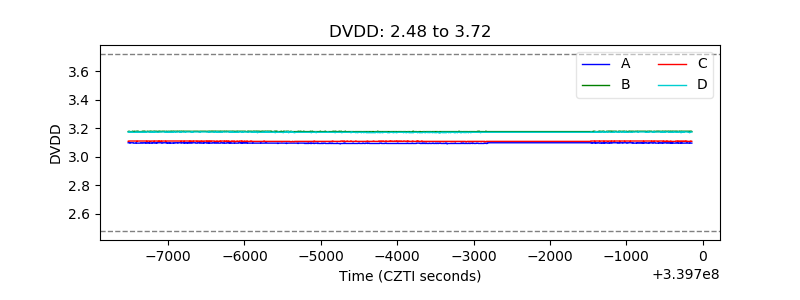 |
| Temperature 1 | 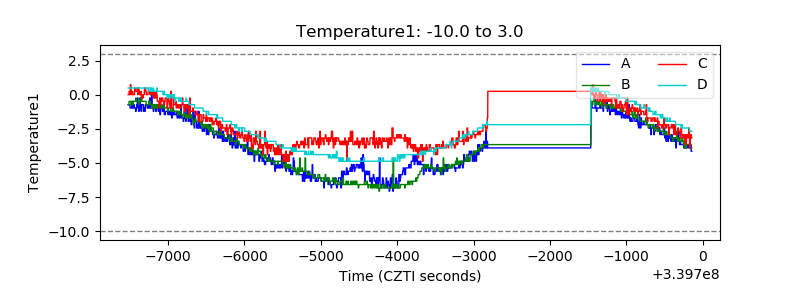 |
| Veto HV Monitor | 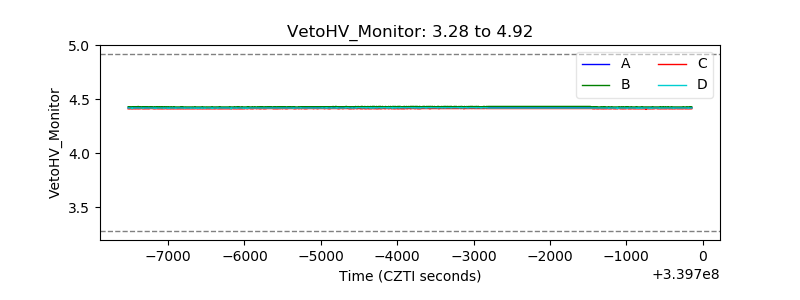 |
| Veto LLD | 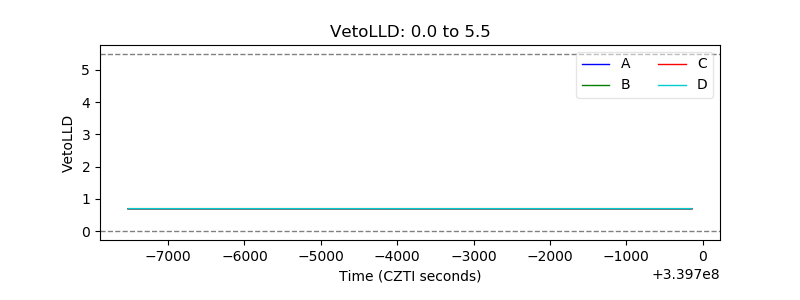 |
| Alpha Counter | 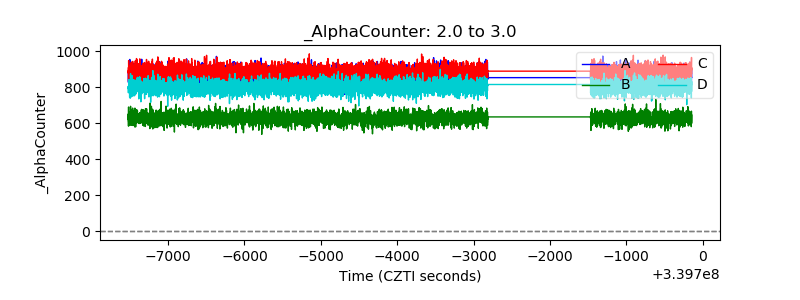 |
| _CPM_Rate | 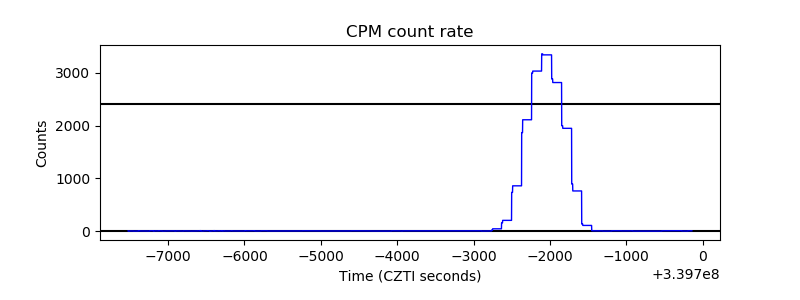 |
| CZT Counter | 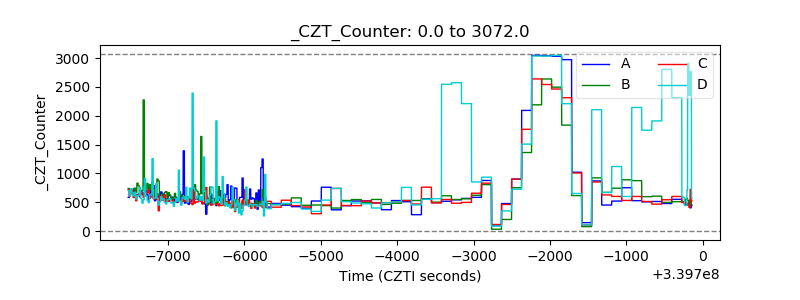 |
| +2.5 Volts monitor | 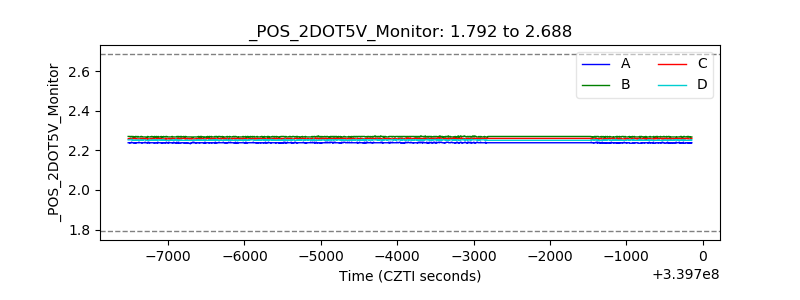 |
| +5 Volts monitor |  |
| _ROLL_ROT | 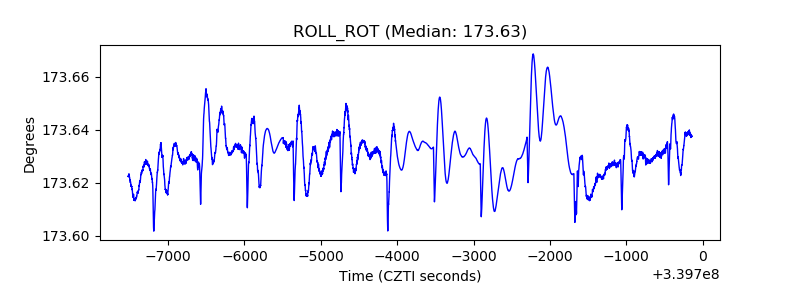 |
| _Roll_DEC | 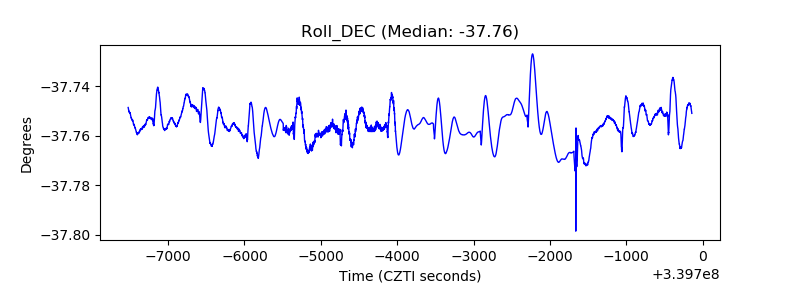 |
| _Roll_RA | 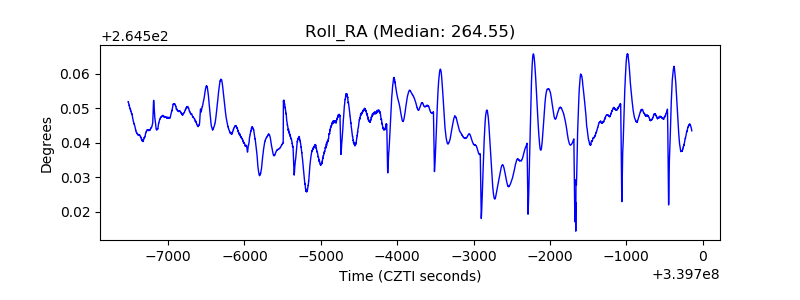 |
| Veto Counter | 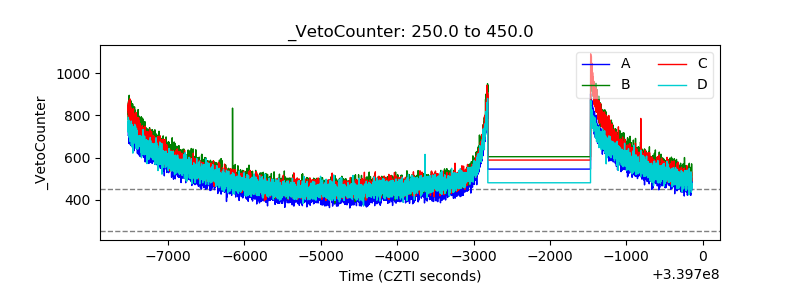 |