| Param | Original file | Final file |
|---|---|---|
| Filename | modeM0/AS1T03_245T01_9000003916_27170cztM0_level2.evt | modeM0/AS1T03_245T01_9000003916_27170cztM0_level2_quad_clean.evt |
| Size (bytes) | 493,830,720 | 90,838,080 |
| Size | 471.0 MB | 86.6 MB |
| Events in quadrant A | 3,235,427 | 604,112 |
| Events in quadrant B | 3,649,276 | 614,669 |
| Events in quadrant C | 3,046,145 | 582,103 |
| Events in quadrant D | 4,617,484 | 530,317 |
| Mode M0 | |||
|---|---|---|---|
| Quadrant | BADHDUFLAG | Total packets | Discarded packets |
| A | 0 | 13239 | 0 |
| B | 0 | 14586 | 0 |
| C | 0 | 12648 | 0 |
| D | 0 | 17718 | 0 |
| Mode M9 | |||
|---|---|---|---|
| Quadrant | BADHDUFLAG | Total packets | Discarded packets |
| A | 0 | 14 | 0 |
| B | 0 | 14 | 0 |
| C | 0 | 14 | 0 |
| D | 0 | 14 | 0 |
| Quadrant | Total seconds | Saturated seconds | Saturation percentage |
|---|---|---|---|
| A | 6005 | 56 | 0.932556% |
| B | 6006 | 149 | 2.480852% |
| C | 6005 | 83 | 1.382182% |
| D | 6005 | 362 | 6.028310% |
Noise dominated data is calculated using 1-second bins in cleaned event files. If a bin has >2000 counts, and if more than 50% of those come from <1% of pixels, then it is considered to be noise-dominated and hence unusable.
| Quadrant | # 1 sec bins | Bins with >0 counts | Bins with >2000 counts | High rate bins dominated by noise | Noise dominated (total time) | Noise dominated (detector-on time) | Marked lightcurve |
|---|---|---|---|---|---|---|---|
| A | 7340 | 6006 | 19 | 19 | 0.26% | 0.32% | 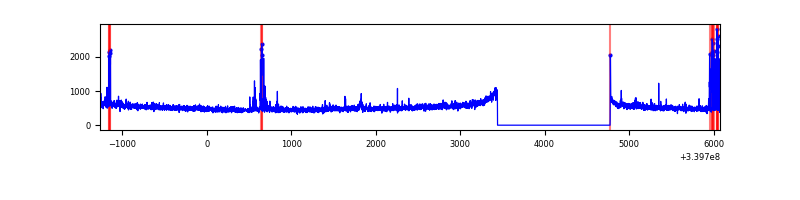 |
| B | 7341 | 6007 | 25 | 25 | 0.34% | 0.42% | 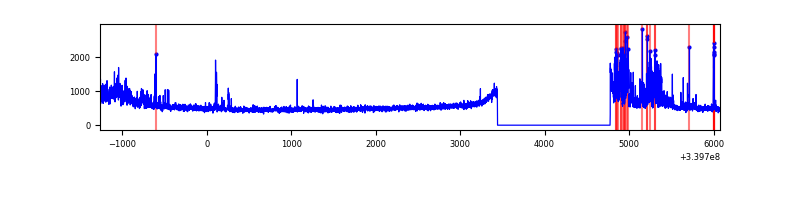 |
| C | 7340 | 6006 | 0 | 0 | 0.00% | 0.00% | 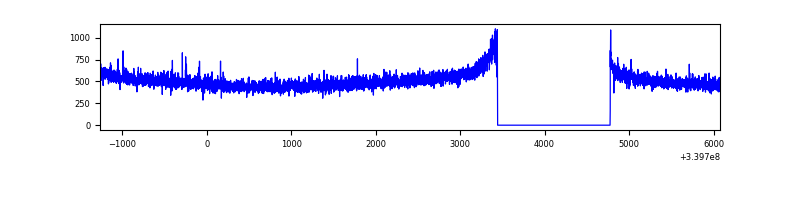 |
| D | 7340 | 6006 | 325 | 325 | 4.43% | 5.41% | 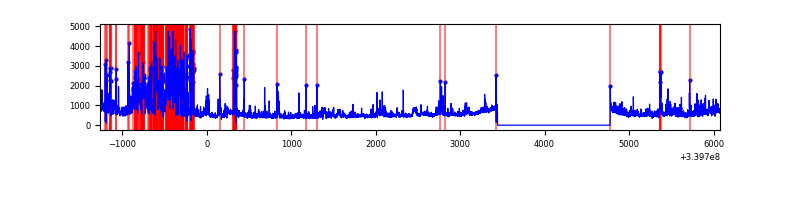 |
Top three noisy pixels from each quadrant. If the there are fewer than three noisy pixels in the level2.evt file, extra rows are filled as -1
| Pixel properties | Quadrant properties | ||||||
|---|---|---|---|---|---|---|---|
| Quadrant | DetID | PixID | Counts | Sigma | Mean | Median | Sigma |
| A | 6 | 16 | 117717 | 735.81 | 792 | 779 | 158.9 |
| A | 14 | 235 | 42050 | 259.69 | 792 | 779 | 158.9 |
| A | 13 | 248 | 14939 | 89.1 | 792 | 779 | 158.9 |
| B | 15 | 33 | 391839 | 2632.53 | 790 | 774 | 148.6 |
| B | 0 | 190 | 46128 | 305.31 | 790 | 774 | 148.6 |
| B | 12 | 18 | 31513 | 206.93 | 790 | 774 | 148.6 |
| C | 14 | 238 | 121833 | 697.49 | 748 | 752 | 173.6 |
| C | 13 | 61 | 5364 | 26.57 | 748 | 752 | 173.6 |
| C | 15 | 208 | 4956 | 24.22 | 748 | 752 | 173.6 |
| D | 1 | 52 | 1300519 | 7155.62 | 726 | 709 | 181.6 |
| D | 7 | 38 | 242478 | 1330.97 | 726 | 709 | 181.6 |
| D | 12 | 233 | 146311 | 801.56 | 726 | 709 | 181.6 |
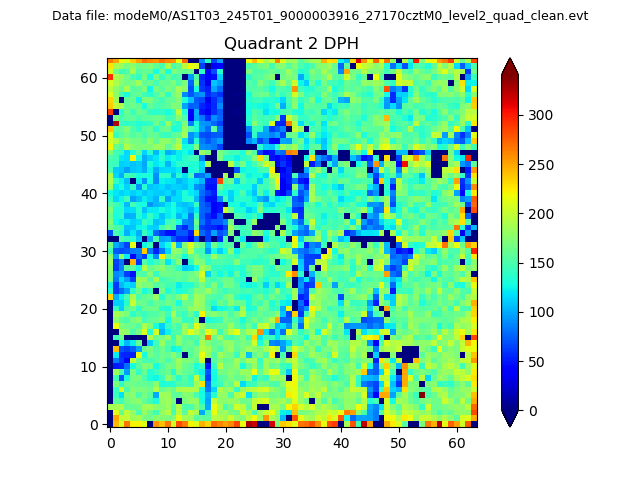
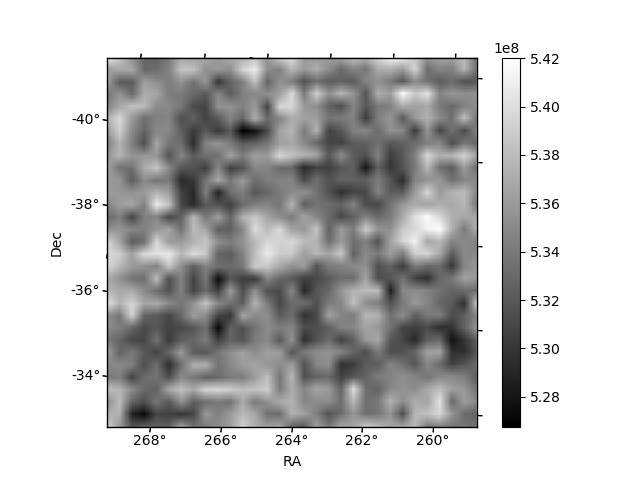
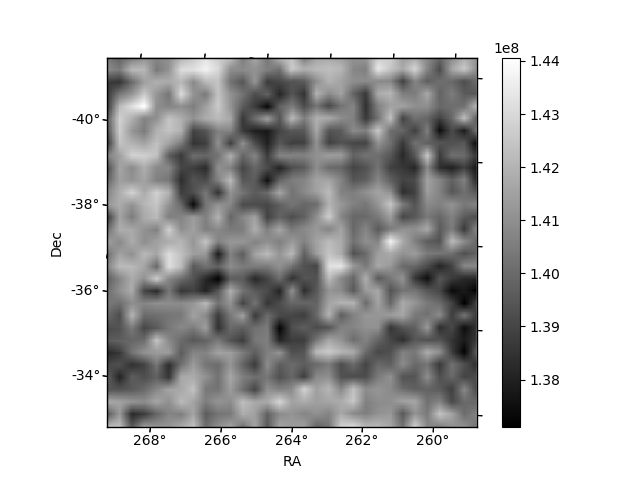
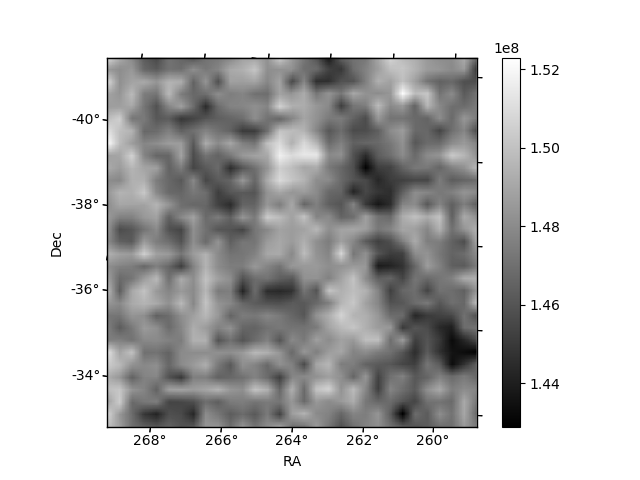
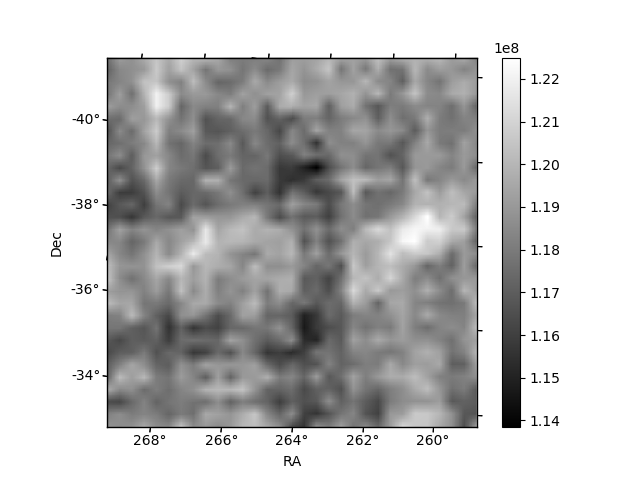
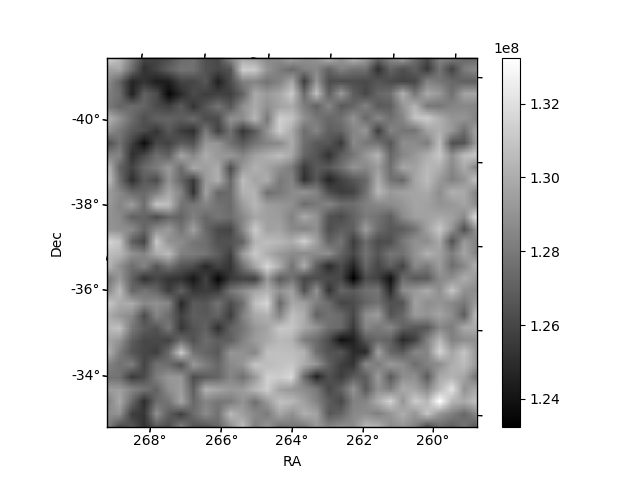
Histogram calculated using DETX and DETY for each event in the final _common_clean file
| Quadrant A | 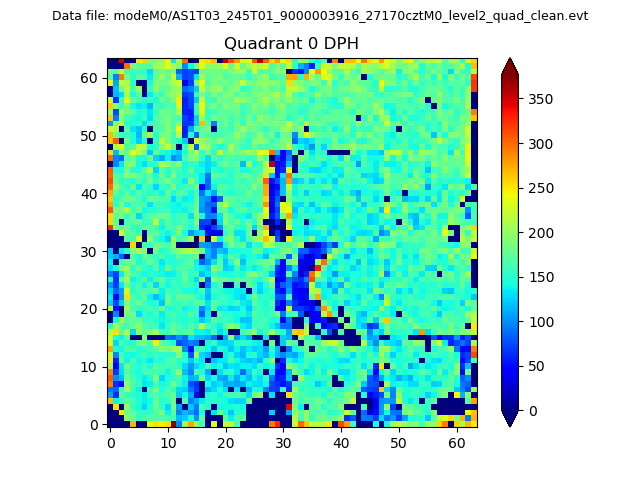 |
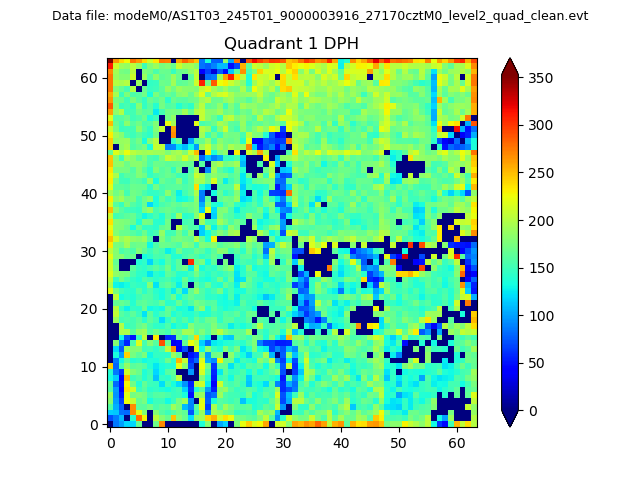 |
Quadrant B |
|---|---|---|---|
| Quadrant D | 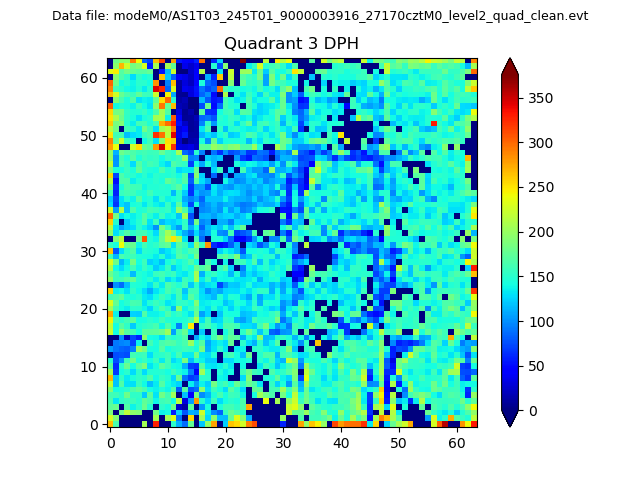 |
 |
Quadrant C |
| Plot type | Count rate plots | Images |
|---|---|---|
| Comparison with Poisson distribution Blue bars denote a histogram of data divided into 1 sec bins. Red curve is a Poisson curve with rate = median count rate of data. |
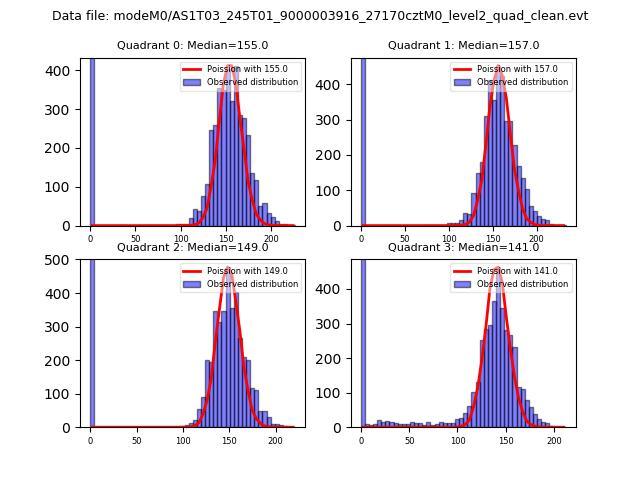 |
 |
| Quadrant-wise count rates Data is divided into 100 sec bins |
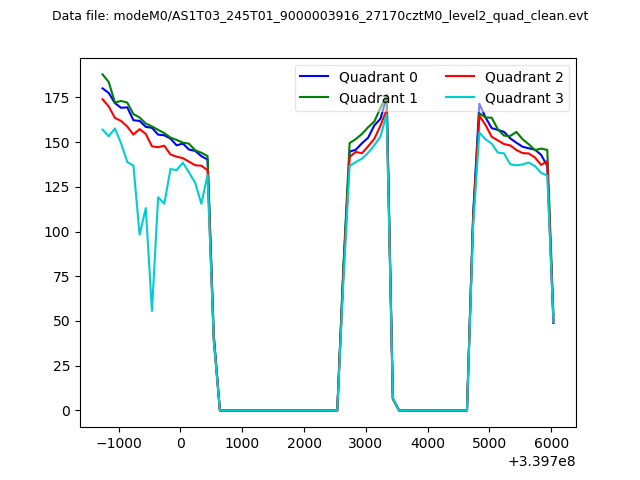 |
|
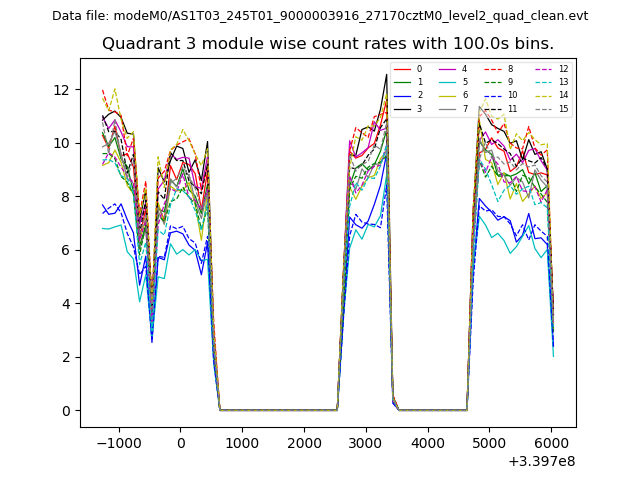
| Module-wise count rates for Quadrant A Data is divided into 100 sec bins |
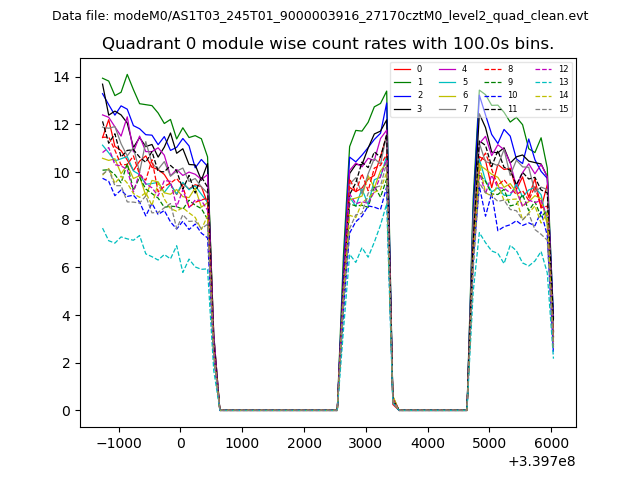 |
 |
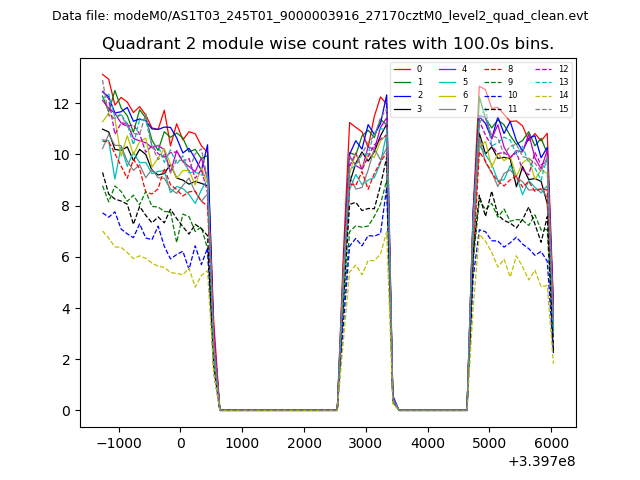
| Module-wise count rates for Quadrant B Data is divided into 100 sec bins |
 |
 |
| Module-wise count rates for Quadrant C Data is divided into 100 sec bins |
 |
 |
| Module-wise count rates for Quadrant D Data is divided into 100 sec bins |
 |
 |
| Parameter | Plot |
|---|---|
| CZT HV Monitor |  |
| D_VDD | 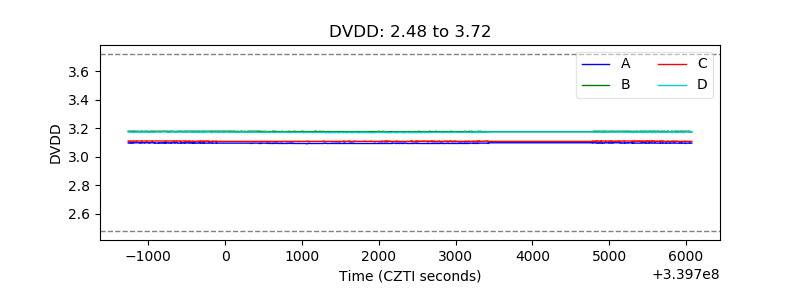 |
| Temperature 1 |  |
| Veto HV Monitor | 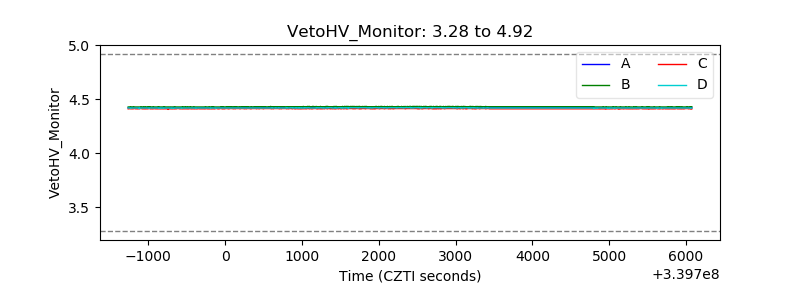 |
| Veto LLD | 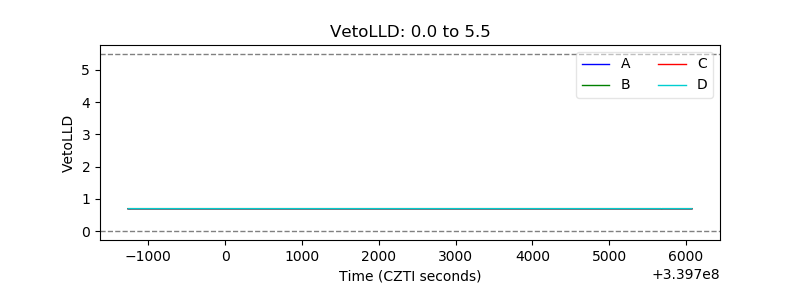 |
| Alpha Counter | 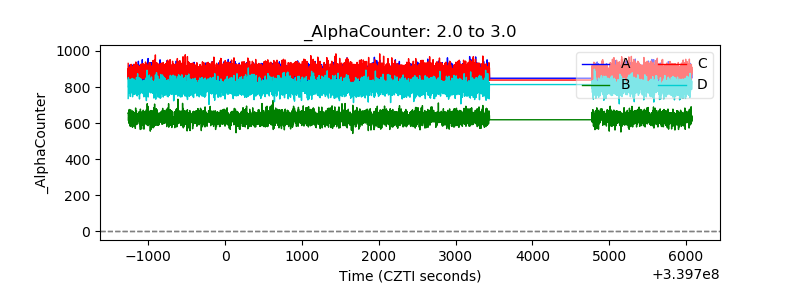 |
| _CPM_Rate | 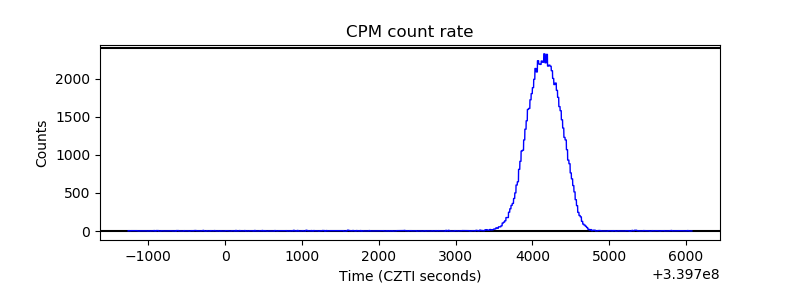 |
| CZT Counter | 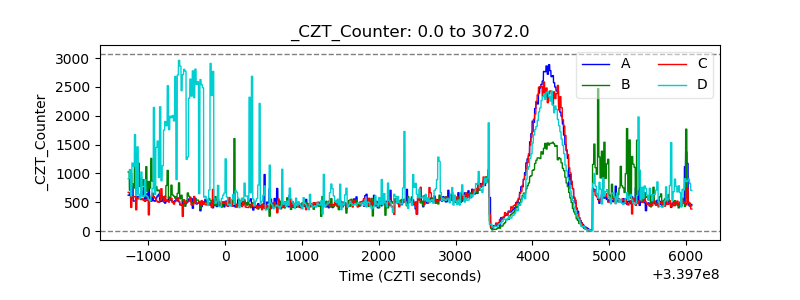 |
| +2.5 Volts monitor |  |
| +5 Volts monitor | 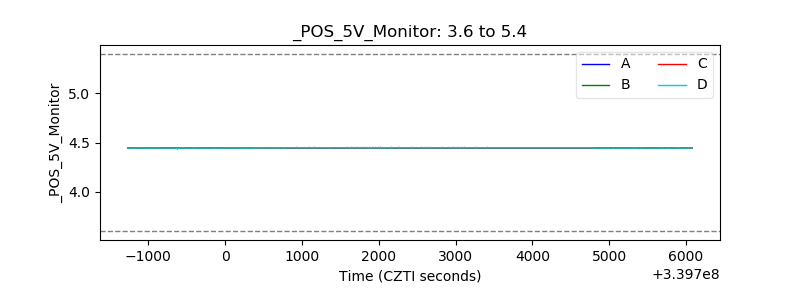 |
| _ROLL_ROT |  |
| _Roll_DEC | 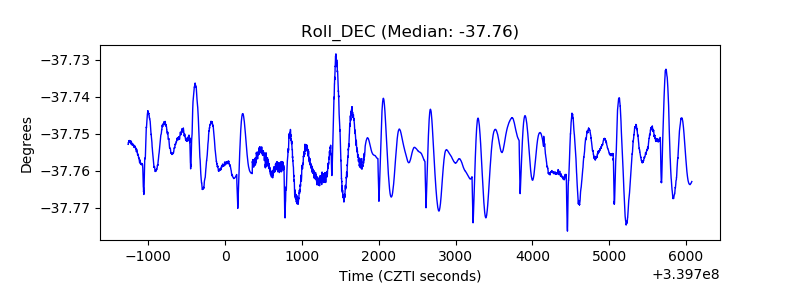 |
| _Roll_RA | 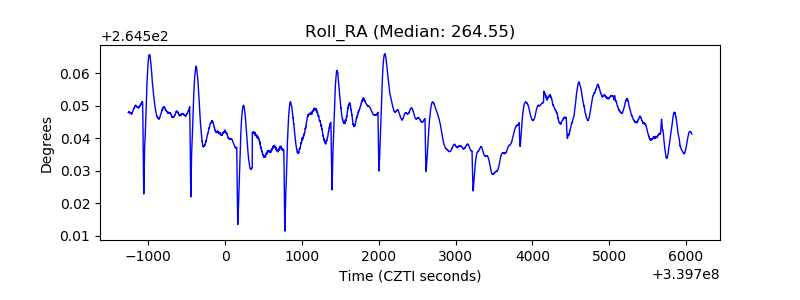 |
| Veto Counter |  |