| Param | Original file | Final file |
|---|---|---|
| Filename | modeM0/AS1T03_245T01_9000003916_27171cztM0_level2.evt | modeM0/AS1T03_245T01_9000003916_27171cztM0_level2_quad_clean.evt |
| Size (bytes) | 476,786,880 | 93,484,800 |
| Size | 454.7 MB | 89.2 MB |
| Events in quadrant A | 3,297,176 | 608,602 |
| Events in quadrant B | 3,688,679 | 618,740 |
| Events in quadrant C | 3,139,948 | 592,365 |
| Events in quadrant D | 3,883,053 | 568,694 |
| Mode M0 | |||
|---|---|---|---|
| Quadrant | BADHDUFLAG | Total packets | Discarded packets |
| A | 0 | 13825 | 0 |
| B | 0 | 14932 | 0 |
| C | 0 | 13275 | 0 |
| D | 0 | 15779 | 0 |
| Mode M9 | |||
|---|---|---|---|
| Quadrant | BADHDUFLAG | Total packets | Discarded packets |
| A | 0 | 13 | 0 |
| B | 0 | 14 | 0 |
| C | 0 | 14 | 0 |
| D | 0 | 14 | 0 |
| Quadrant | Total seconds | Saturated seconds | Saturation percentage |
|---|---|---|---|
| A | 6346 | 35 | 0.551529% |
| B | 6346 | 151 | 2.379452% |
| C | 6346 | 46 | 0.724866% |
| D | 6345 | 85 | 1.339638% |
Noise dominated data is calculated using 1-second bins in cleaned event files. If a bin has >2000 counts, and if more than 50% of those come from <1% of pixels, then it is considered to be noise-dominated and hence unusable.
| Quadrant | # 1 sec bins | Bins with >0 counts | Bins with >2000 counts | High rate bins dominated by noise | Noise dominated (total time) | Noise dominated (detector-on time) | Marked lightcurve |
|---|---|---|---|---|---|---|---|
| A | 7531 | 6347 | 16 | 16 | 0.21% | 0.25% | 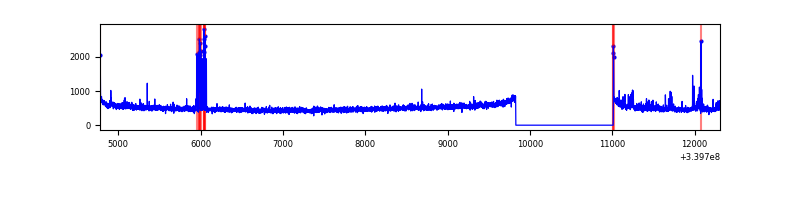 |
| B | 7531 | 6347 | 24 | 24 | 0.32% | 0.38% | 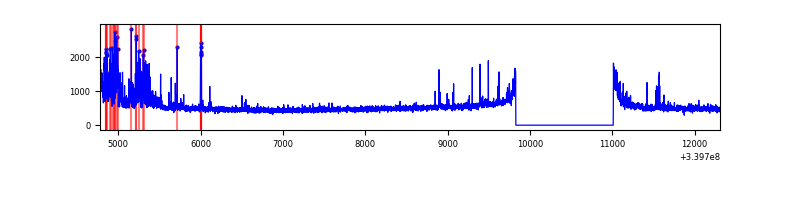 |
| C | 7531 | 6347 | 0 | 0 | 0.00% | 0.00% | 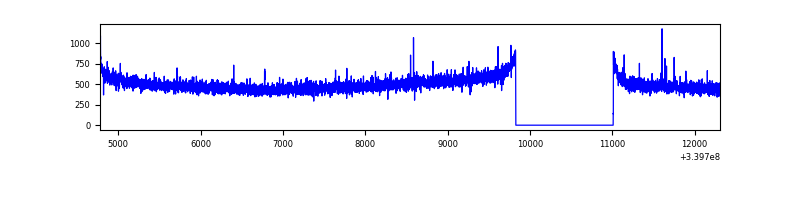 |
| D | 7530 | 6346 | 57 | 57 | 0.76% | 0.90% | 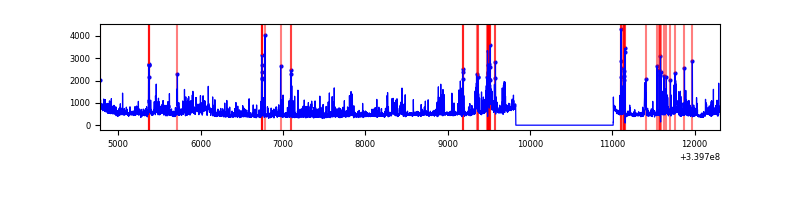 |
Top three noisy pixels from each quadrant. If the there are fewer than three noisy pixels in the level2.evt file, extra rows are filled as -1
| Pixel properties | Quadrant properties | ||||||
|---|---|---|---|---|---|---|---|
| Quadrant | DetID | PixID | Counts | Sigma | Mean | Median | Sigma |
| A | 6 | 16 | 126844 | 770.42 | 809 | 793 | 163.6 |
| A | 14 | 235 | 36060 | 215.55 | 809 | 793 | 163.6 |
| A | 8 | 192 | 15080 | 87.32 | 809 | 793 | 163.6 |
| B | 15 | 33 | 334519 | 2185.0 | 807 | 788 | 152.7 |
| B | 0 | 190 | 59169 | 382.23 | 807 | 788 | 152.7 |
| B | 12 | 18 | 38015 | 243.73 | 807 | 788 | 152.7 |
| C | 14 | 238 | 124100 | 688.09 | 770 | 774 | 179.2 |
| C | 15 | 208 | 7646 | 38.34 | 770 | 774 | 179.2 |
| C | 13 | 61 | 5297 | 25.24 | 770 | 774 | 179.2 |
| D | 1 | 52 | 450159 | 2291.8 | 764 | 746 | 196.1 |
| D | 2 | 250 | 230463 | 1171.45 | 764 | 746 | 196.1 |
| D | 7 | 38 | 198358 | 1007.73 | 764 | 746 | 196.1 |
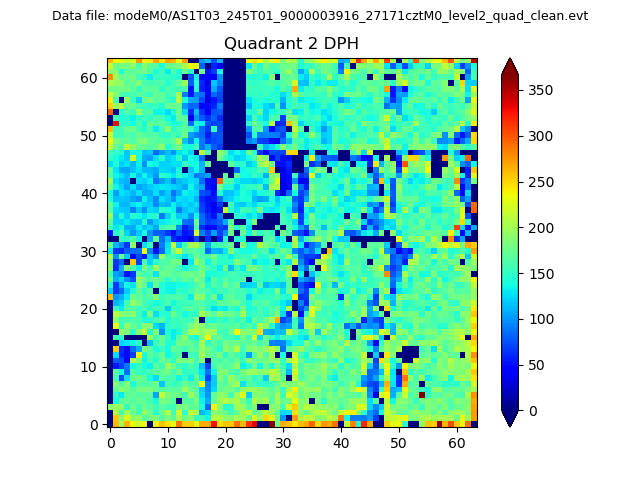
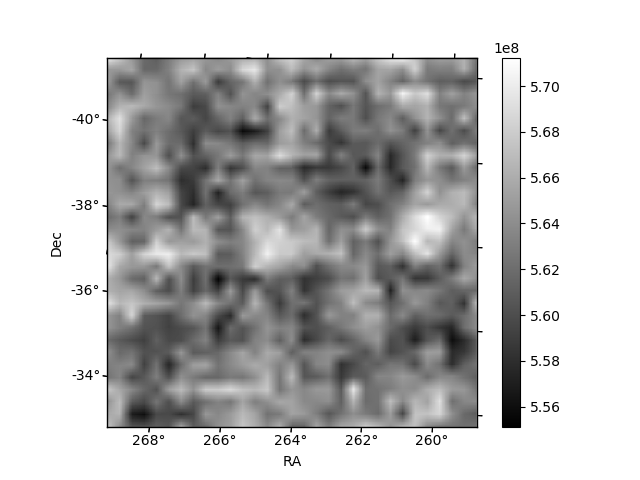
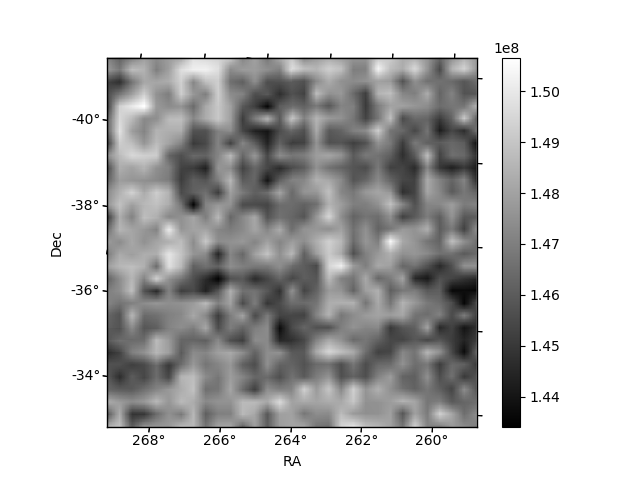
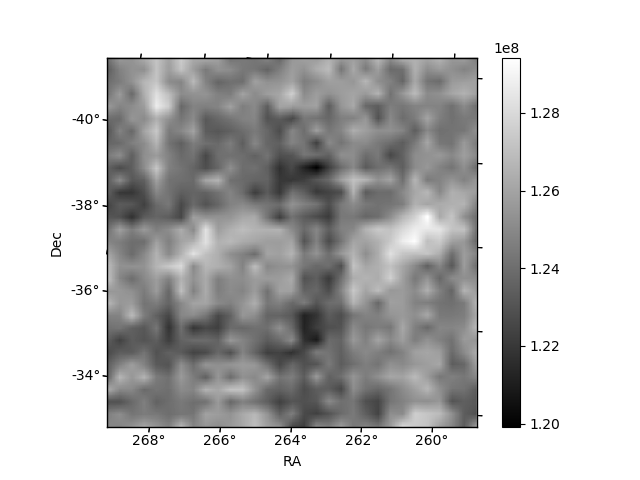
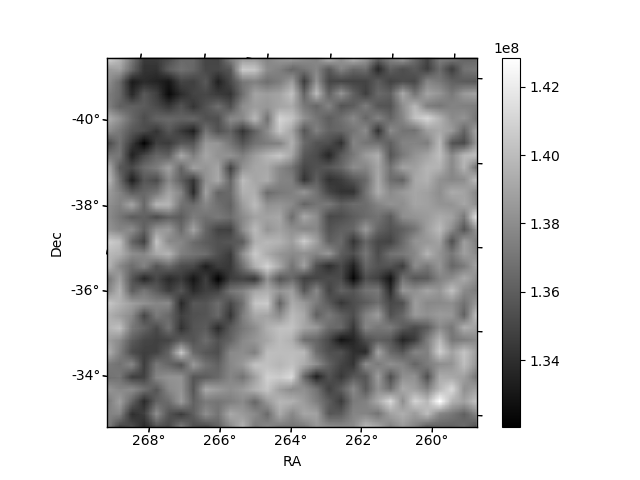
Histogram calculated using DETX and DETY for each event in the final _common_clean file
| Quadrant A | 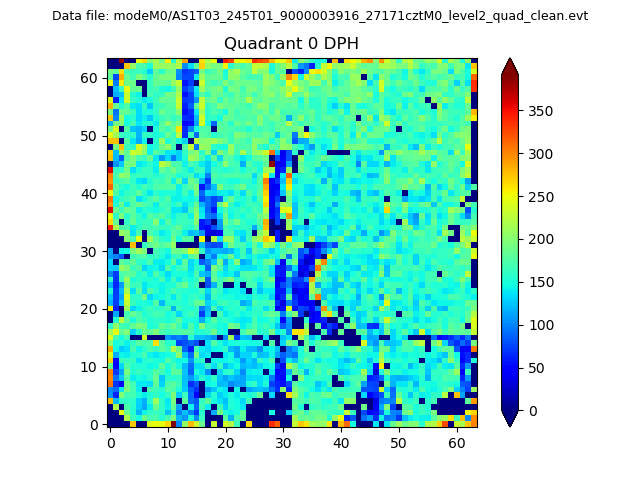 |
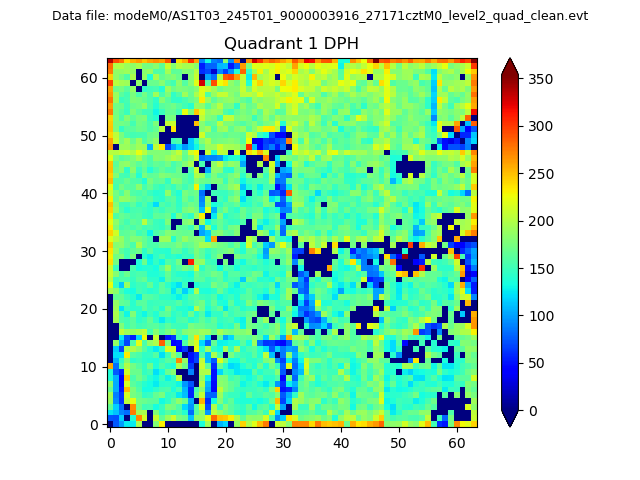 |
Quadrant B |
|---|---|---|---|
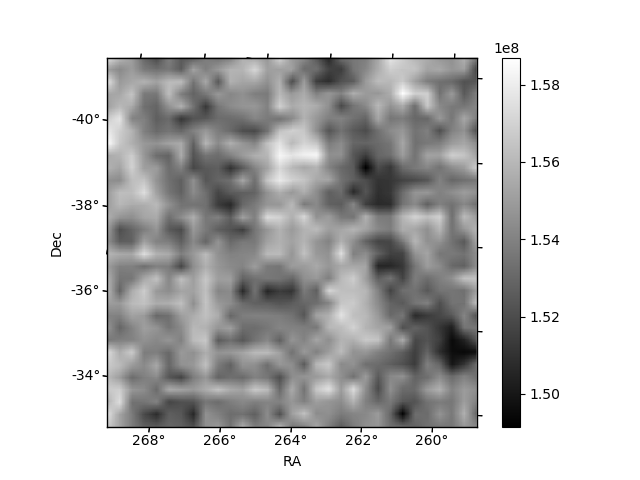
| Quadrant D | 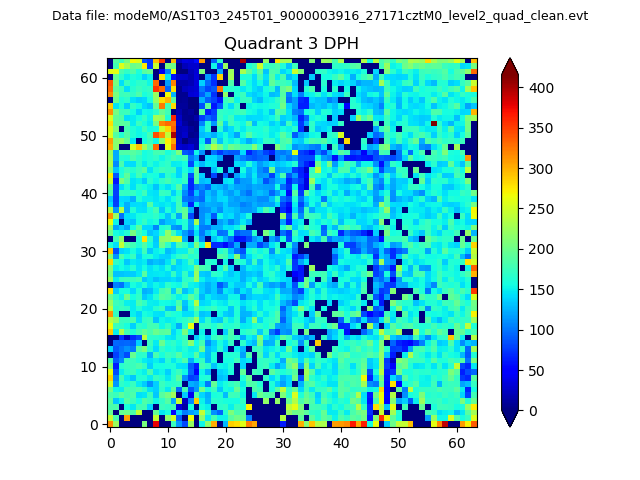 |
 |
Quadrant C |
| Plot type | Count rate plots | Images |
|---|---|---|
| Comparison with Poisson distribution Blue bars denote a histogram of data divided into 1 sec bins. Red curve is a Poisson curve with rate = median count rate of data. |
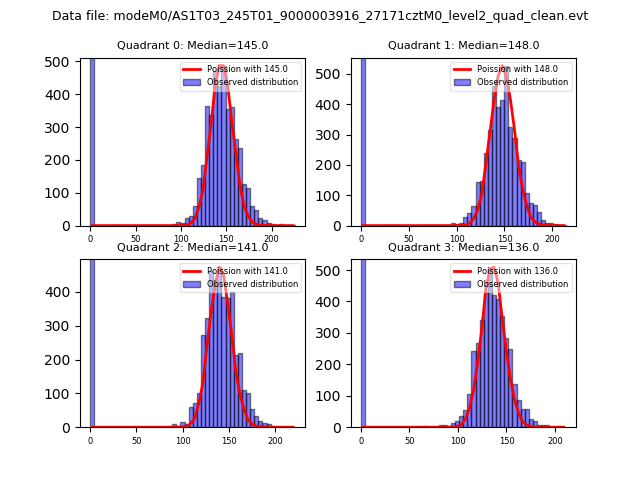 |
 |
| Quadrant-wise count rates Data is divided into 100 sec bins |
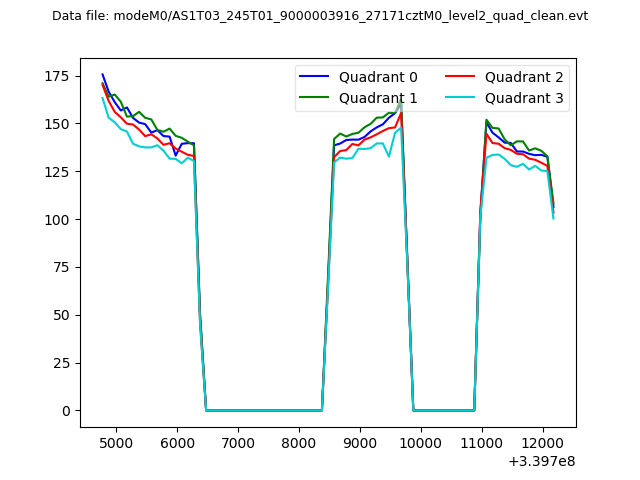 |
|
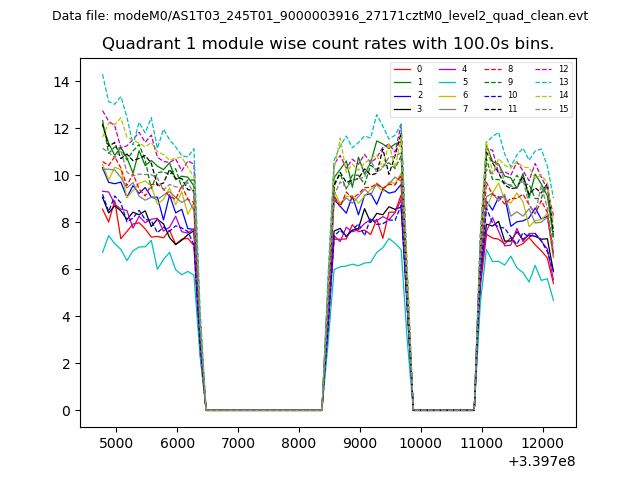
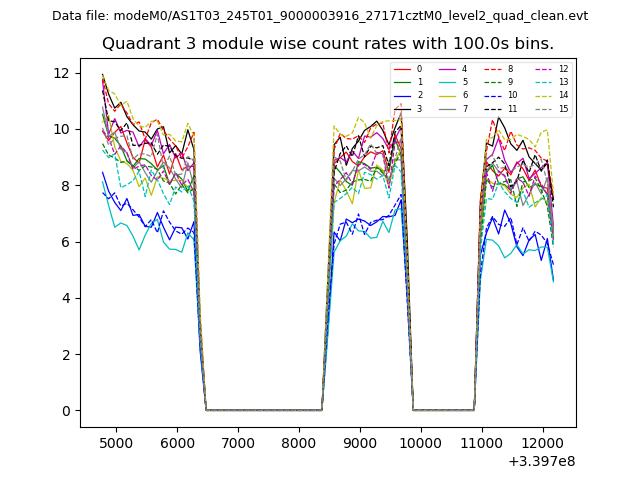
| Module-wise count rates for Quadrant A Data is divided into 100 sec bins |
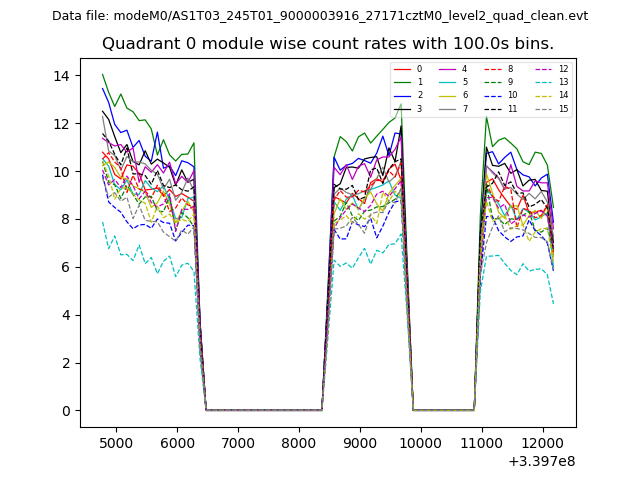 |
 |
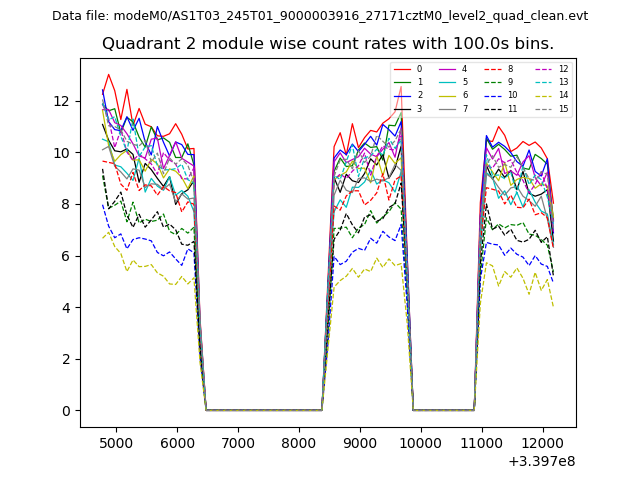
| Module-wise count rates for Quadrant B Data is divided into 100 sec bins |
 |
 |
| Module-wise count rates for Quadrant C Data is divided into 100 sec bins |
 |
 |
| Module-wise count rates for Quadrant D Data is divided into 100 sec bins |
 |
 |
| Parameter | Plot |
|---|---|
| CZT HV Monitor | 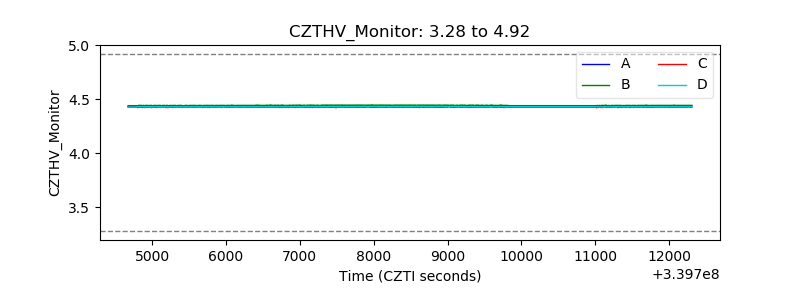 |
| D_VDD | 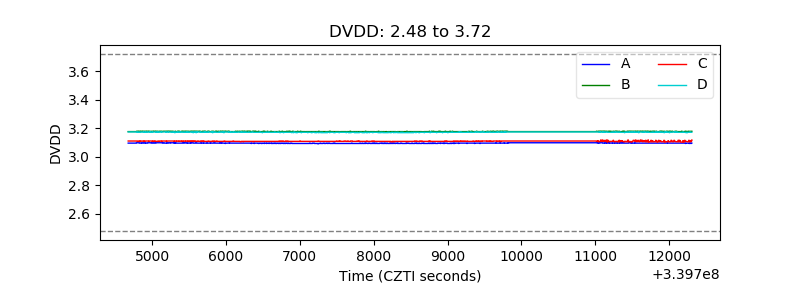 |
| Temperature 1 | 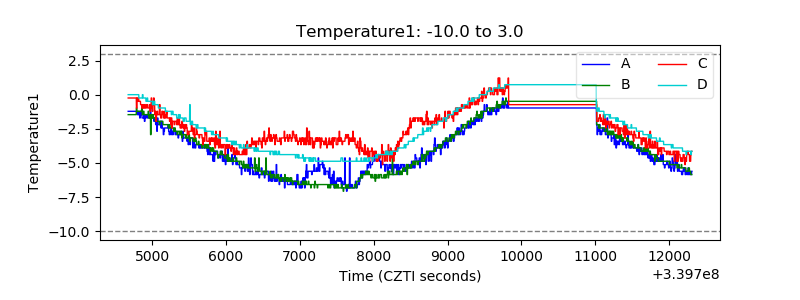 |
| Veto HV Monitor | 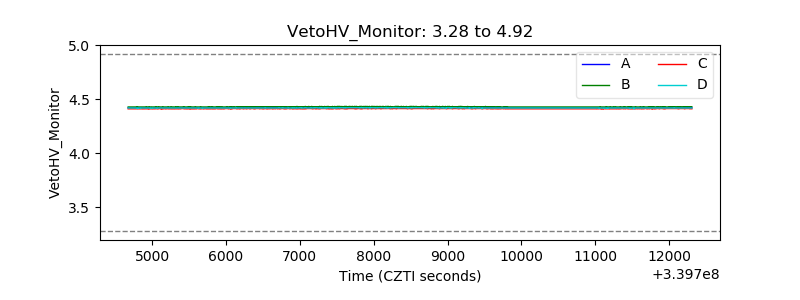 |
| Veto LLD | 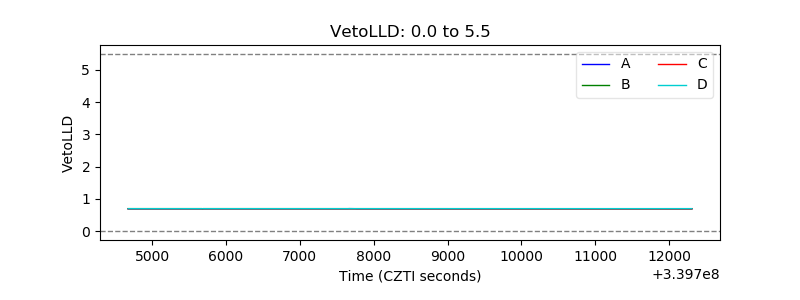 |
| Alpha Counter | 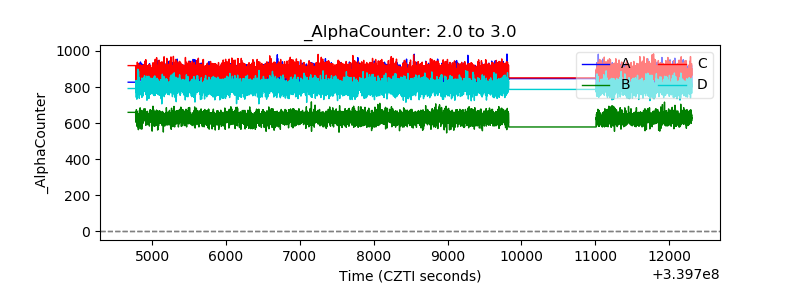 |
| _CPM_Rate | 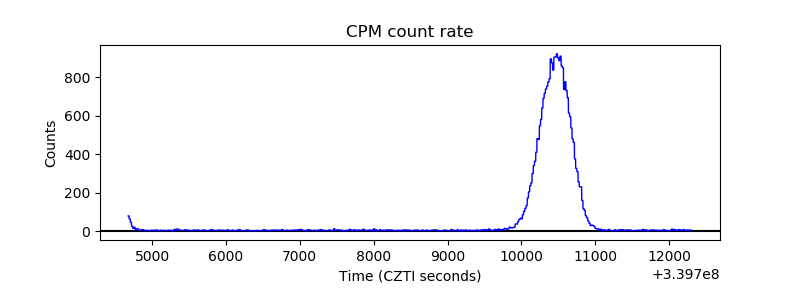 |
| CZT Counter | 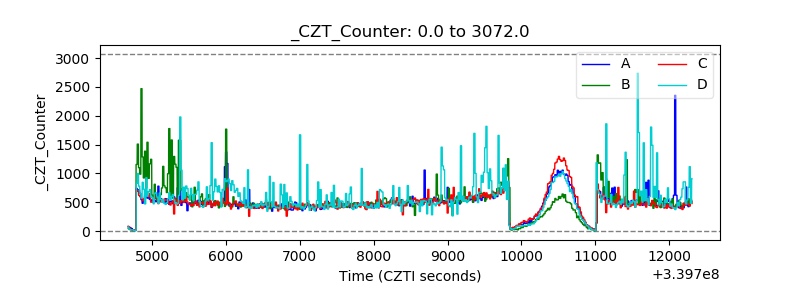 |
| +2.5 Volts monitor |  |
| +5 Volts monitor |  |
| _ROLL_ROT | 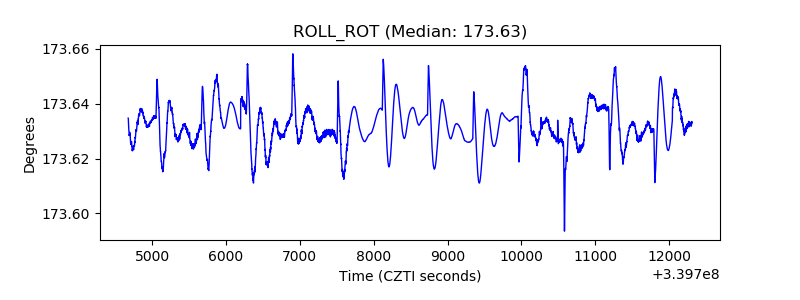 |
| _Roll_DEC | 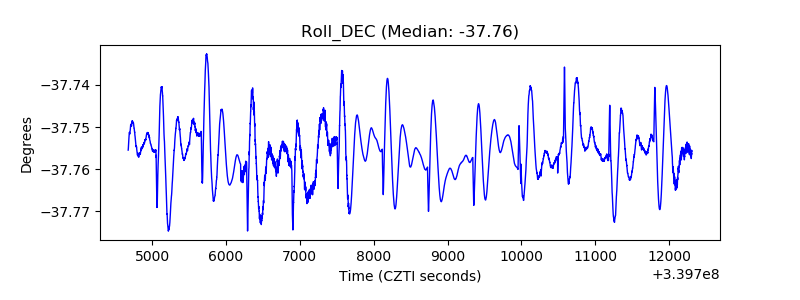 |
| _Roll_RA |  |
| Veto Counter | 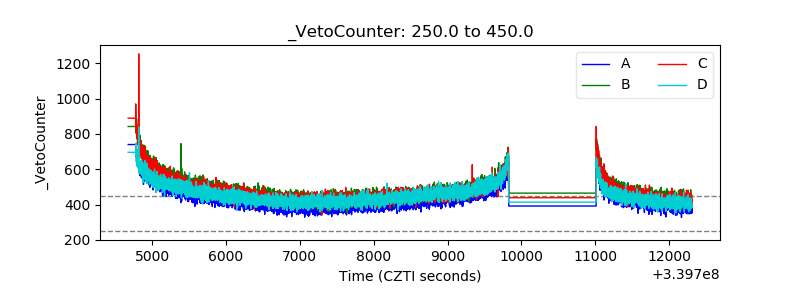 |