| Param | Original file | Final file |
|---|---|---|
| Filename | modeM0/AS1T03_245T01_9000003916_27174cztM0_level2.evt | modeM0/AS1T03_245T01_9000003916_27174cztM0_level2_quad_clean.evt |
| Size (bytes) | 433,520,640 | 57,617,280 |
| Size | 413.4 MB | 54.9 MB |
| Events in quadrant A | 4,542,568 | 332,133 |
| Events in quadrant B | 2,462,542 | 369,656 |
| Events in quadrant C | 2,343,367 | 355,033 |
| Events in quadrant D | 3,448,732 | 344,469 |
| Mode M0 | |||
|---|---|---|---|
| Quadrant | BADHDUFLAG | Total packets | Discarded packets |
| A | 0 | 16780 | 0 |
| B | 0 | 10471 | 0 |
| C | 0 | 10170 | 0 |
| D | 0 | 13664 | 0 |
| Mode M9 | |||
|---|---|---|---|
| Quadrant | BADHDUFLAG | Total packets | Discarded packets |
| A | 0 | 3 | 0 |
| B | 0 | 3 | 0 |
| C | 0 | 3 | 0 |
| D | 0 | 3 | 0 |
| Quadrant | Total seconds | Saturated seconds | Saturation percentage |
|---|---|---|---|
| A | 4883 | 697 | 14.274012% |
| B | 4884 | 126 | 2.579853% |
| C | 4884 | 128 | 2.620803% |
| D | 4884 | 157 | 3.214578% |
Noise dominated data is calculated using 1-second bins in cleaned event files. If a bin has >2000 counts, and if more than 50% of those come from <1% of pixels, then it is considered to be noise-dominated and hence unusable.
| Quadrant | # 1 sec bins | Bins with >0 counts | Bins with >2000 counts | High rate bins dominated by noise | Noise dominated (total time) | Noise dominated (detector-on time) | Marked lightcurve |
|---|---|---|---|---|---|---|---|
| A | 5213 | 4884 | 503 | 503 | 9.65% | 10.30% | 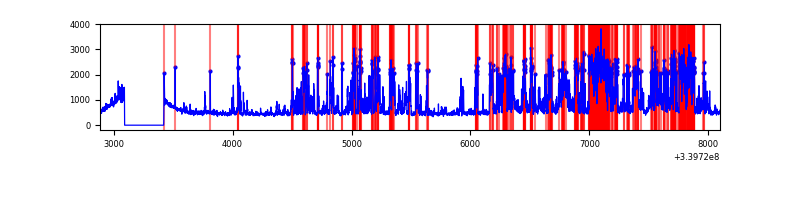 |
| B | 5214 | 4885 | 8 | 8 | 0.15% | 0.16% | 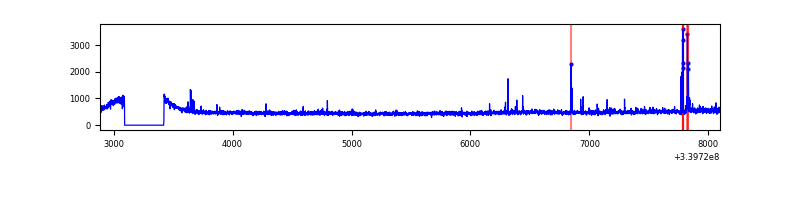 |
| C | 5214 | 4885 | 0 | 0 | 0.00% | 0.00% | 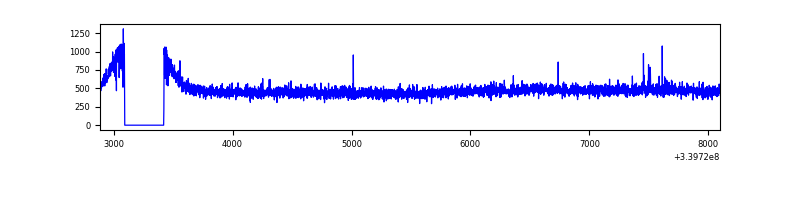 |
| D | 5214 | 4885 | 62 | 62 | 1.19% | 1.27% | 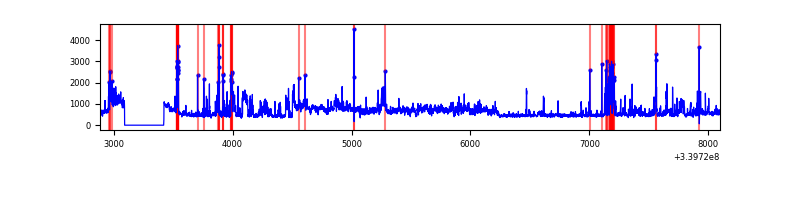 |
Top three noisy pixels from each quadrant. If the there are fewer than three noisy pixels in the level2.evt file, extra rows are filled as -1
| Pixel properties | Quadrant properties | ||||||
|---|---|---|---|---|---|---|---|
| Quadrant | DetID | PixID | Counts | Sigma | Mean | Median | Sigma |
| A | 6 | 16 | 2216695 | 18801.2 | 579 | 566 | 117.9 |
| A | 14 | 235 | 64934 | 546.09 | 579 | 566 | 117.9 |
| A | 13 | 248 | 13851 | 112.71 | 579 | 566 | 117.9 |
| B | 5 | 172 | 36574 | 308.26 | 600 | 585 | 116.7 |
| B | 0 | 190 | 24811 | 207.51 | 600 | 585 | 116.7 |
| B | 15 | 33 | 21598 | 179.99 | 600 | 585 | 116.7 |
| C | 14 | 238 | 90546 | 652.83 | 576 | 578 | 137.8 |
| C | 15 | 208 | 7826 | 52.59 | 576 | 578 | 137.8 |
| C | 13 | 61 | 3999 | 24.82 | 576 | 578 | 137.8 |
| D | 1 | 52 | 877819 | 6213.82 | 576 | 561 | 141.2 |
| D | 2 | 250 | 227694 | 1608.84 | 576 | 561 | 141.2 |
| D | 7 | 38 | 136252 | 961.13 | 576 | 561 | 141.2 |
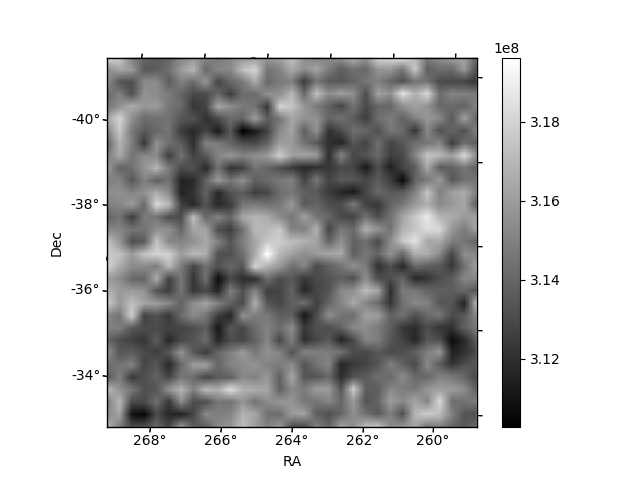
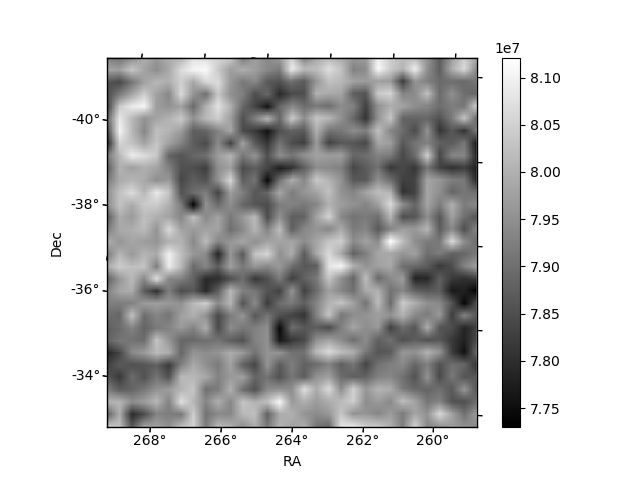
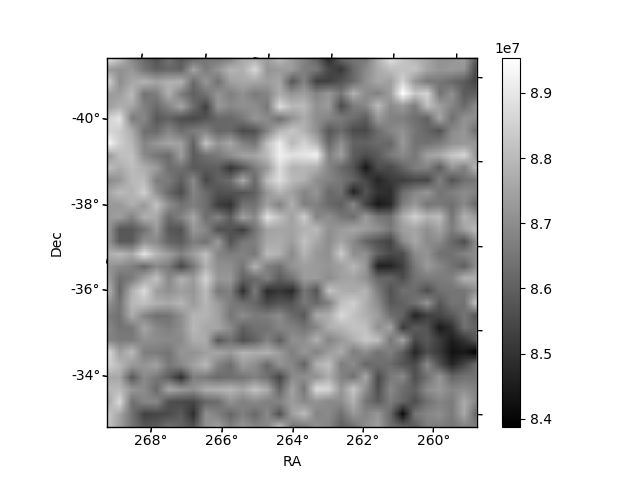
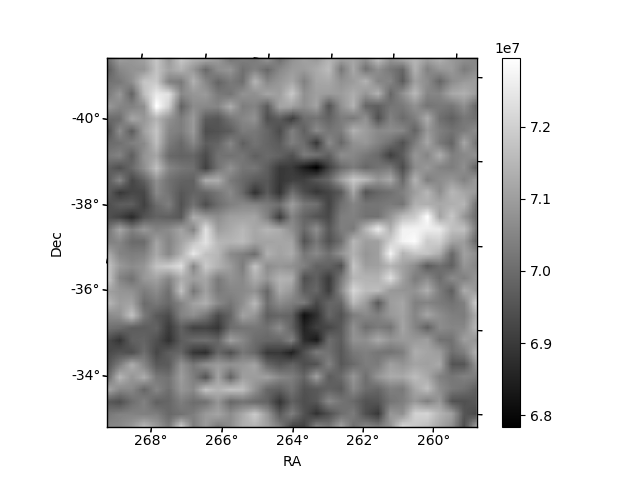
Histogram calculated using DETX and DETY for each event in the final _common_clean file
| Quadrant A | 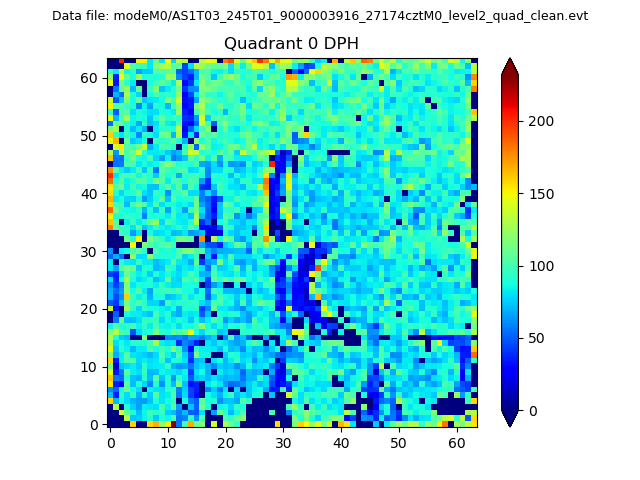 |
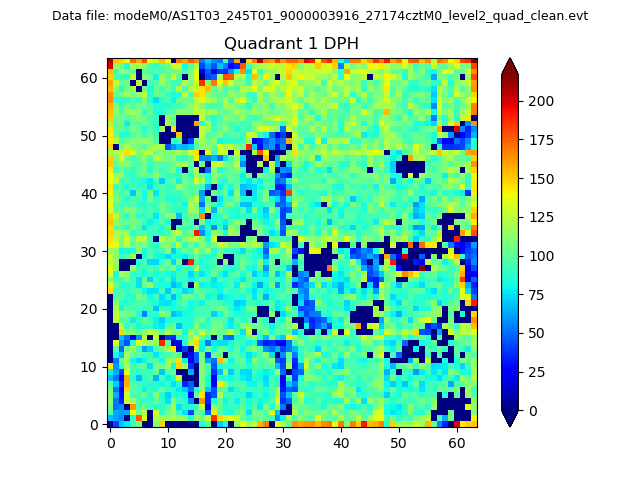 |
Quadrant B |
|---|---|---|---|
| Quadrant D | 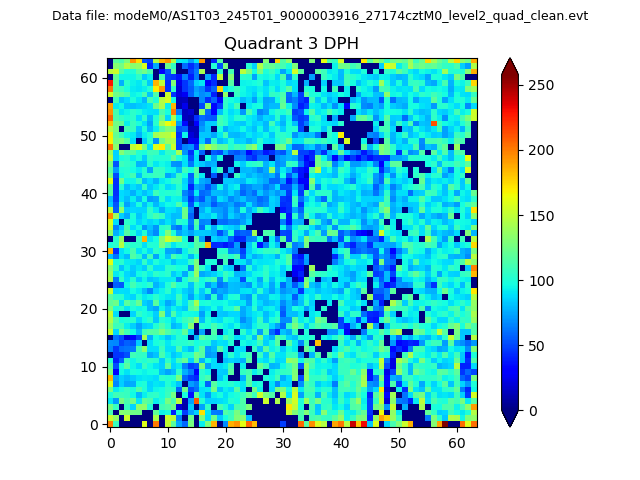 |
 |
Quadrant C |
| Plot type | Count rate plots | Images |
|---|---|---|
| Comparison with Poisson distribution Blue bars denote a histogram of data divided into 1 sec bins. Red curve is a Poisson curve with rate = median count rate of data. |
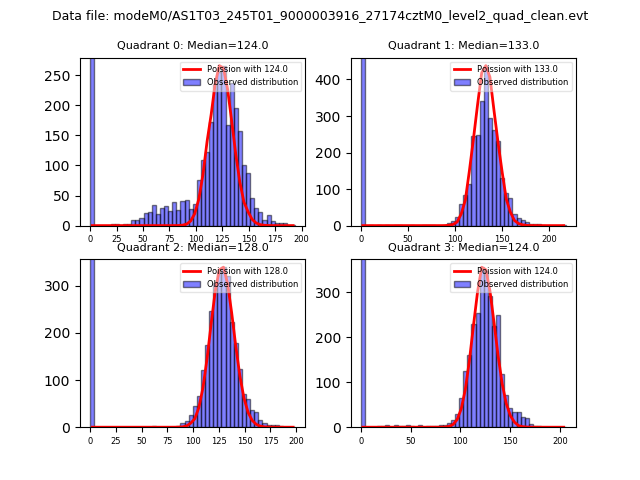 |
 |
| Quadrant-wise count rates Data is divided into 100 sec bins |
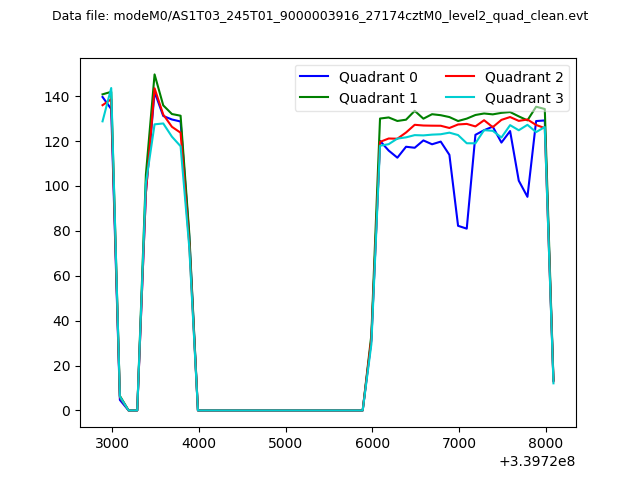 |
|
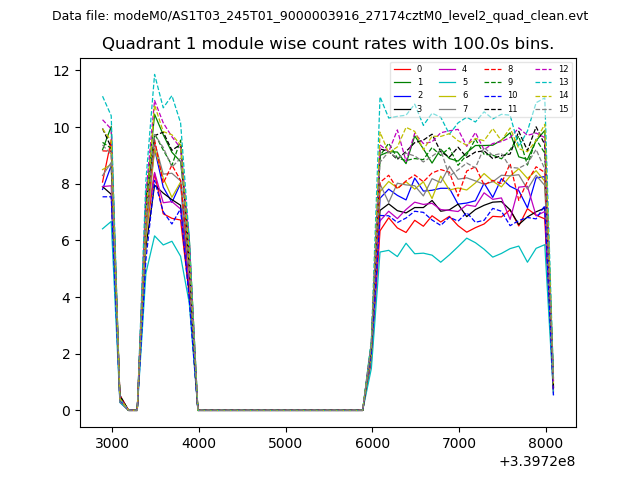
| Module-wise count rates for Quadrant A Data is divided into 100 sec bins |
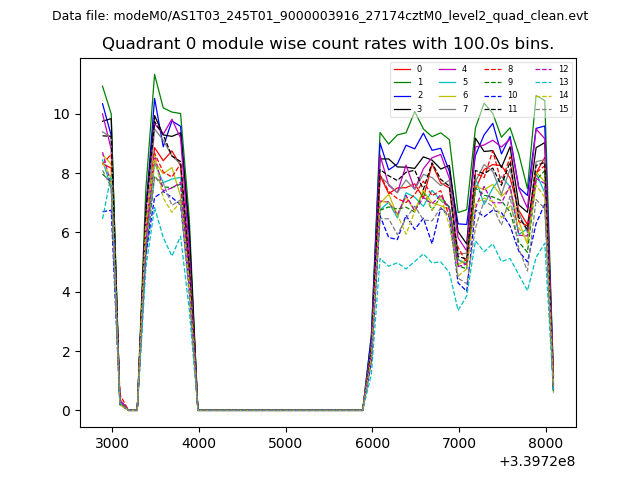 |
 |
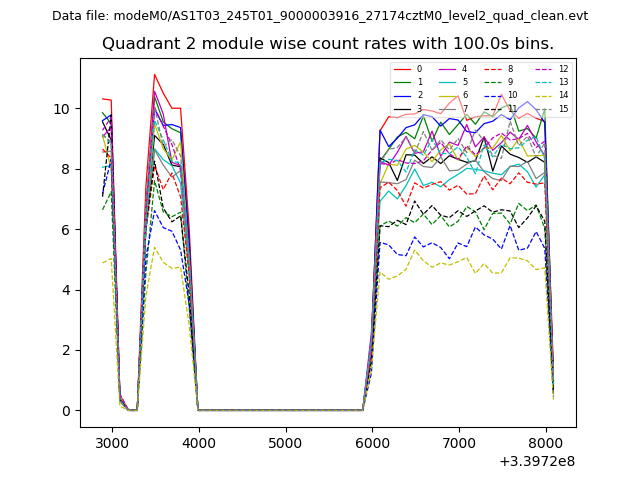
| Module-wise count rates for Quadrant B Data is divided into 100 sec bins |
 |
 |
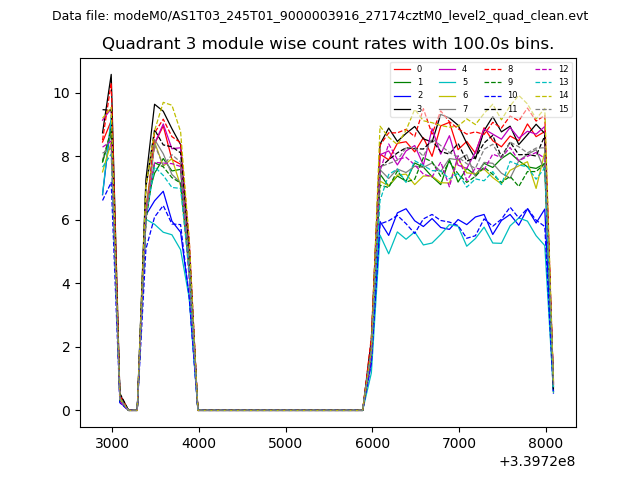
| Module-wise count rates for Quadrant C Data is divided into 100 sec bins |
 |
 |
| Module-wise count rates for Quadrant D Data is divided into 100 sec bins |
 |
 |
| Parameter | Plot |
|---|---|
| CZT HV Monitor | 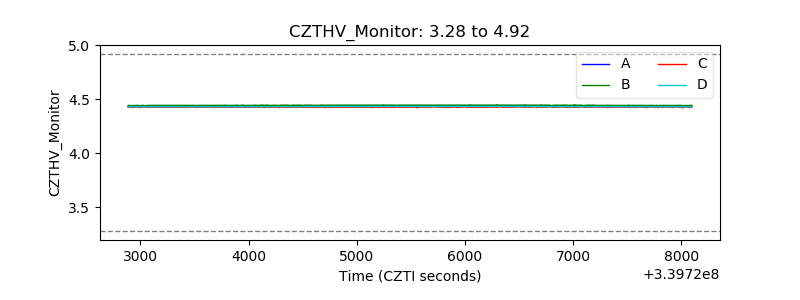 |
| D_VDD | 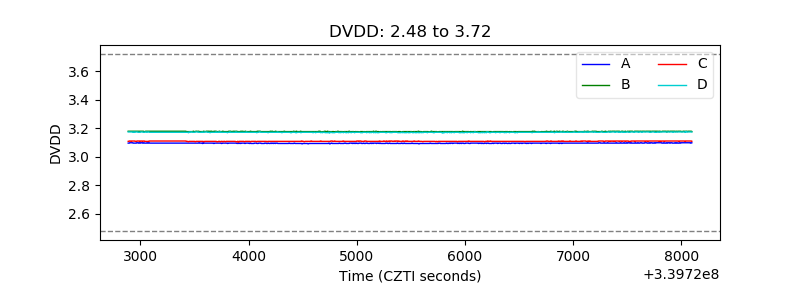 |
| Temperature 1 | 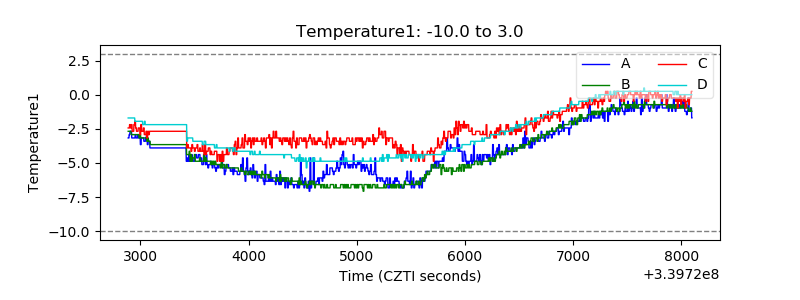 |
| Veto HV Monitor |  |
| Veto LLD | 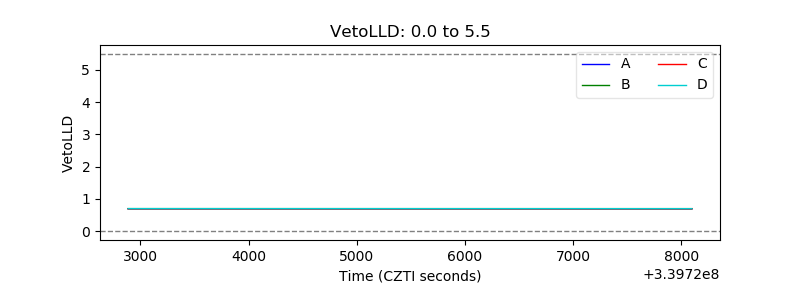 |
| Alpha Counter | 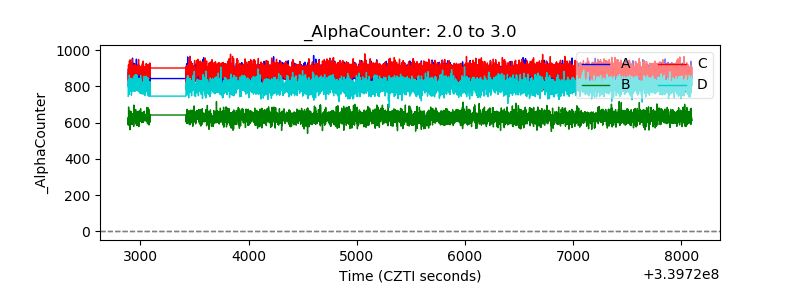 |
| _CPM_Rate | 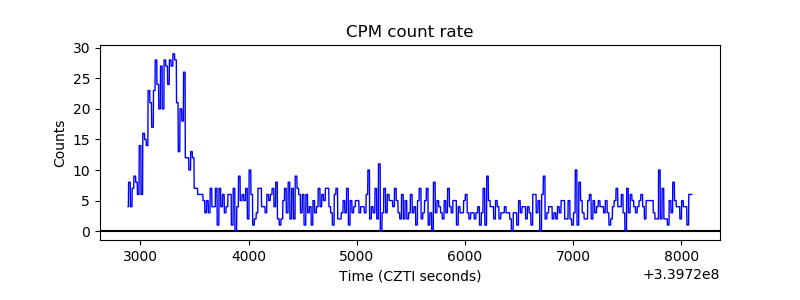 |
| CZT Counter | 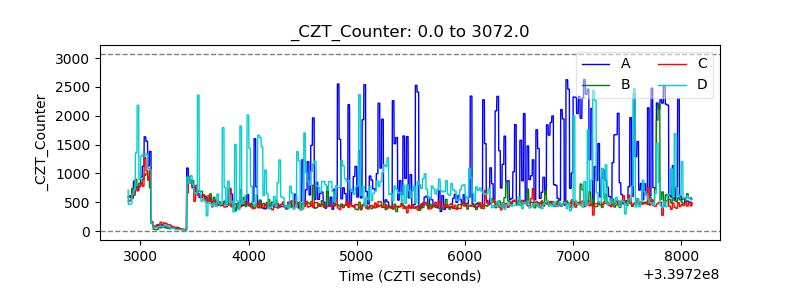 |
| +2.5 Volts monitor |  |
| +5 Volts monitor | 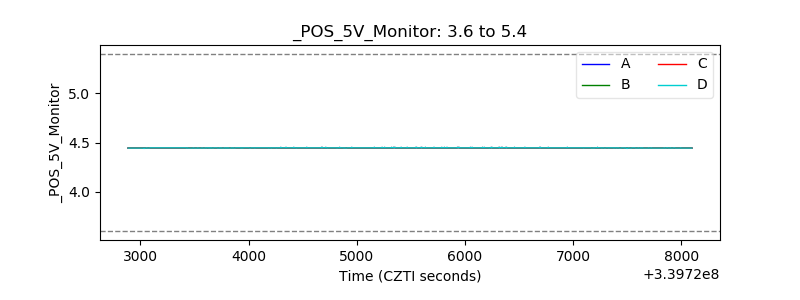 |
| _ROLL_ROT | 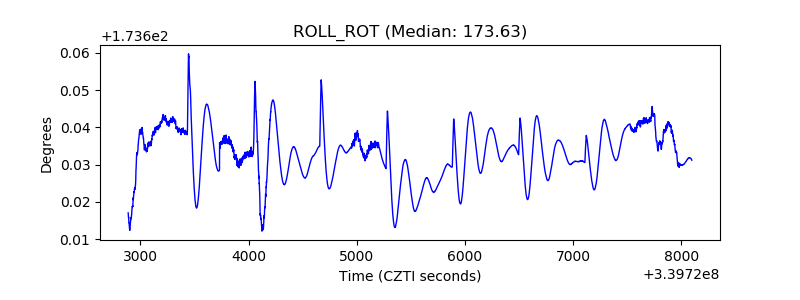 |
| _Roll_DEC | 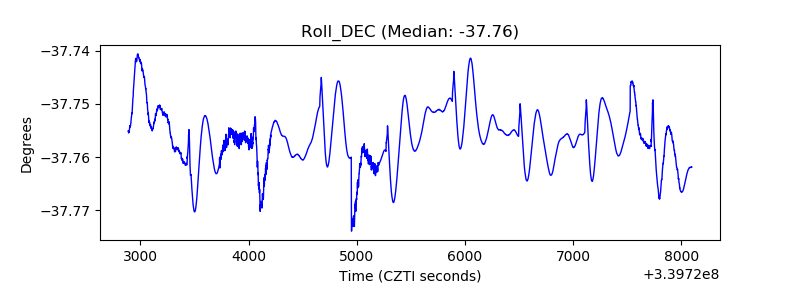 |
| _Roll_RA | 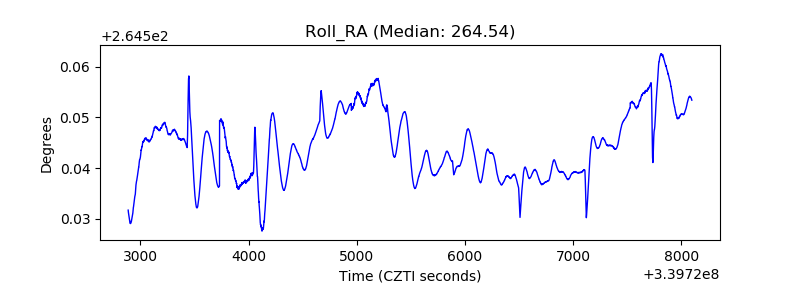 |
| Veto Counter | 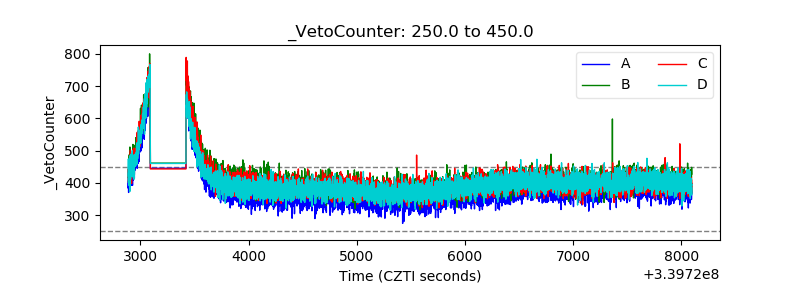 |