| Param | Original file | Final file |
|---|---|---|
| Filename | modeM0/AS1T03_247T01_9000003914cztM0_level2.fits | modeM0/AS1T03_247T01_9000003914cztM0_level2_quad_clean.evt |
| Size (bytes) | 177,370,560 | 219,179,520 |
| Size | 169.2 MB | 209.0 MB |
| Events in quadrant A | 1,070,400 | 1,389,314 |
| Events in quadrant B | 1,032,668 | 1,402,709 |
| Events in quadrant C | 1,050,616 | 1,333,863 |
| Events in quadrant D | 917,296 | 1,211,186 |
| Mode M9 | |||
|---|---|---|---|
| Quadrant | BADHDUFLAG | Total packets | Discarded packets |
| A | 0 | 10 | 0 |
| B | 0 | 10 | 0 |
| C | 0 | 10 | 0 |
| D | 0 | 10 | 0 |
| Mode M0 | |||
|---|---|---|---|
| Quadrant | BADHDUFLAG | Total packets | Discarded packets |
| A | 0 | 39208 | 0 |
| B | 0 | 39803 | 0 |
| C | 0 | 39214 | 0 |
| D | 0 | 47525 | 0 |
| Mode SS | |||
|---|---|---|---|
| Quadrant | BADHDUFLAG | Total packets | Discarded packets |
| A | 0 | 382 | 0 |
| B | 0 | 382 | 0 |
| C | 0 | 382 | 0 |
| D | 0 | 382 | 0 |
| Quadrant | Total seconds | Saturated seconds | Saturation percentage |
|---|---|---|---|
| A | 18886 | 158 | 0.836599% |
| B | 18886 | 212 | 1.122525% |
| C | 18886 | 260 | 1.376681% |
| D | 18886 | 418 | 2.213280% |
Noise dominated data is calculated using 1-second bins in cleaned event files. If a bin has >2000 counts, and if more than 50% of those come from <1% of pixels, then it is considered to be noise-dominated and hence unusable.
| Quadrant | # 1 sec bins | Bins with >0 counts | Bins with >2000 counts | High rate bins dominated by noise | Noise dominated (total time) | Noise dominated (detector-on time) | Marked lightcurve |
|---|---|---|---|---|---|---|---|
| A | 19886 | 18887 | 0 | 0 | 0.00% | 0.00% | 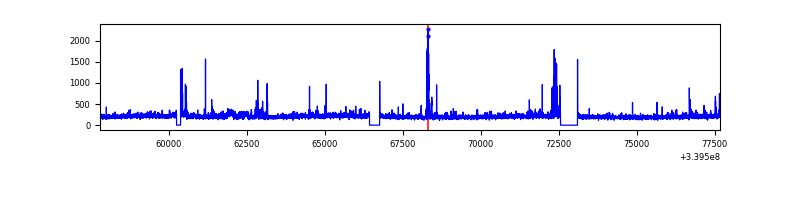 |
| B | 19886 | 18886 | 0 | 0 | 0.00% | 0.00% | 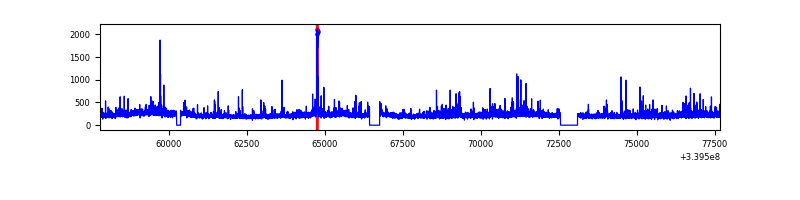 |
| C | 19886 | 18886 | 0 | 0 | 0.00% | 0.00% | 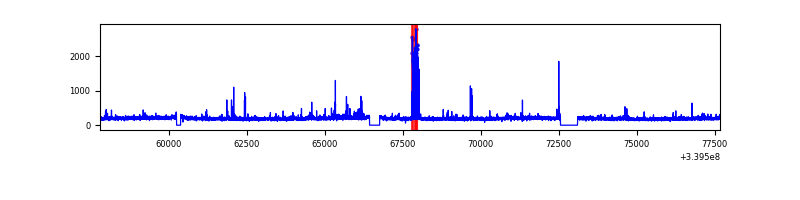 |
| D | 19886 | 18885 | 0 | 0 | 0.00% | 0.00% | 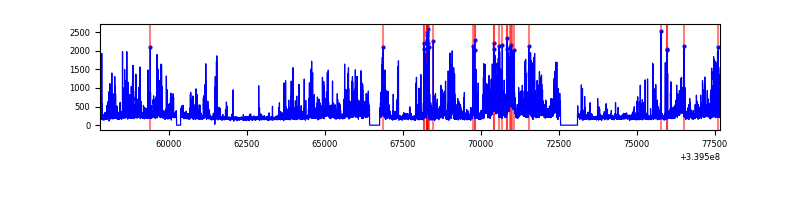 |
Top three noisy pixels from each quadrant. If the there are fewer than three noisy pixels in the level2.evt file, extra rows are filled as -1
| Pixel properties | Quadrant properties | ||||||
|---|---|---|---|---|---|---|---|
| Quadrant | DetID | PixID | Counts | Sigma | Mean | Median | Sigma |
| A | 0 | 29 | 863 | 8.5 | 279 | 262 | 70.7 |
| A | 7 | 110 | 844 | 8.23 | 279 | 262 | 70.7 |
| A | 0 | 30 | 815 | 7.82 | 279 | 262 | 70.7 |
| B | 2 | 9 | 826 | 10.15 | 272 | 259 | 55.9 |
| B | 5 | 255 | 731 | 8.45 | 272 | 259 | 55.9 |
| B | 3 | 17 | 696 | 7.82 | 272 | 259 | 55.9 |
| C | 9 | 209 | 714 | 6.47 | 277 | 259 | 70.3 |
| C | 12 | 249 | 705 | 6.34 | 277 | 259 | 70.3 |
| C | 3 | 234 | 700 | 6.27 | 277 | 259 | 70.3 |
| D | 3 | 14 | 699 | 6.52 | 261 | 238 | 70.7 |
| D | 1 | 31 | 689 | 6.37 | 261 | 238 | 70.7 |
| D | 10 | 189 | 683 | 6.29 | 261 | 238 | 70.7 |
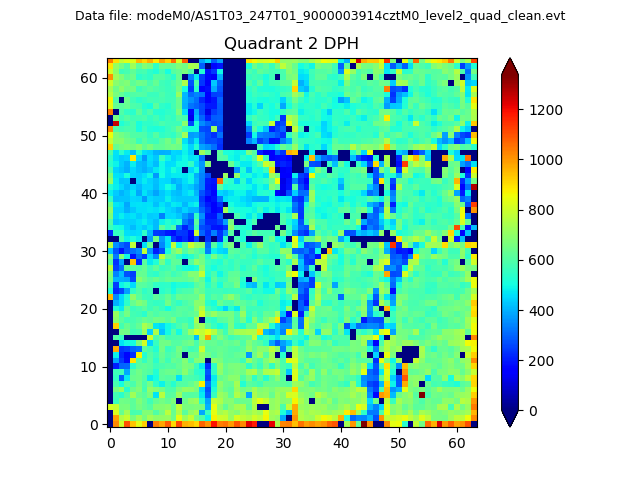
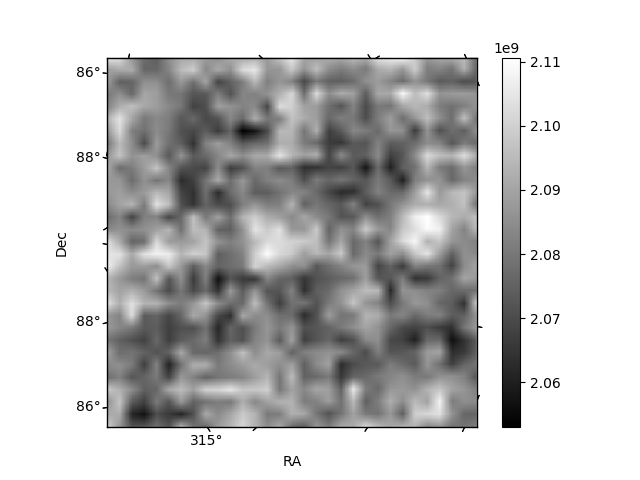
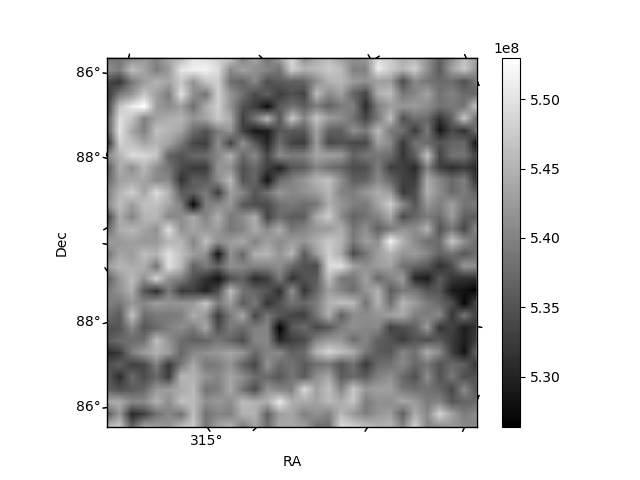
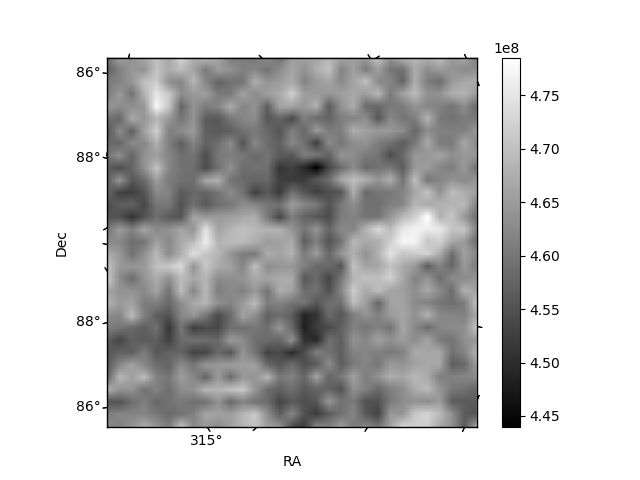
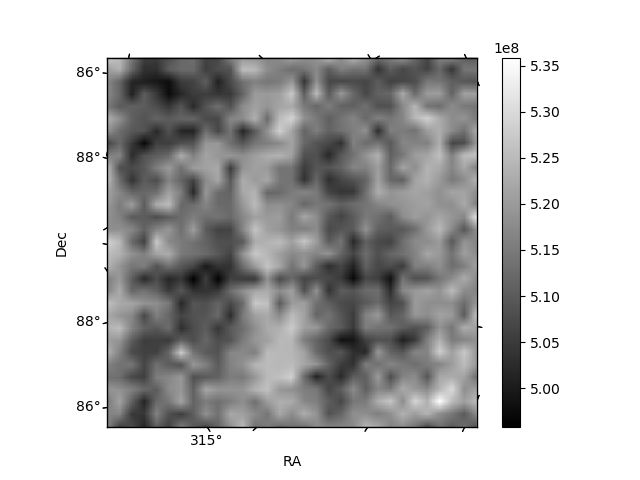
Histogram calculated using DETX and DETY for each event in the final _common_clean file
| Quadrant A | 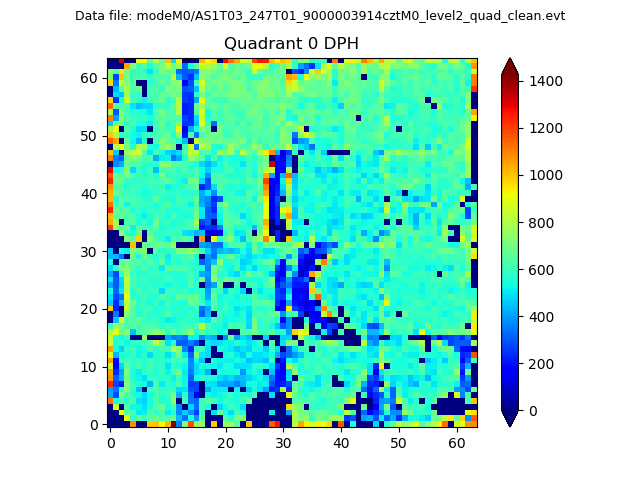 |
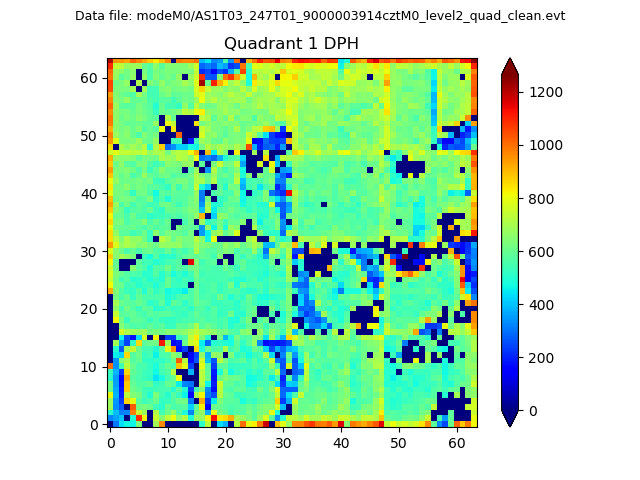 |
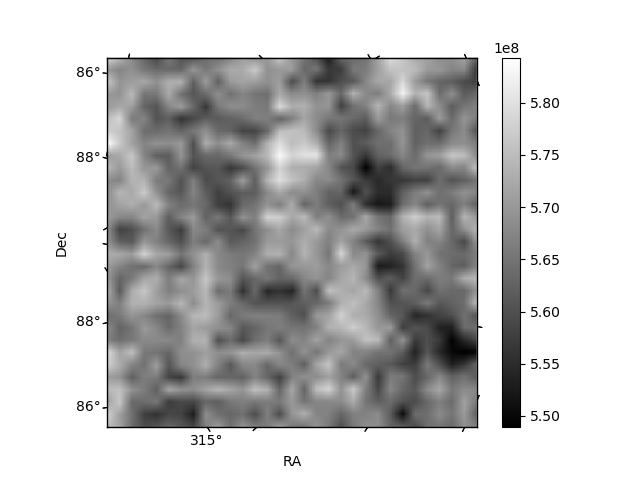
Quadrant B |
|---|---|---|---|
| Quadrant D | 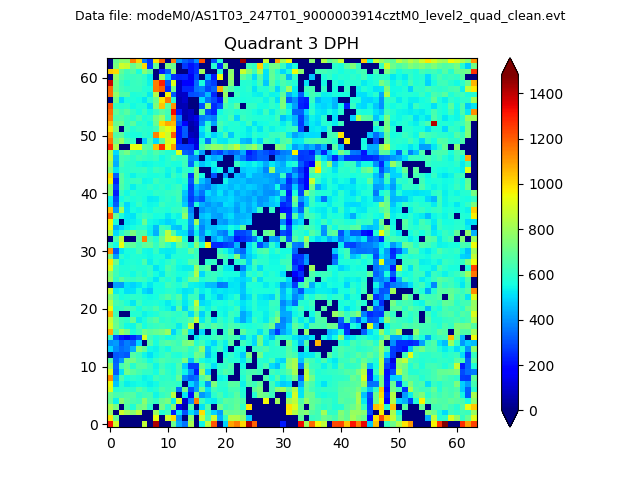 |
 |
Quadrant C |
| Plot type | Count rate plots | Images |
|---|---|---|
| Comparison with Poisson distribution Blue bars denote a histogram of data divided into 1 sec bins. Red curve is a Poisson curve with rate = median count rate of data. |
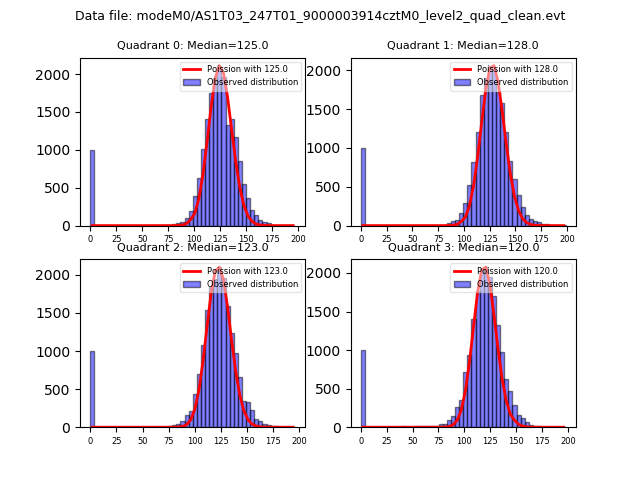 |
 |
| Quadrant-wise count rates Data is divided into 100 sec bins |
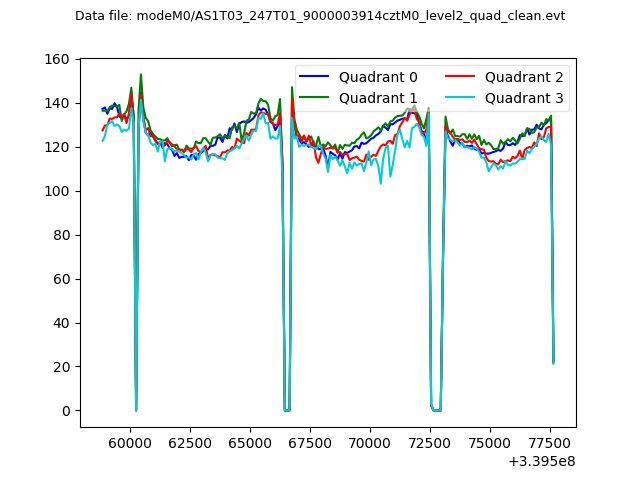 |
|
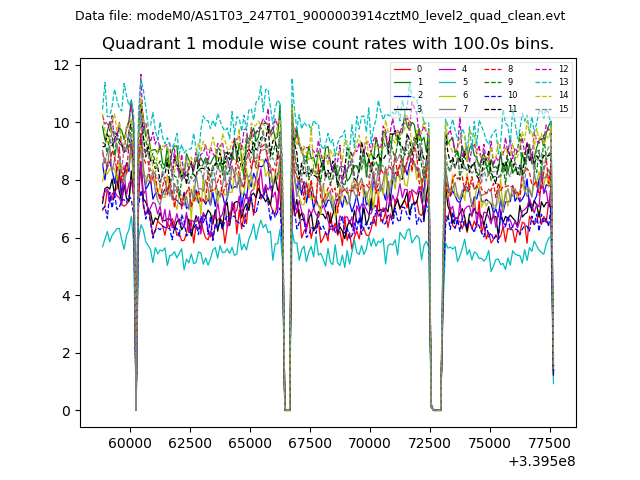
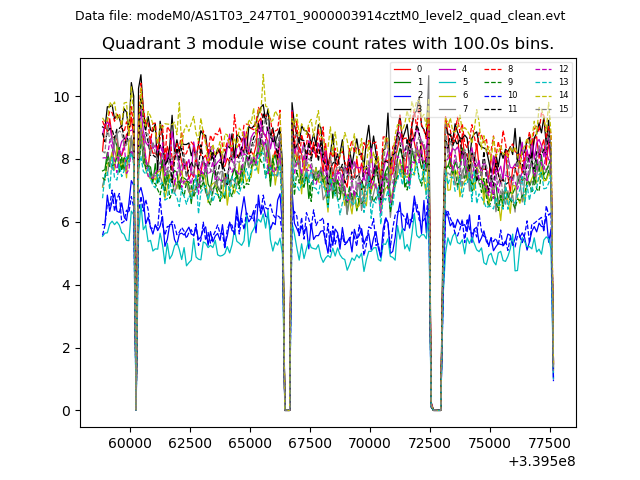
| Module-wise count rates for Quadrant A Data is divided into 100 sec bins |
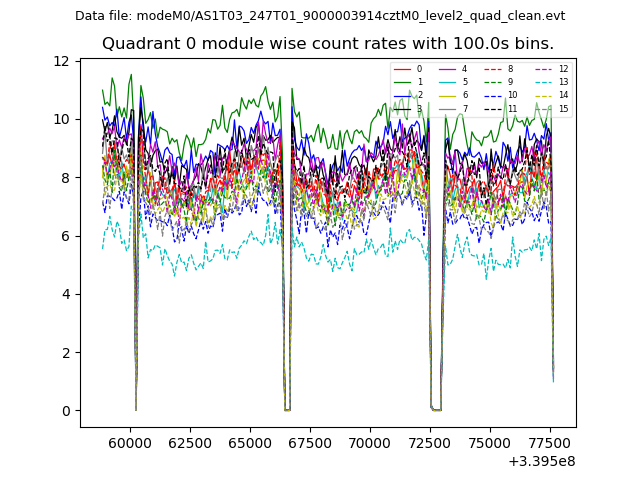 |
 |
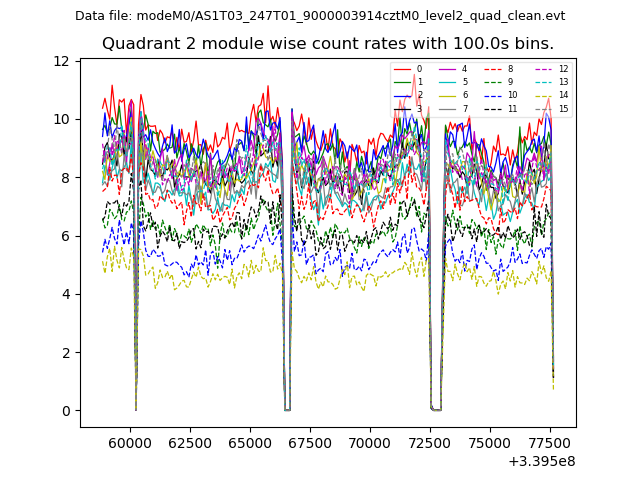
| Module-wise count rates for Quadrant B Data is divided into 100 sec bins |
 |
 |
| Module-wise count rates for Quadrant C Data is divided into 100 sec bins |
 |
 |
| Module-wise count rates for Quadrant D Data is divided into 100 sec bins |
 |
 |
| Parameter | Plot |
|---|---|
| CZT HV Monitor | 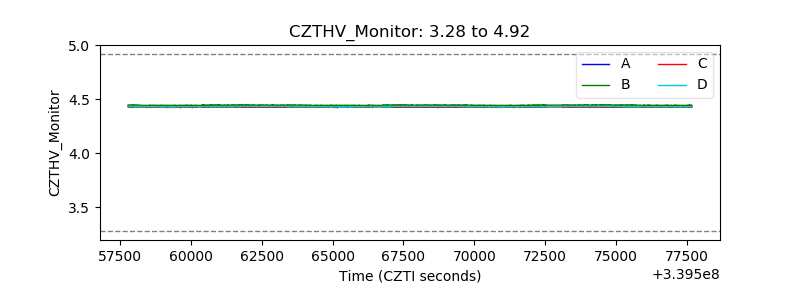 |
| D_VDD | 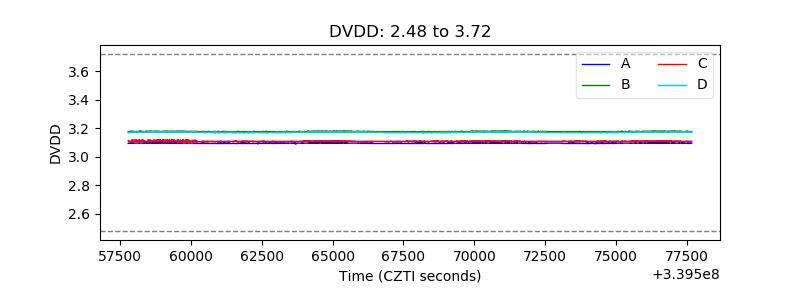 |
| Temperature 1 | 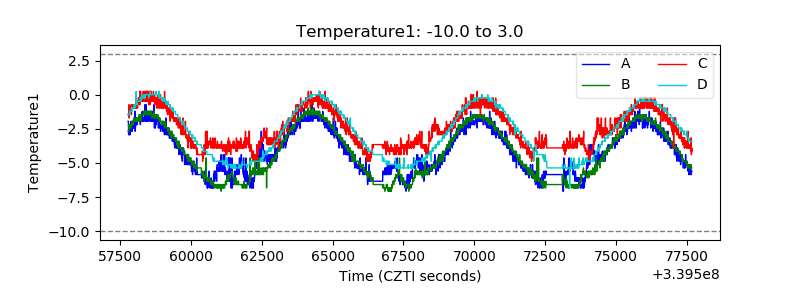 |
| Veto HV Monitor | 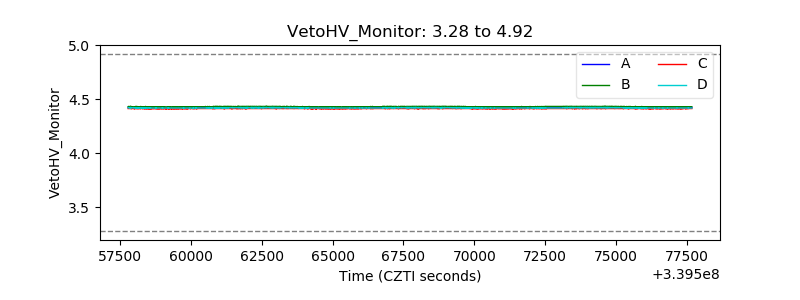 |
| Veto LLD | 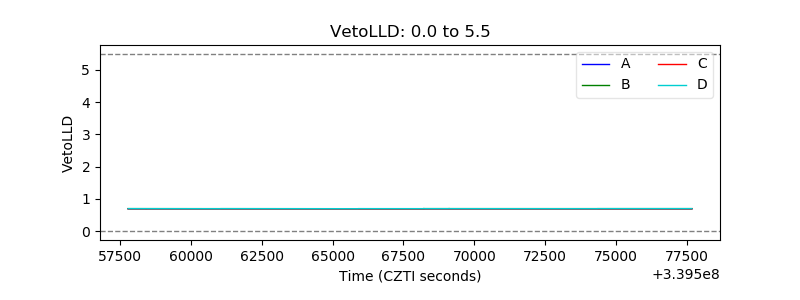 |
| Alpha Counter | 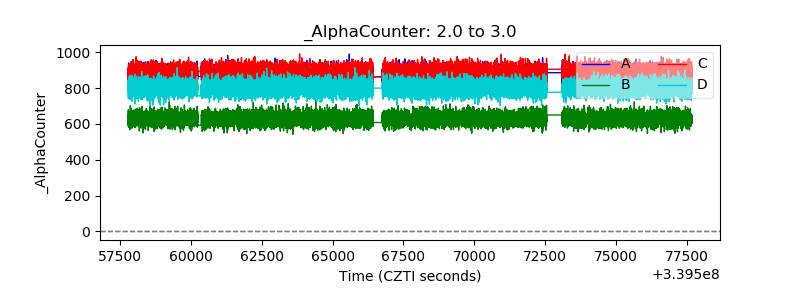 |
| _CPM_Rate | 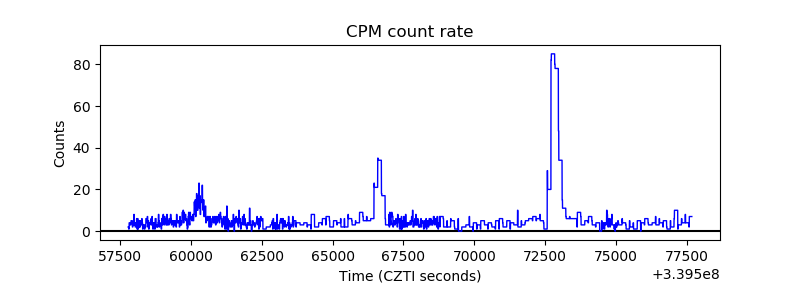 |
| CZT Counter | 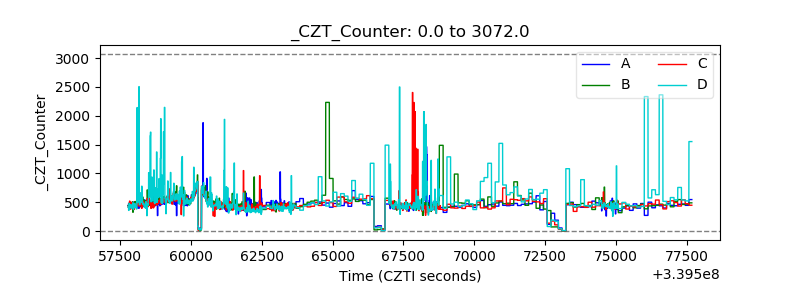 |
| +2.5 Volts monitor | 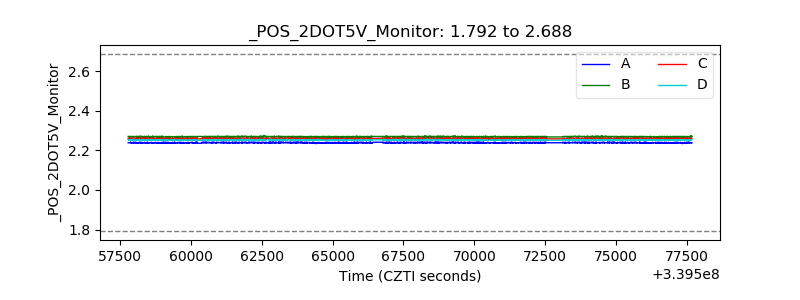 |
| +5 Volts monitor | 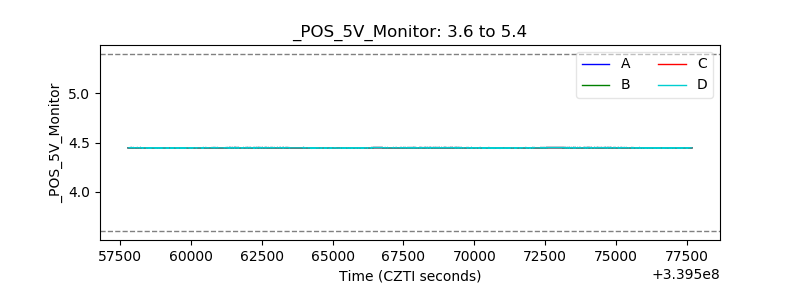 |
| _ROLL_ROT | 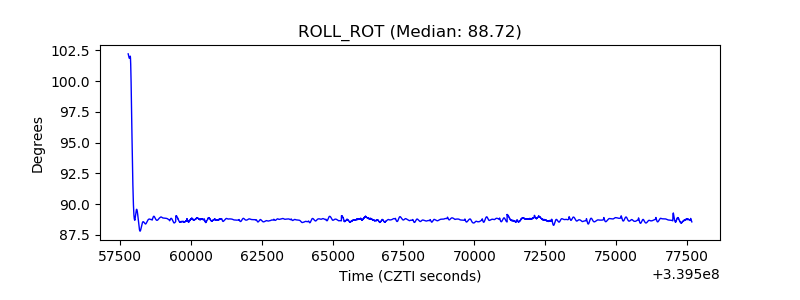 |
| _Roll_DEC | 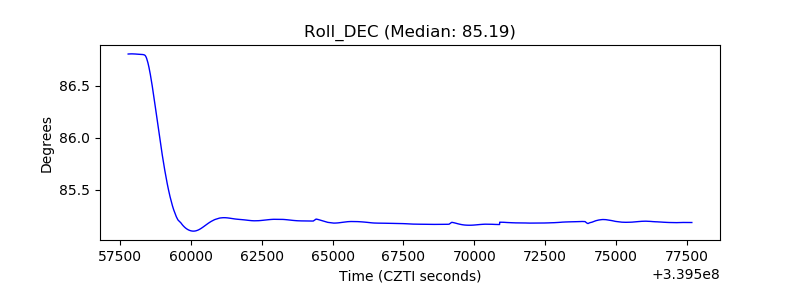 |
| _Roll_RA | 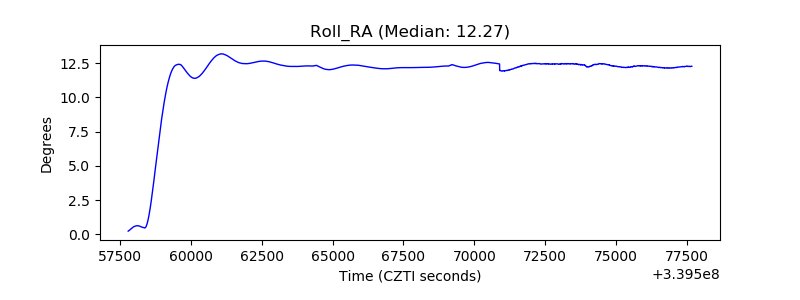 |
| Veto Counter | 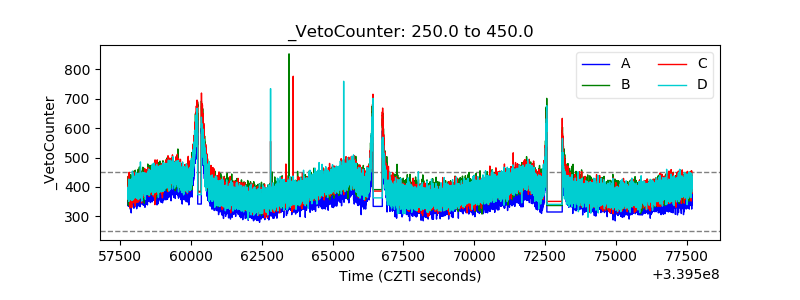 |