| Param | Original file | Final file |
|---|---|---|
| Filename | modeM0/AS1T03_247T01_9000003914_27145cztM0_level2.evt | modeM0/AS1T03_247T01_9000003914_27145cztM0_level2_quad_clean.evt |
| Size (bytes) | 304,001,280 | 79,879,680 |
| Size | 289.9 MB | 76.2 MB |
| Events in quadrant A | 2,103,393 | 536,190 |
| Events in quadrant B | 2,219,970 | 544,847 |
| Events in quadrant C | 2,108,209 | 524,812 |
| Events in quadrant D | 2,485,864 | 514,668 |
| Mode M9 | |||
|---|---|---|---|
| Quadrant | BADHDUFLAG | Total packets | Discarded packets |
| A | 0 | 1 | 0 |
| B | 0 | 1 | 0 |
| C | 0 | 1 | 0 |
| D | 0 | 1 | 0 |
| Mode M0 | |||
|---|---|---|---|
| Quadrant | BADHDUFLAG | Total packets | Discarded packets |
| A | 0 | 8931 | 0 |
| B | 0 | 9283 | 0 |
| C | 0 | 8914 | 0 |
| D | 0 | 10313 | 0 |
| Quadrant | Total seconds | Saturated seconds | Saturation percentage |
|---|---|---|---|
| A | 4243 | 53 | 1.249116% |
| B | 4242 | 81 | 1.909477% |
| C | 4242 | 94 | 2.215936% |
| D | 4242 | 54 | 1.272984% |
Noise dominated data is calculated using 1-second bins in cleaned event files. If a bin has >2000 counts, and if more than 50% of those come from <1% of pixels, then it is considered to be noise-dominated and hence unusable.
| Quadrant | # 1 sec bins | Bins with >0 counts | Bins with >2000 counts | High rate bins dominated by noise | Noise dominated (total time) | Noise dominated (detector-on time) | Marked lightcurve |
|---|---|---|---|---|---|---|---|
| A | 4373 | 4244 | 4 | 4 | 0.09% | 0.09% | 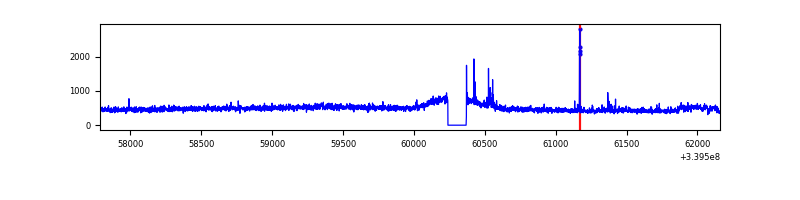 |
| B | 4372 | 4243 | 4 | 4 | 0.09% | 0.09% | 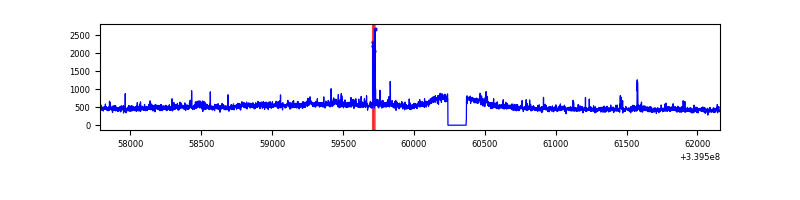 |
| C | 4372 | 4243 | 0 | 0 | 0.00% | 0.00% | 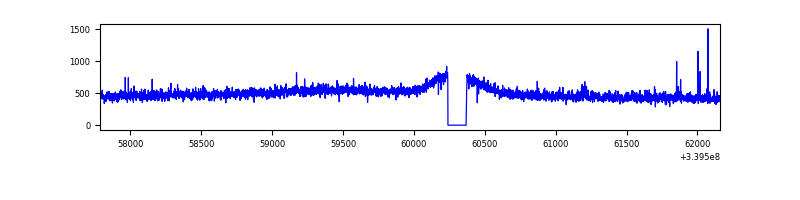 |
| D | 4372 | 4243 | 28 | 28 | 0.64% | 0.66% | 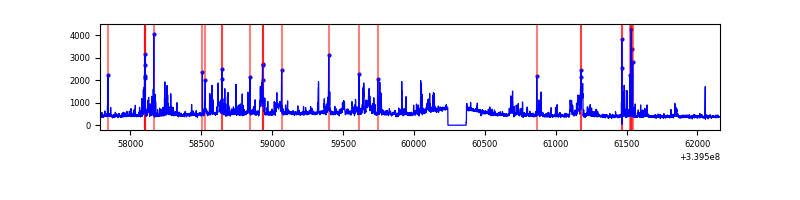 |
Top three noisy pixels from each quadrant. If the there are fewer than three noisy pixels in the level2.evt file, extra rows are filled as -1
| Pixel properties | Quadrant properties | ||||||
|---|---|---|---|---|---|---|---|
| Quadrant | DetID | PixID | Counts | Sigma | Mean | Median | Sigma |
| A | 14 | 235 | 41982 | 386.36 | 524 | 512 | 107.3 |
| A | 13 | 34 | 29631 | 271.29 | 524 | 512 | 107.3 |
| A | 13 | 254 | 7285 | 63.1 | 524 | 512 | 107.3 |
| B | 3 | 64 | 54248 | 528.74 | 528 | 514 | 101.6 |
| B | 3 | 112 | 53225 | 518.67 | 528 | 514 | 101.6 |
| B | 0 | 190 | 24781 | 238.79 | 528 | 514 | 101.6 |
| C | 14 | 238 | 82682 | 684.12 | 513 | 514 | 120.1 |
| C | 2 | 16 | 12141 | 96.8 | 513 | 514 | 120.1 |
| C | 8 | 128 | 4100 | 29.86 | 513 | 514 | 120.1 |
| D | 7 | 38 | 145965 | 1094.93 | 510 | 500 | 132.9 |
| D | 1 | 52 | 144968 | 1087.43 | 510 | 500 | 132.9 |
| D | 2 | 250 | 144367 | 1082.91 | 510 | 500 | 132.9 |
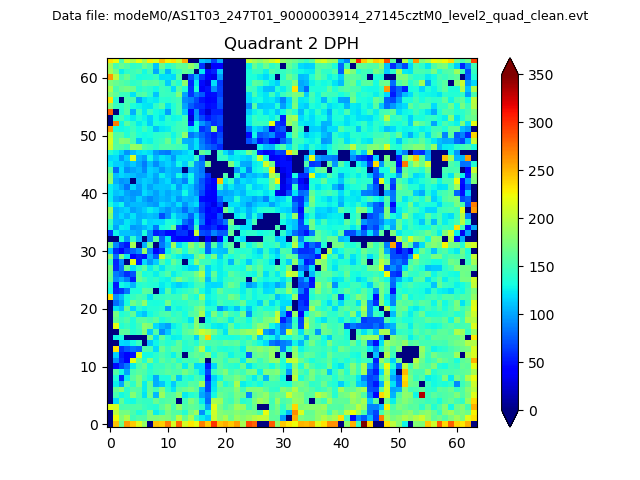
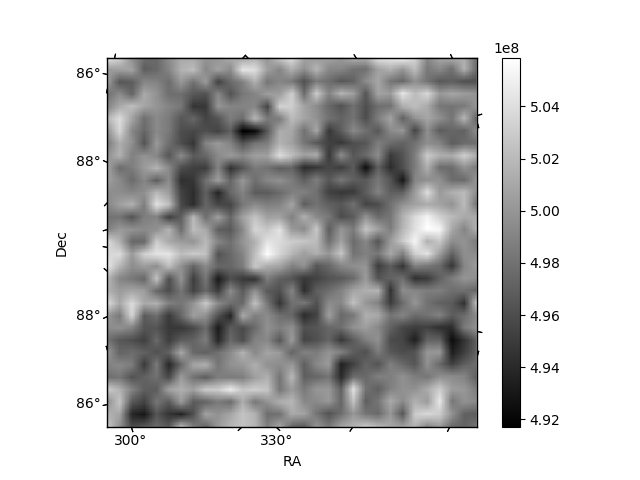
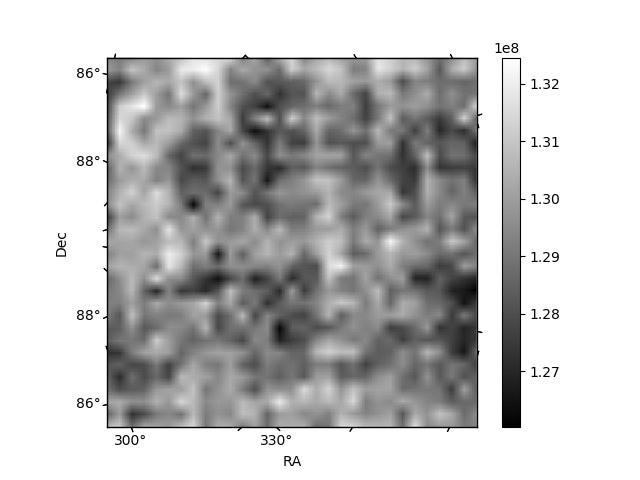
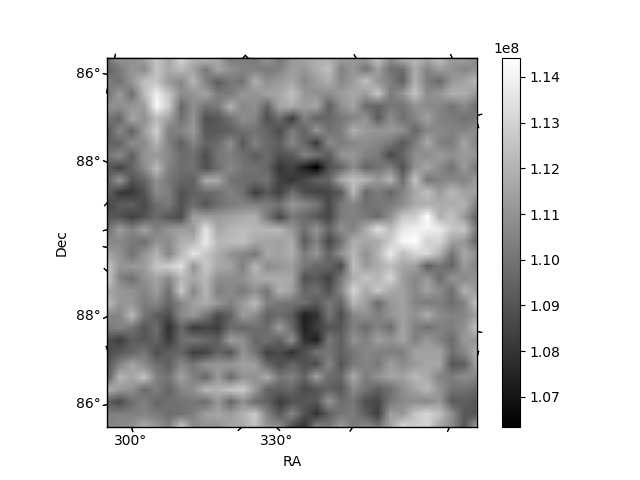
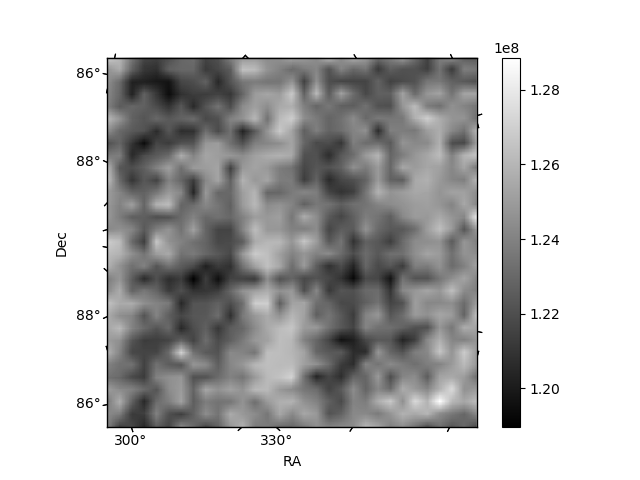
Histogram calculated using DETX and DETY for each event in the final _common_clean file
| Quadrant A | 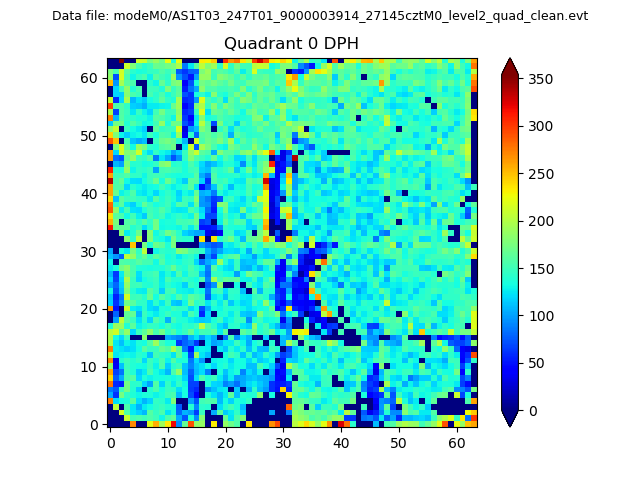 |
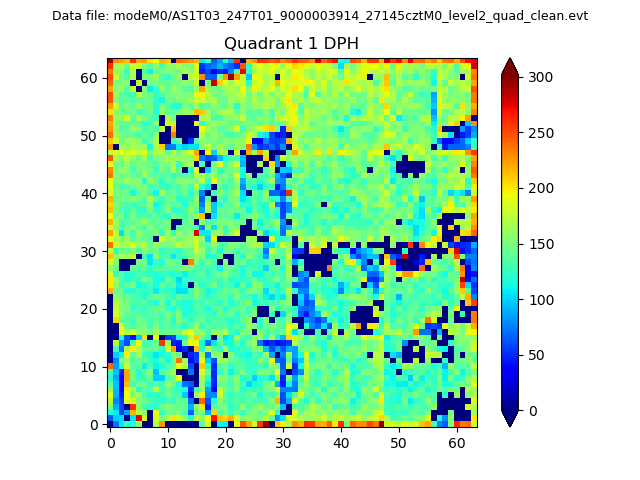 |
Quadrant B |
|---|---|---|---|
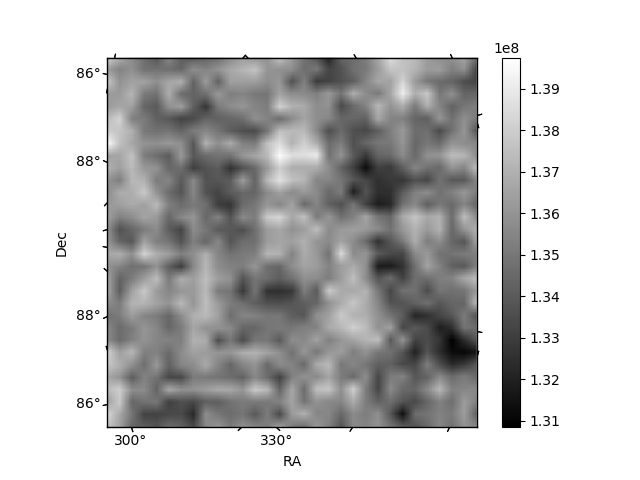
| Quadrant D | 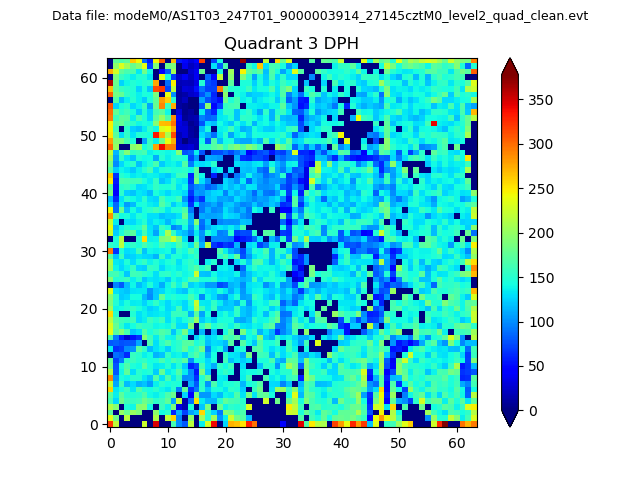 |
 |
Quadrant C |
| Plot type | Count rate plots | Images |
|---|---|---|
| Comparison with Poisson distribution Blue bars denote a histogram of data divided into 1 sec bins. Red curve is a Poisson curve with rate = median count rate of data. |
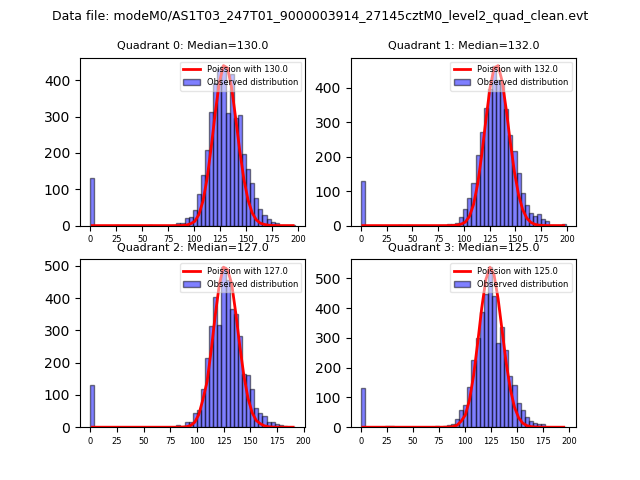 |
 |
| Quadrant-wise count rates Data is divided into 100 sec bins |
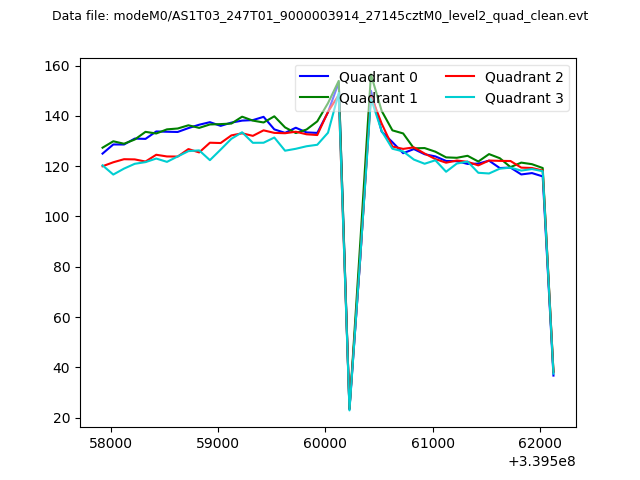 |
|
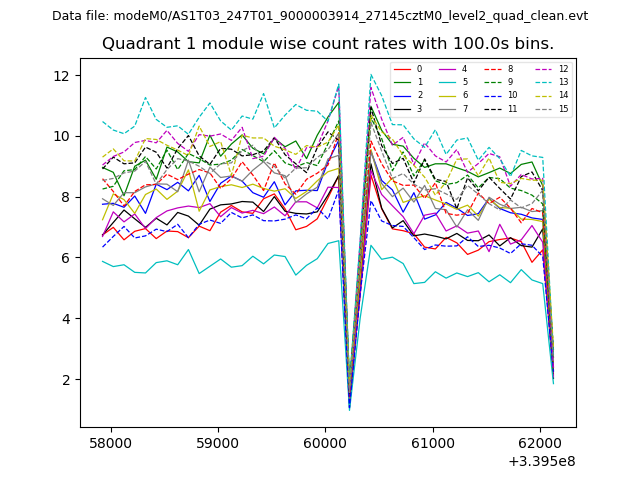
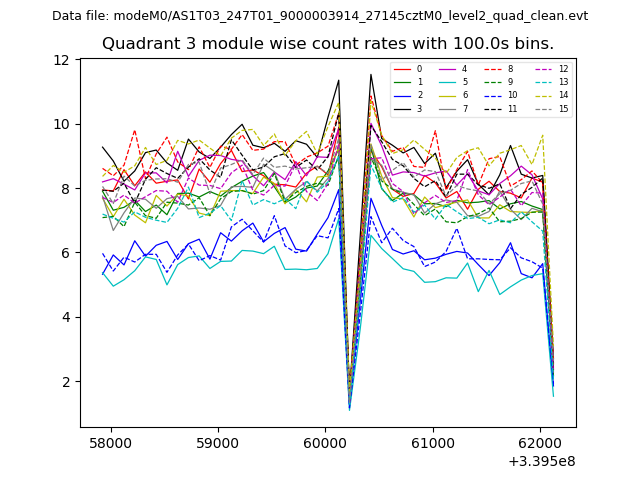
| Module-wise count rates for Quadrant A Data is divided into 100 sec bins |
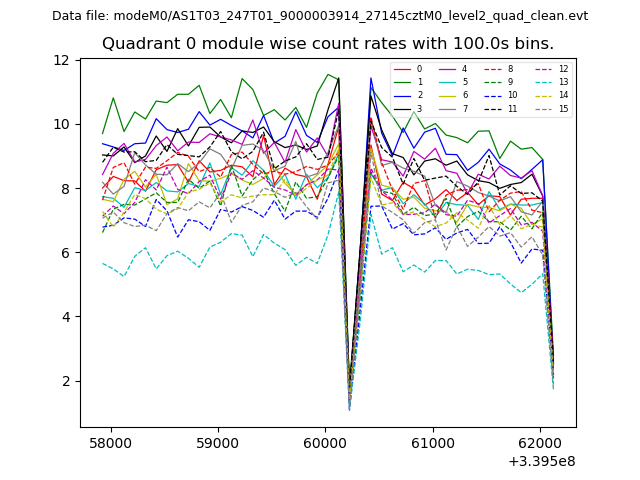 |
 |
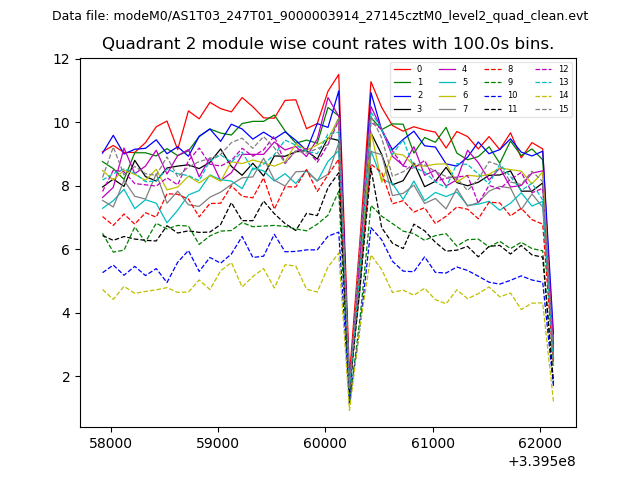
| Module-wise count rates for Quadrant B Data is divided into 100 sec bins |
 |
 |
| Module-wise count rates for Quadrant C Data is divided into 100 sec bins |
 |
 |
| Module-wise count rates for Quadrant D Data is divided into 100 sec bins |
 |
 |
| Parameter | Plot |
|---|---|
| CZT HV Monitor | 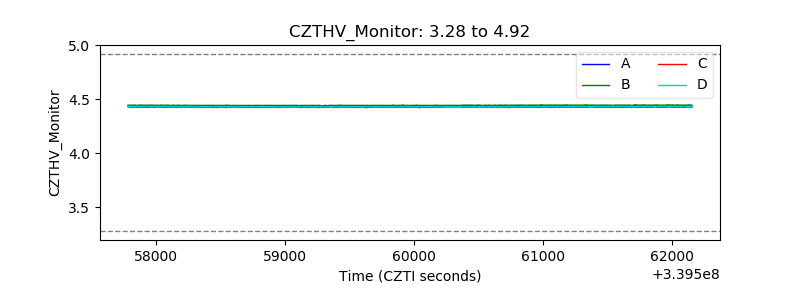 |
| D_VDD | 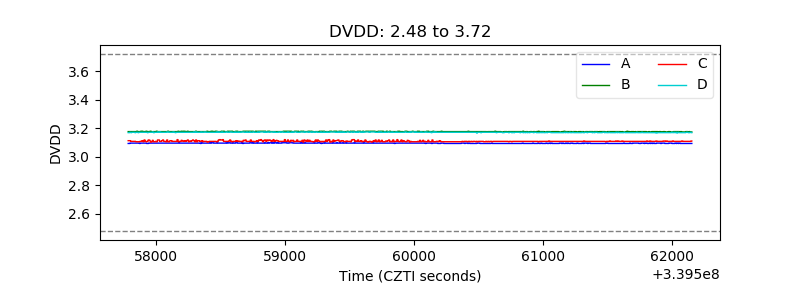 |
| Temperature 1 | 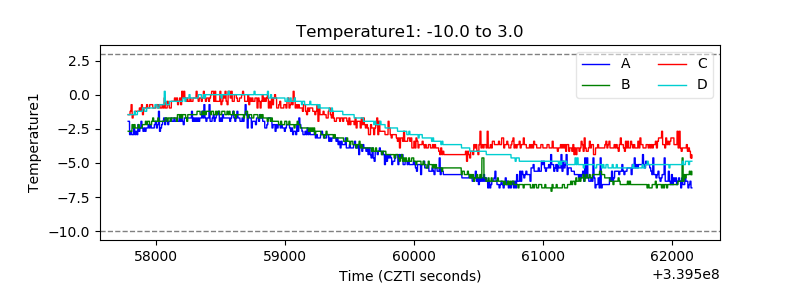 |
| Veto HV Monitor | 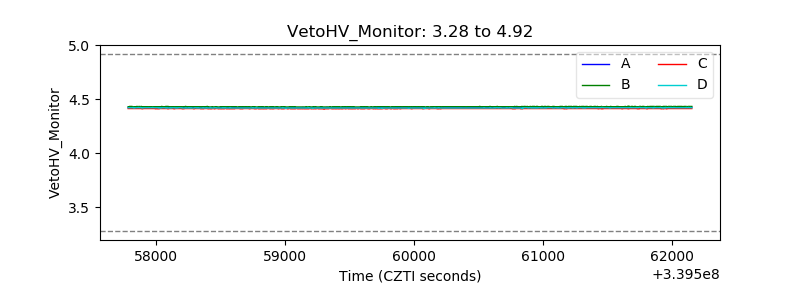 |
| Veto LLD | 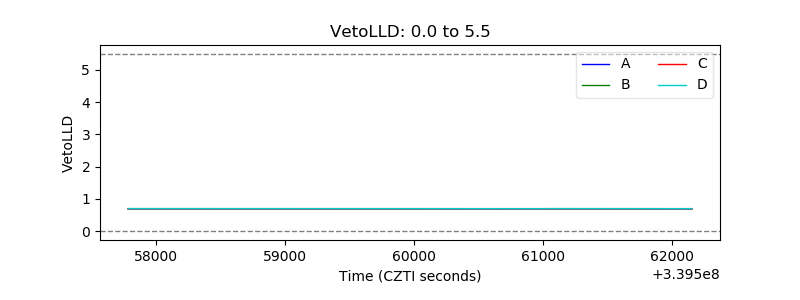 |
| Alpha Counter | 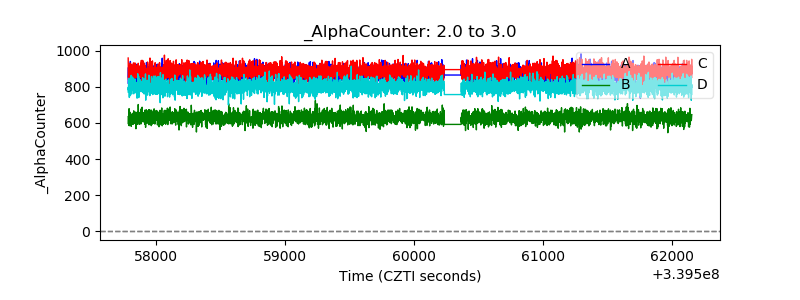 |
| _CPM_Rate | 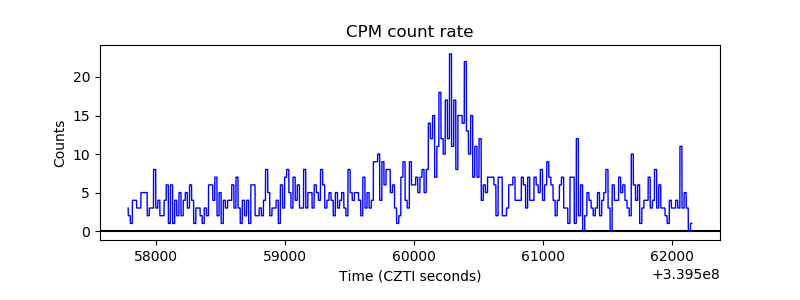 |
| CZT Counter | 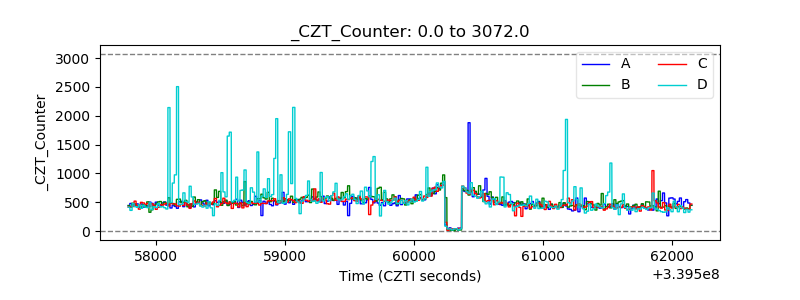 |
| +2.5 Volts monitor |  |
| +5 Volts monitor | 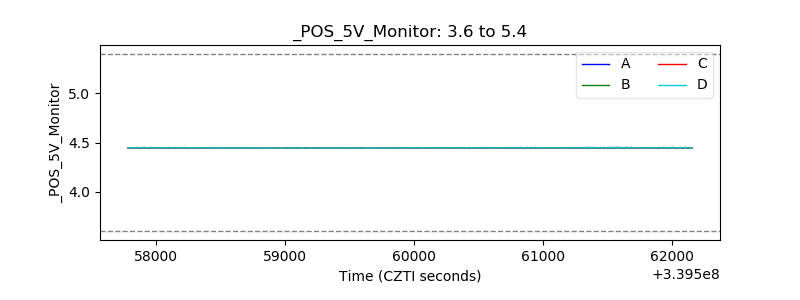 |
| _ROLL_ROT | 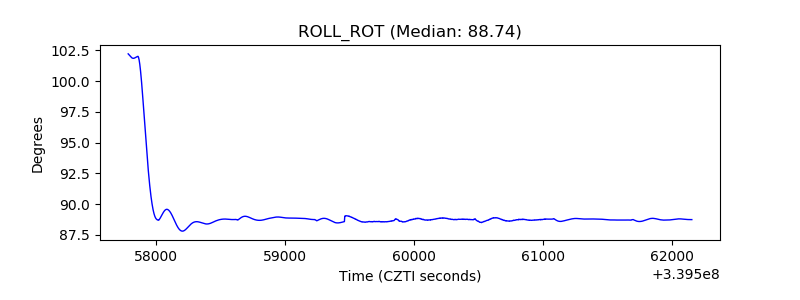 |
| _Roll_DEC | 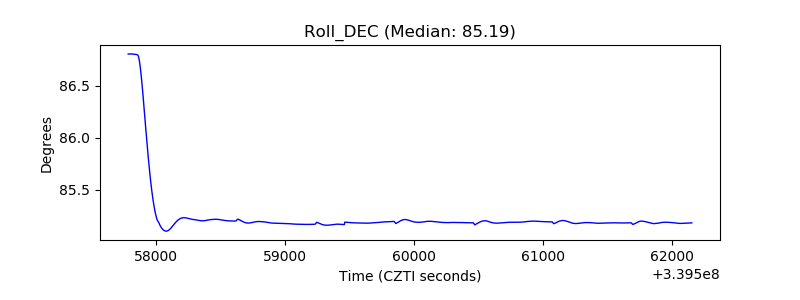 |
| _Roll_RA | 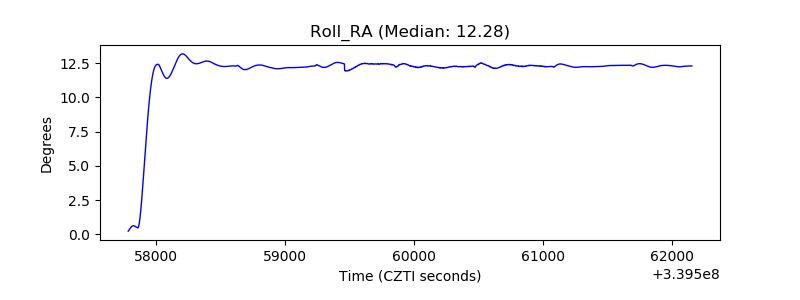 |
| Veto Counter | 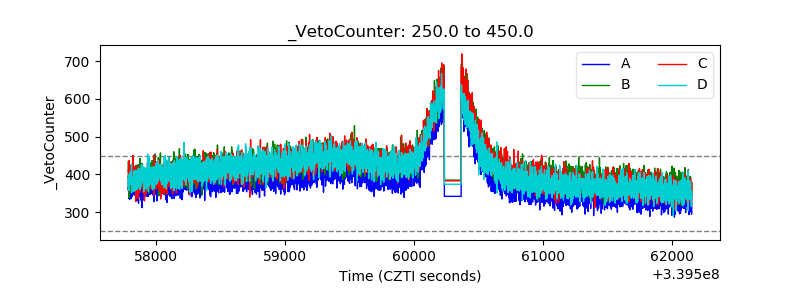 |