| Param | Original file | Final file |
|---|---|---|
| Filename | modeM0/AS1T03_247T01_9000003914_27146cztM0_level2.evt | modeM0/AS1T03_247T01_9000003914_27146cztM0_level2_quad_clean.evt |
| Size (bytes) | 500,273,280 | 137,208,960 |
| Size | 477.1 MB | 130.9 MB |
| Events in quadrant A | 3,518,360 | 914,815 |
| Events in quadrant B | 3,586,240 | 933,815 |
| Events in quadrant C | 3,560,533 | 906,019 |
| Events in quadrant D | 3,985,745 | 888,939 |
| Mode M9 | |||
|---|---|---|---|
| Quadrant | BADHDUFLAG | Total packets | Discarded packets |
| A | 0 | 3 | 0 |
| B | 0 | 3 | 0 |
| C | 0 | 3 | 0 |
| D | 0 | 3 | 0 |
| Mode M0 | |||
|---|---|---|---|
| Quadrant | BADHDUFLAG | Total packets | Discarded packets |
| A | 0 | 15263 | 0 |
| B | 0 | 15441 | 0 |
| C | 0 | 15528 | 0 |
| D | 0 | 17194 | 0 |
| Quadrant | Total seconds | Saturated seconds | Saturation percentage |
|---|---|---|---|
| A | 7358 | 61 | 0.829030% |
| B | 7358 | 94 | 1.277521% |
| C | 7358 | 104 | 1.413428% |
| D | 7358 | 107 | 1.454200% |
Noise dominated data is calculated using 1-second bins in cleaned event files. If a bin has >2000 counts, and if more than 50% of those come from <1% of pixels, then it is considered to be noise-dominated and hence unusable.
| Quadrant | # 1 sec bins | Bins with >0 counts | Bins with >2000 counts | High rate bins dominated by noise | Noise dominated (total time) | Noise dominated (detector-on time) | Marked lightcurve |
|---|---|---|---|---|---|---|---|
| A | 7683 | 7359 | 17 | 17 | 0.22% | 0.23% | 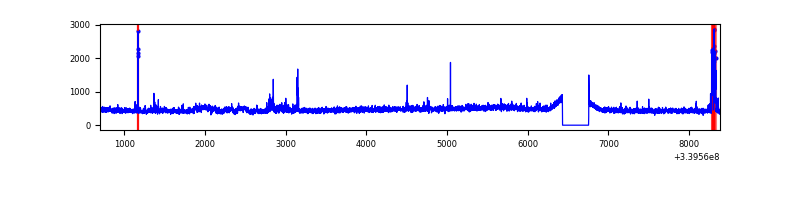 |
| B | 7683 | 7359 | 28 | 28 | 0.36% | 0.38% | 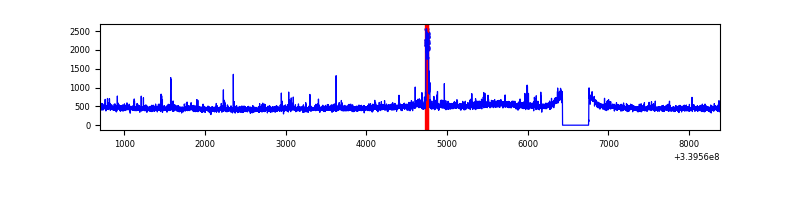 |
| C | 7683 | 7359 | 37 | 37 | 0.48% | 0.50% | 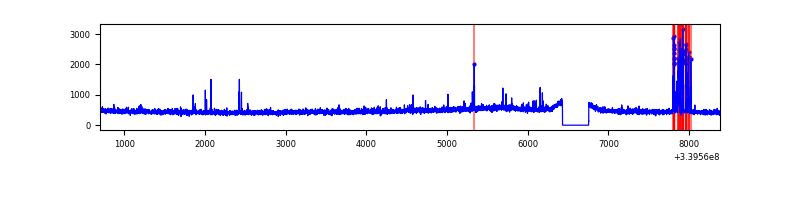 |
| D | 7683 | 7359 | 64 | 64 | 0.83% | 0.87% | 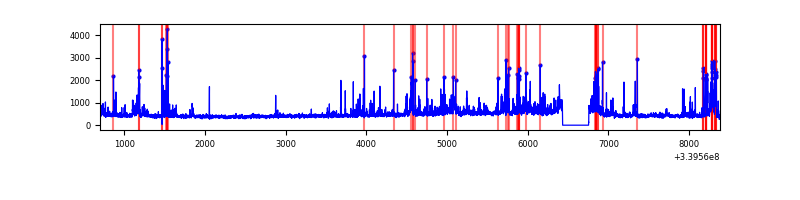 |
Top three noisy pixels from each quadrant. If the there are fewer than three noisy pixels in the level2.evt file, extra rows are filled as -1
| Pixel properties | Quadrant properties | ||||||
|---|---|---|---|---|---|---|---|
| Quadrant | DetID | PixID | Counts | Sigma | Mean | Median | Sigma |
| A | 14 | 235 | 148017 | 858.62 | 853 | 833 | 171.4 |
| A | 13 | 34 | 59742 | 343.66 | 853 | 833 | 171.4 |
| A | 13 | 254 | 12188 | 66.24 | 853 | 833 | 171.4 |
| B | 5 | 172 | 74945 | 456.89 | 856 | 832 | 162.2 |
| B | 3 | 112 | 64307 | 391.31 | 856 | 832 | 162.2 |
| B | 3 | 64 | 45517 | 275.47 | 856 | 832 | 162.2 |
| C | 15 | 208 | 147723 | 756.9 | 829 | 835 | 194.1 |
| C | 14 | 238 | 133190 | 682.01 | 829 | 835 | 194.1 |
| C | 2 | 16 | 45943 | 232.44 | 829 | 835 | 194.1 |
| D | 1 | 52 | 349742 | 1671.04 | 826 | 804 | 208.8 |
| D | 7 | 38 | 200927 | 958.38 | 826 | 804 | 208.8 |
| D | 2 | 250 | 155954 | 743.0 | 826 | 804 | 208.8 |
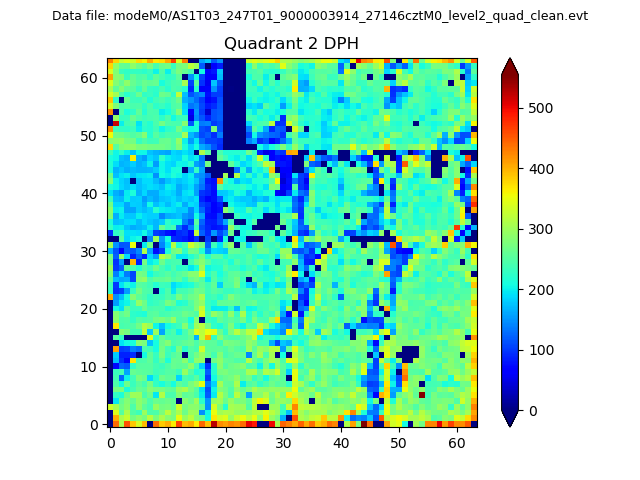
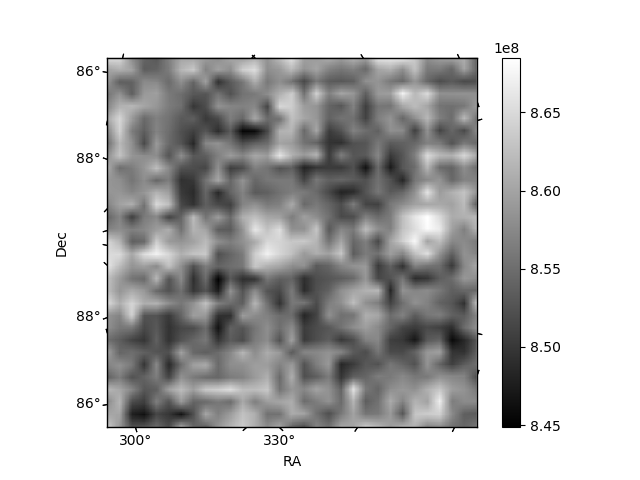
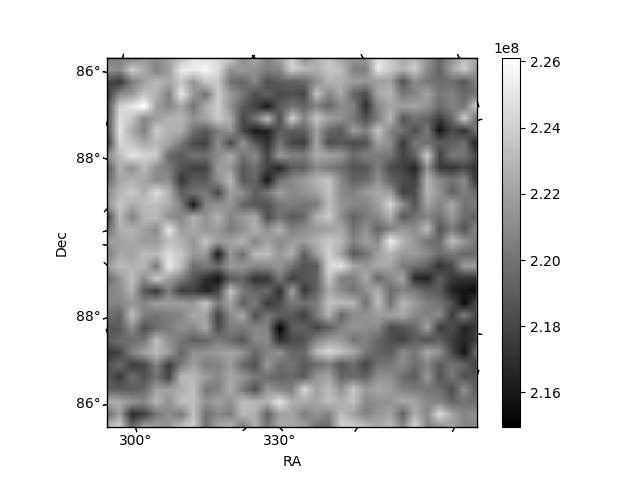
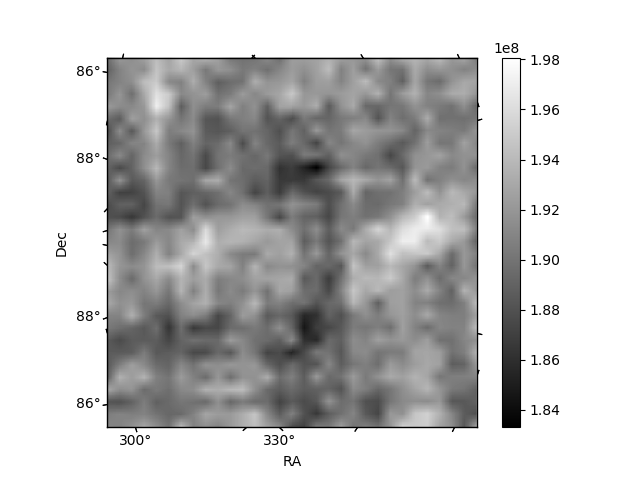
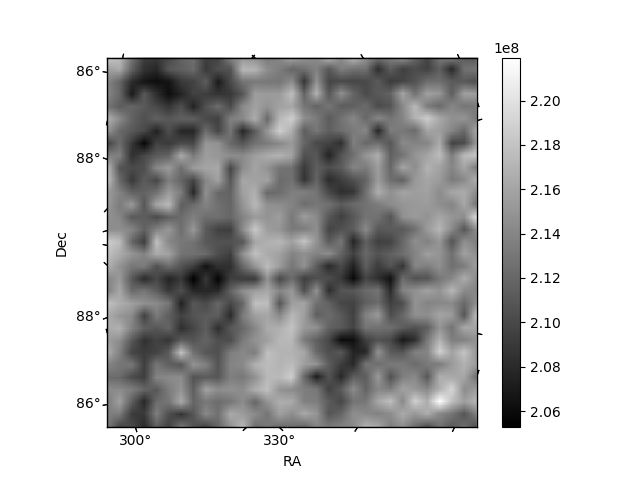
Histogram calculated using DETX and DETY for each event in the final _common_clean file
| Quadrant A | 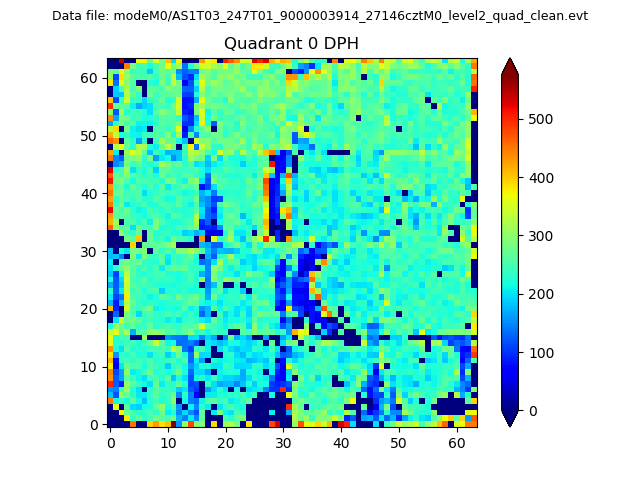 |
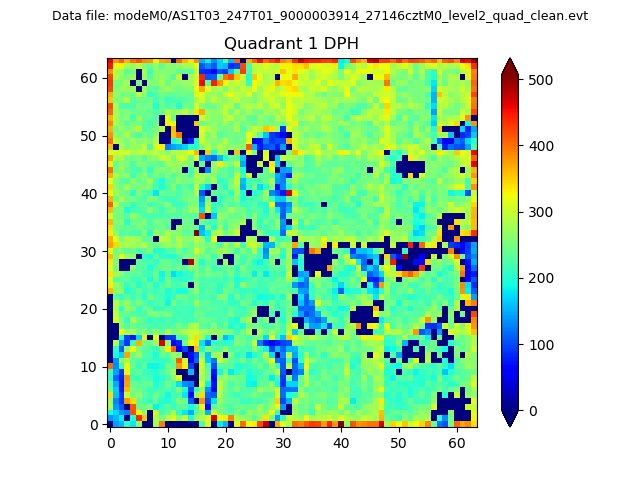 |
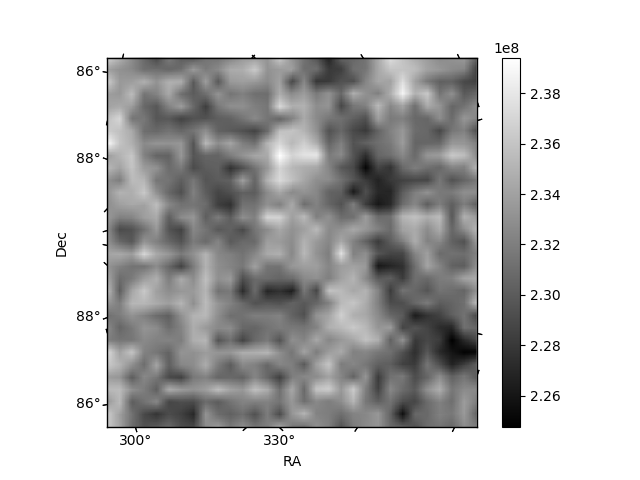
Quadrant B |
|---|---|---|---|
| Quadrant D | 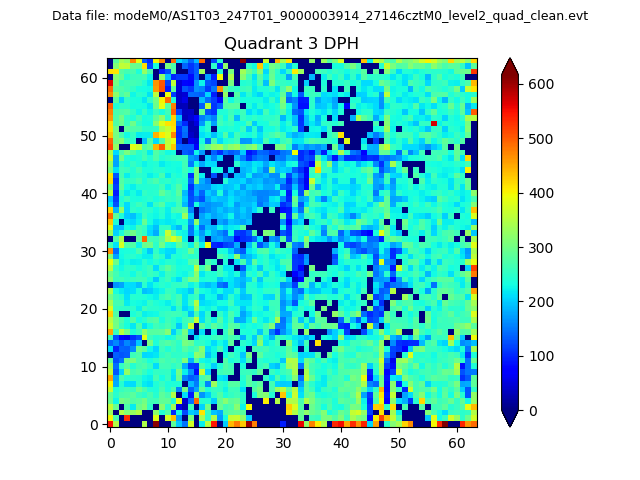 |
 |
Quadrant C |
| Plot type | Count rate plots | Images |
|---|---|---|
| Comparison with Poisson distribution Blue bars denote a histogram of data divided into 1 sec bins. Red curve is a Poisson curve with rate = median count rate of data. |
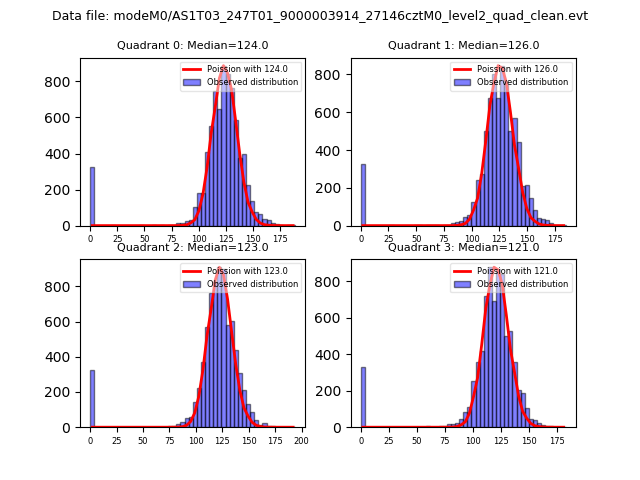 |
 |
| Quadrant-wise count rates Data is divided into 100 sec bins |
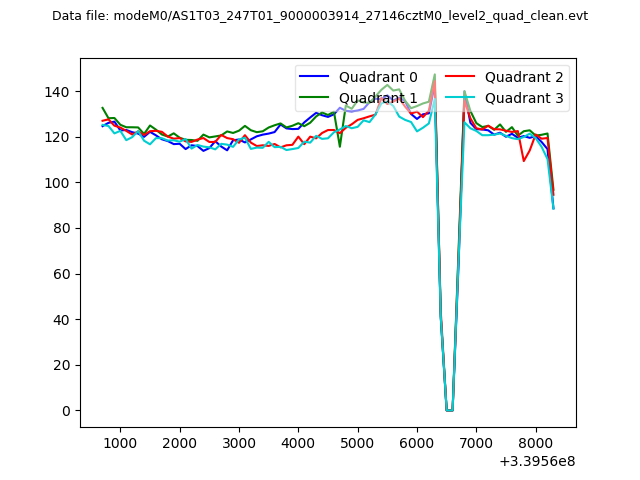 |
|
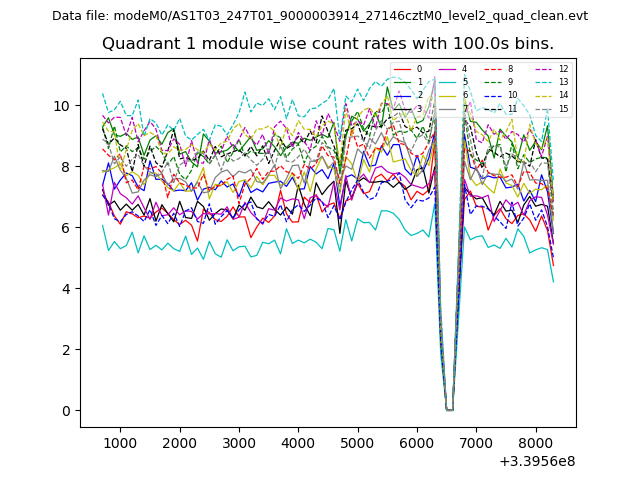
| Module-wise count rates for Quadrant A Data is divided into 100 sec bins |
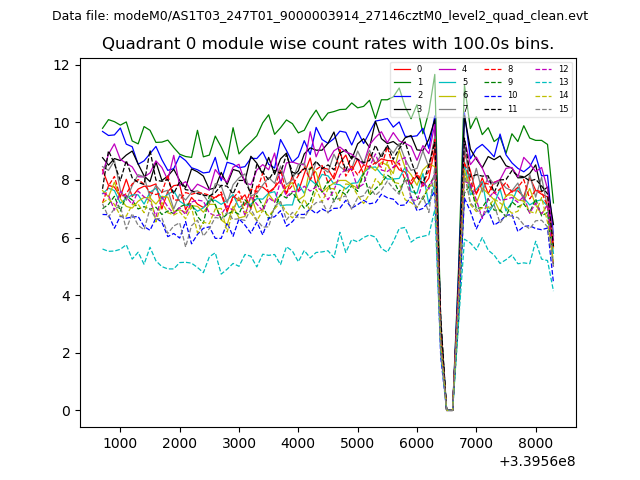 |
 |
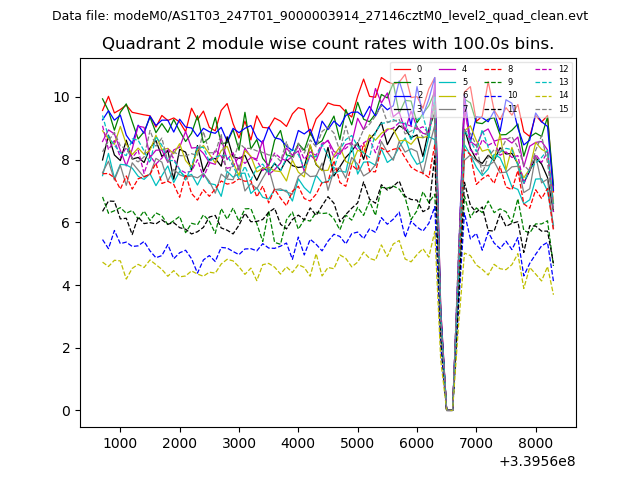
| Module-wise count rates for Quadrant B Data is divided into 100 sec bins |
 |
 |
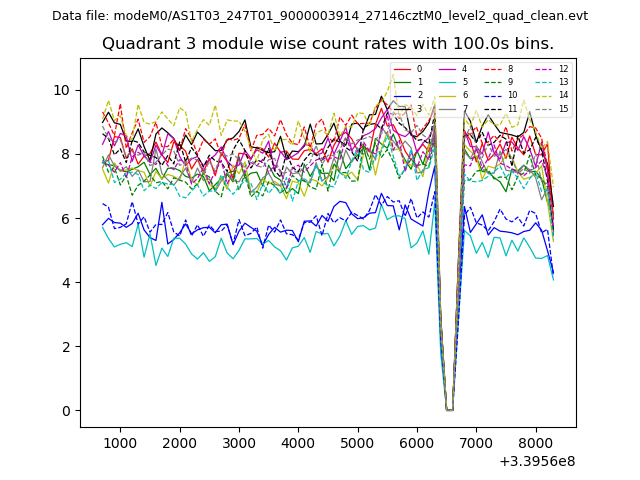
| Module-wise count rates for Quadrant C Data is divided into 100 sec bins |
 |
 |
| Module-wise count rates for Quadrant D Data is divided into 100 sec bins |
 |
 |
| Parameter | Plot |
|---|---|
| CZT HV Monitor | 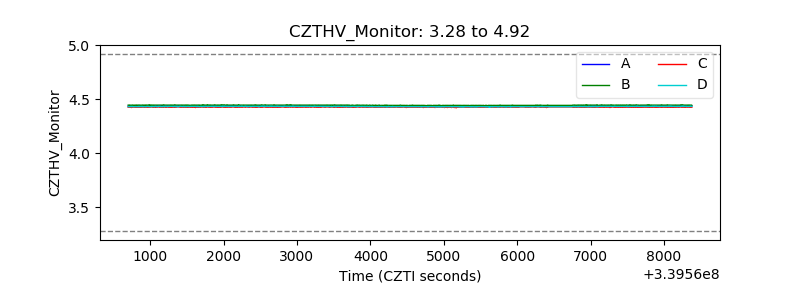 |
| D_VDD | 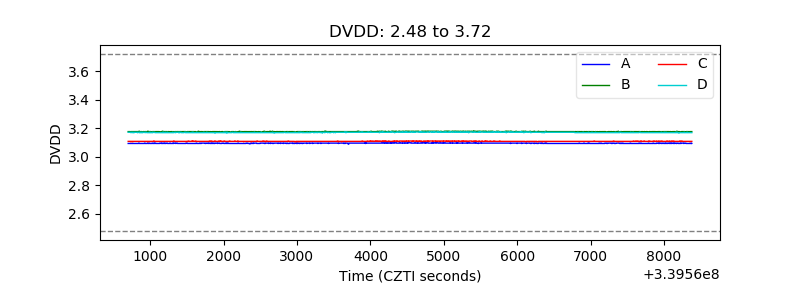 |
| Temperature 1 | 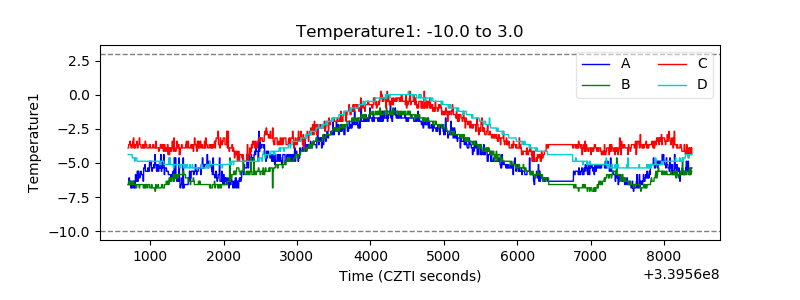 |
| Veto HV Monitor |  |
| Veto LLD | 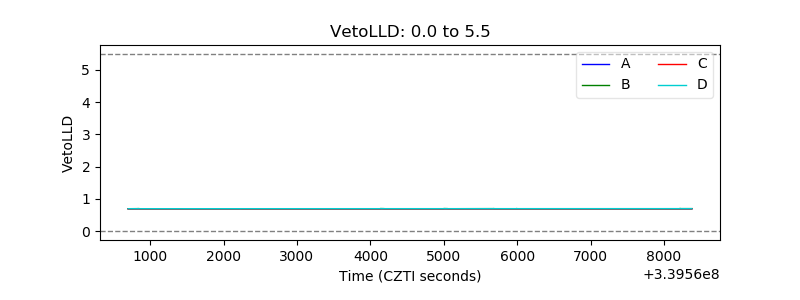 |
| Alpha Counter | 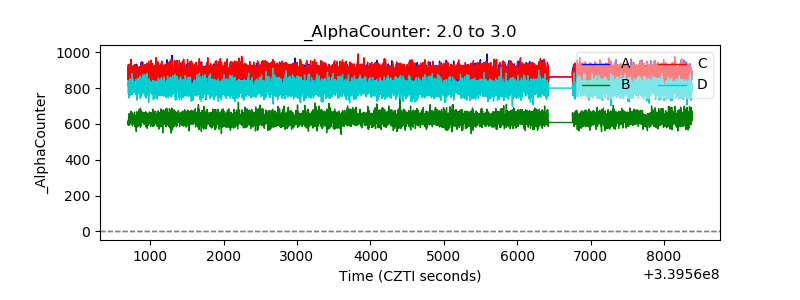 |
| _CPM_Rate | 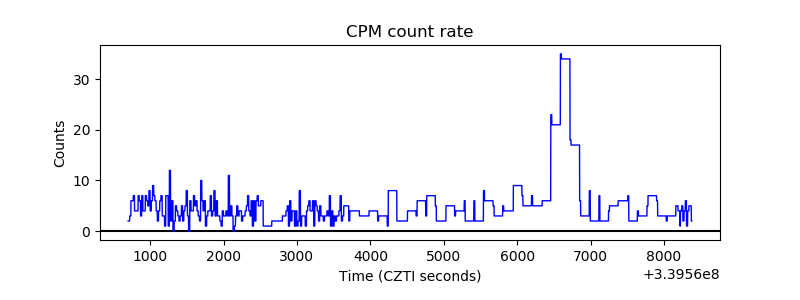 |
| CZT Counter | 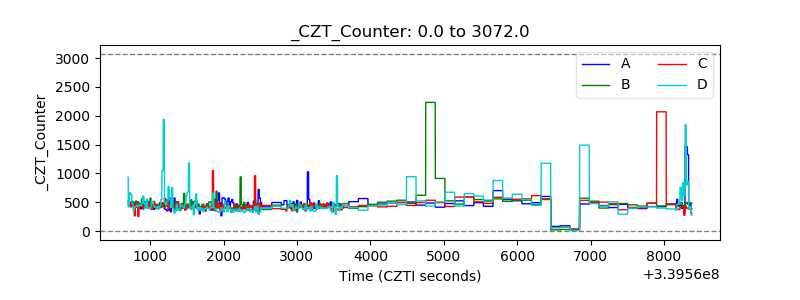 |
| +2.5 Volts monitor | 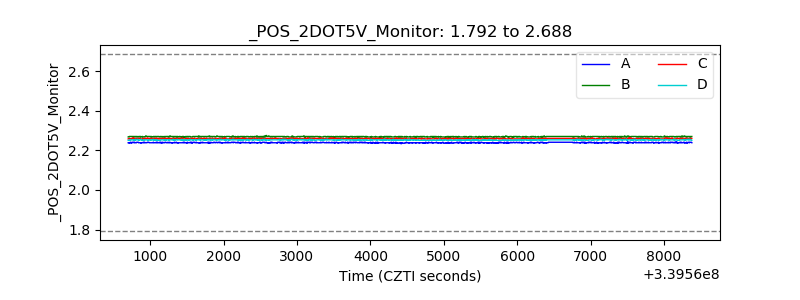 |
| +5 Volts monitor | 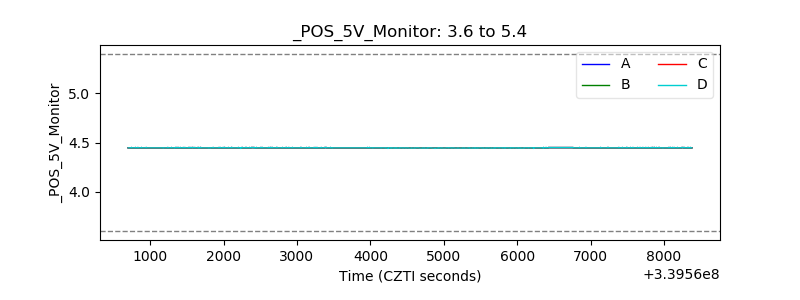 |
| _ROLL_ROT | 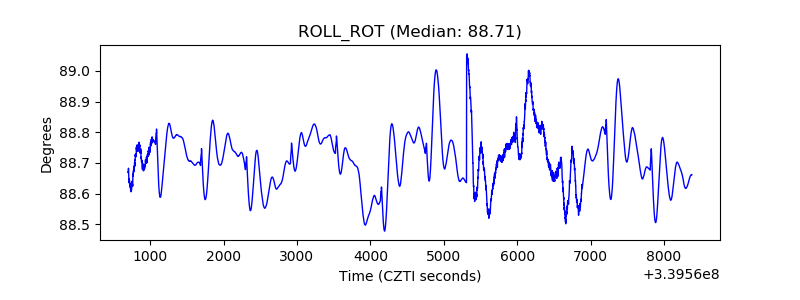 |
| _Roll_DEC | 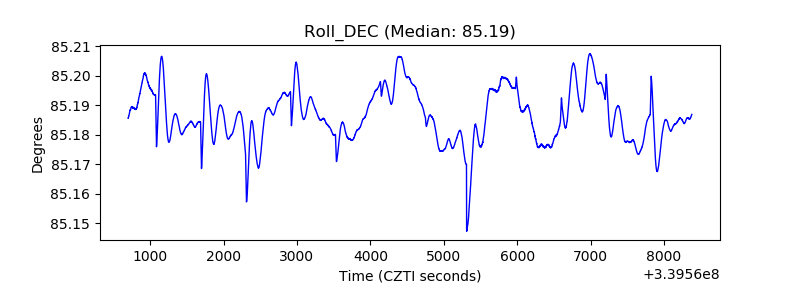 |
| _Roll_RA | 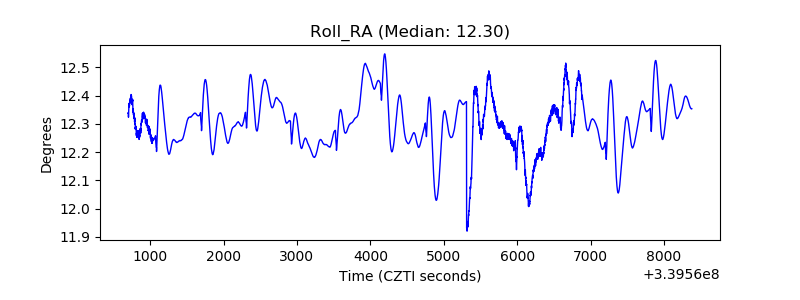 |
| Veto Counter | 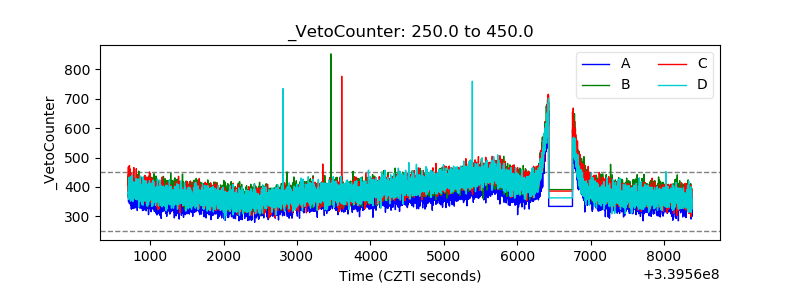 |