| Param | Original file | Final file |
|---|---|---|
| Filename | modeM0/AS1T03_247T01_9000003914_27148cztM0_level2.evt | modeM0/AS1T03_247T01_9000003914_27148cztM0_level2_quad_clean.evt |
| Size (bytes) | 674,277,120 | 175,308,480 |
| Size | 643.0 MB | 167.2 MB |
| Events in quadrant A | 4,468,744 | 1,176,548 |
| Events in quadrant B | 4,561,357 | 1,203,524 |
| Events in quadrant C | 4,488,553 | 1,151,445 |
| Events in quadrant D | 6,257,233 | 1,118,840 |
| Mode M9 | |||
|---|---|---|---|
| Quadrant | BADHDUFLAG | Total packets | Discarded packets |
| A | 0 | 6 | 0 |
| B | 0 | 6 | 0 |
| C | 0 | 6 | 0 |
| D | 0 | 6 | 0 |
| Mode M0 | |||
|---|---|---|---|
| Quadrant | BADHDUFLAG | Total packets | Discarded packets |
| A | 0 | 19715 | 0 |
| B | 0 | 19584 | 0 |
| C | 0 | 19640 | 0 |
| D | 0 | 25236 | 0 |
| Quadrant | Total seconds | Saturated seconds | Saturation percentage |
|---|---|---|---|
| A | 9519 | 59 | 0.619813% |
| B | 9520 | 37 | 0.388655% |
| C | 9520 | 105 | 1.102941% |
| D | 9520 | 283 | 2.972689% |
Noise dominated data is calculated using 1-second bins in cleaned event files. If a bin has >2000 counts, and if more than 50% of those come from <1% of pixels, then it is considered to be noise-dominated and hence unusable.
| Quadrant | # 1 sec bins | Bins with >0 counts | Bins with >2000 counts | High rate bins dominated by noise | Noise dominated (total time) | Noise dominated (detector-on time) | Marked lightcurve |
|---|---|---|---|---|---|---|---|
| A | 10064 | 9520 | 20 | 20 | 0.20% | 0.21% | 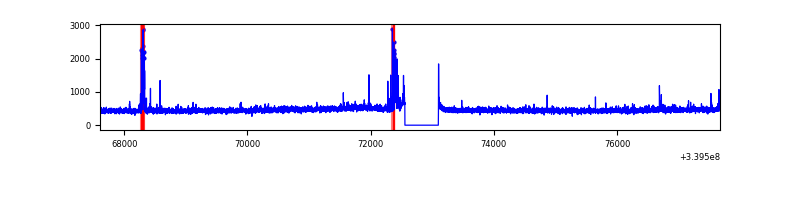 |
| B | 10065 | 9521 | 0 | 0 | 0.00% | 0.00% | 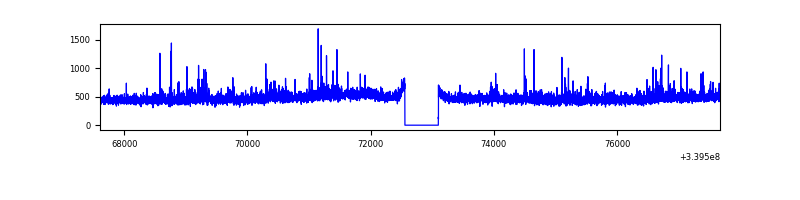 |
| C | 10065 | 9521 | 38 | 38 | 0.38% | 0.40% | 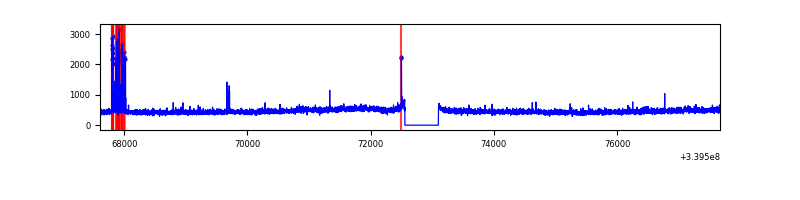 |
| D | 10065 | 9521 | 232 | 232 | 2.31% | 2.44% | 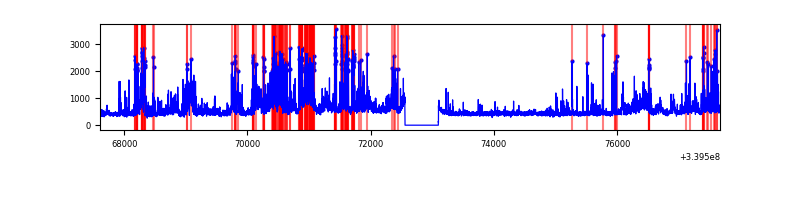 |
Top three noisy pixels from each quadrant. If the there are fewer than three noisy pixels in the level2.evt file, extra rows are filled as -1
| Pixel properties | Quadrant properties | ||||||
|---|---|---|---|---|---|---|---|
| Quadrant | DetID | PixID | Counts | Sigma | Mean | Median | Sigma |
| A | 14 | 235 | 176447 | 796.54 | 1103 | 1080 | 220.2 |
| A | 0 | 13 | 24634 | 106.99 | 1103 | 1080 | 220.2 |
| A | 13 | 254 | 14509 | 61.0 | 1103 | 1080 | 220.2 |
| B | 3 | 112 | 203456 | 968.22 | 1097 | 1067 | 209.0 |
| B | 12 | 111 | 25787 | 118.26 | 1097 | 1067 | 209.0 |
| B | 11 | 111 | 23286 | 106.29 | 1097 | 1067 | 209.0 |
| C | 14 | 238 | 171542 | 690.5 | 1060 | 1066 | 246.9 |
| C | 15 | 208 | 159477 | 641.64 | 1060 | 1066 | 246.9 |
| C | 8 | 222 | 14546 | 54.6 | 1060 | 1066 | 246.9 |
| D | 1 | 52 | 1188548 | 4466.11 | 1058 | 1032 | 265.9 |
| D | 7 | 38 | 388622 | 1457.68 | 1058 | 1032 | 265.9 |
| D | 12 | 233 | 336267 | 1260.78 | 1058 | 1032 | 265.9 |
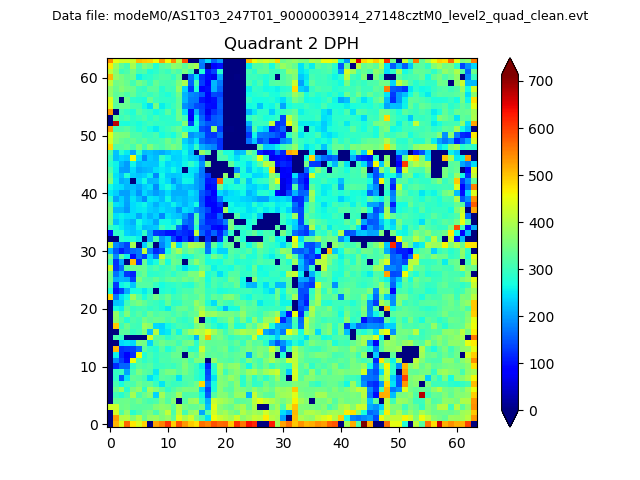
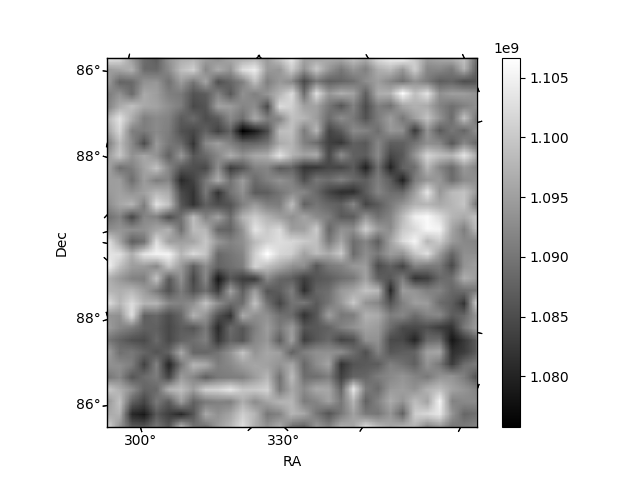
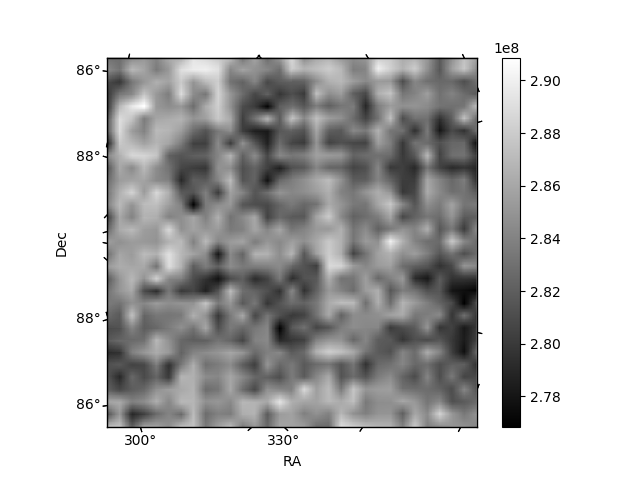
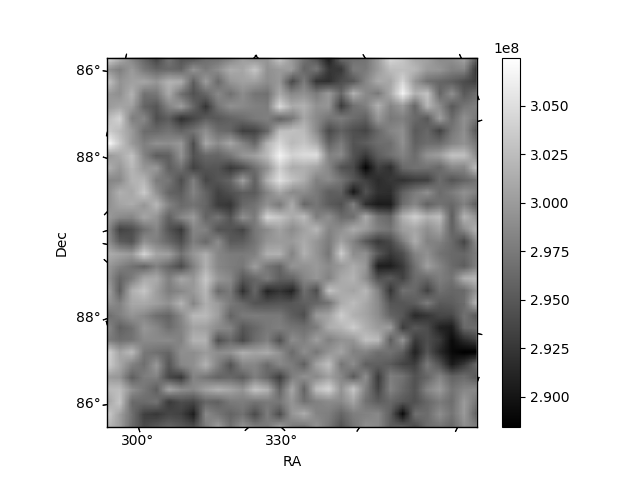
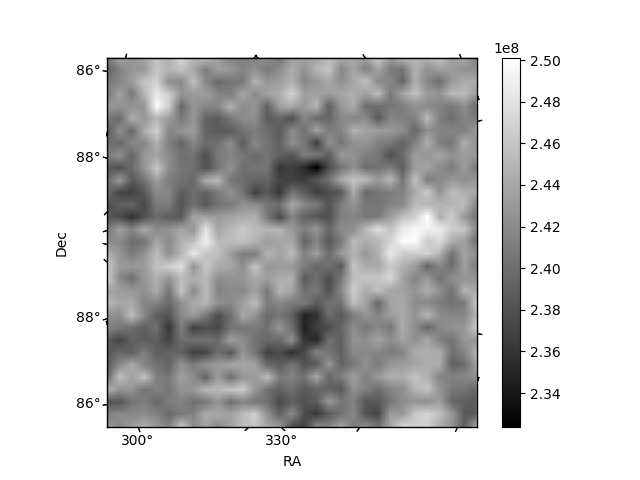
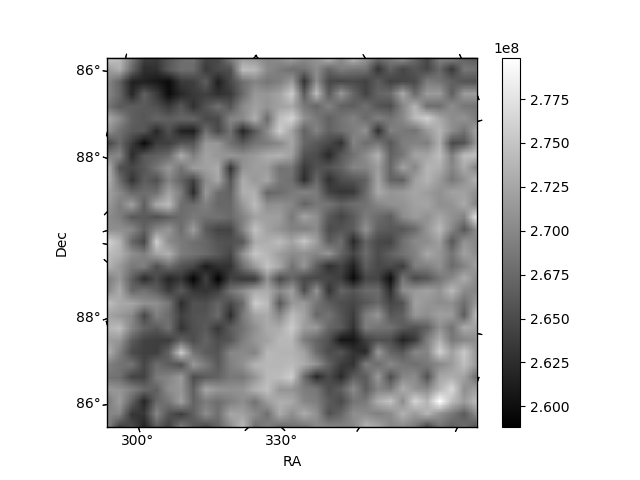
Histogram calculated using DETX and DETY for each event in the final _common_clean file
| Quadrant A | 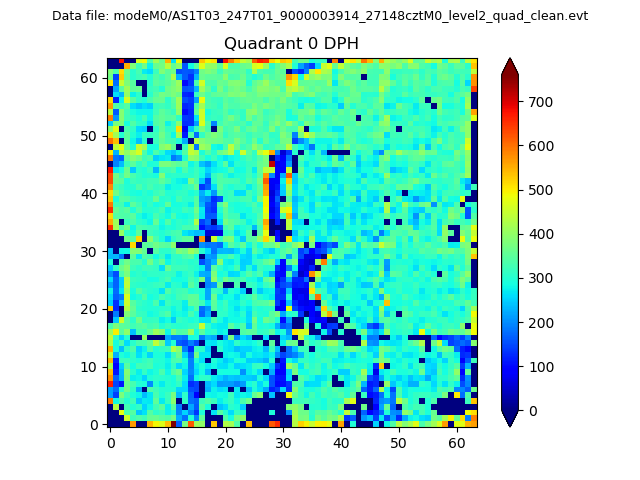 |
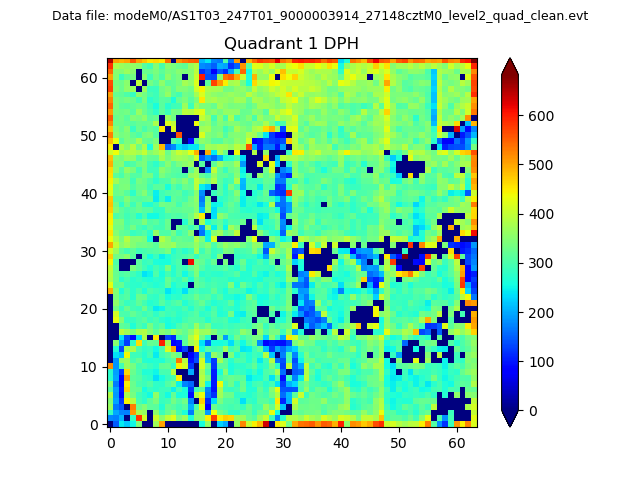 |
Quadrant B |
|---|---|---|---|
| Quadrant D | 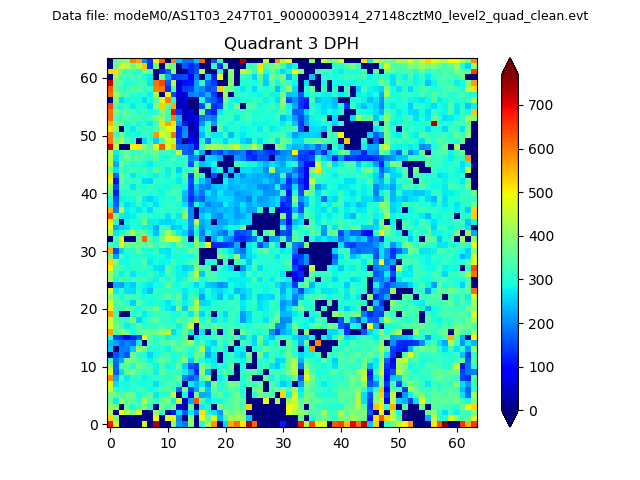 |
 |
Quadrant C |
| Plot type | Count rate plots | Images |
|---|---|---|
| Comparison with Poisson distribution Blue bars denote a histogram of data divided into 1 sec bins. Red curve is a Poisson curve with rate = median count rate of data. |
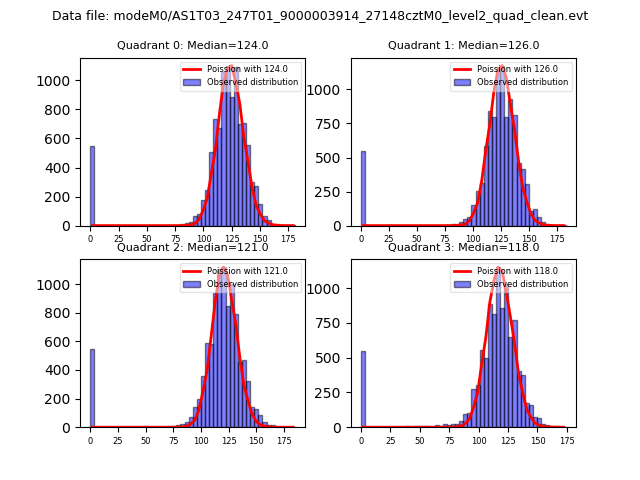 |
 |
| Quadrant-wise count rates Data is divided into 100 sec bins |
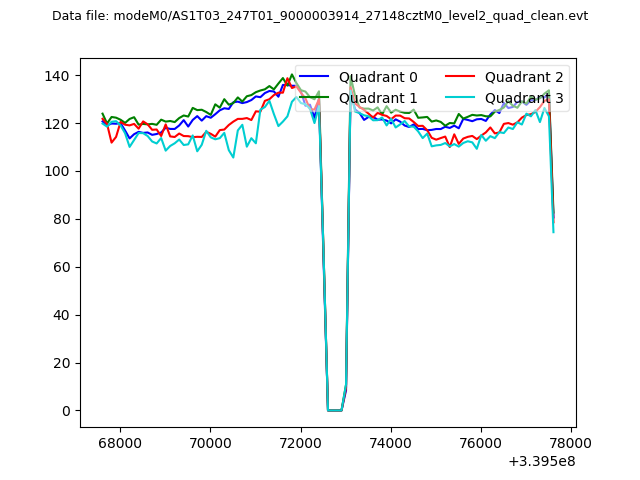 |
|
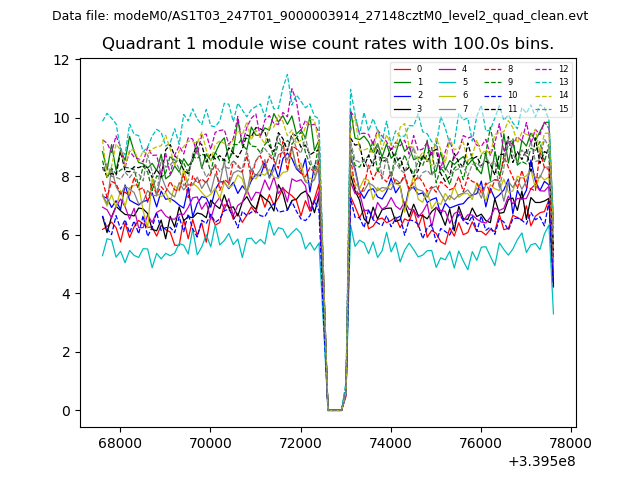
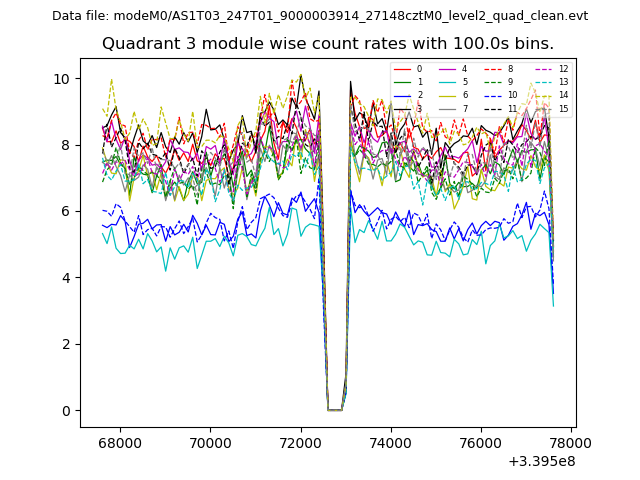
| Module-wise count rates for Quadrant A Data is divided into 100 sec bins |
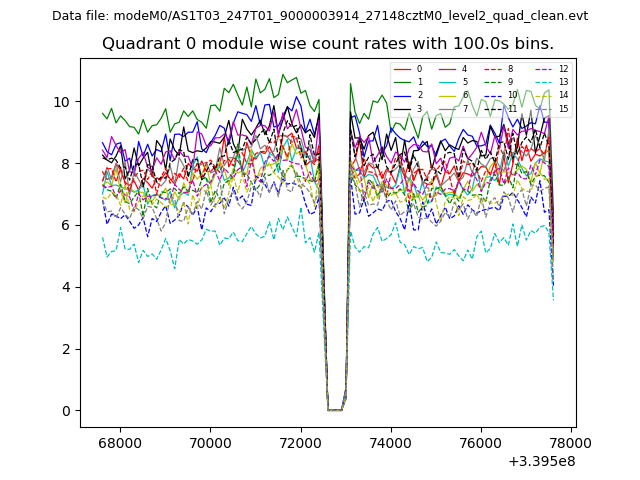 |
 |
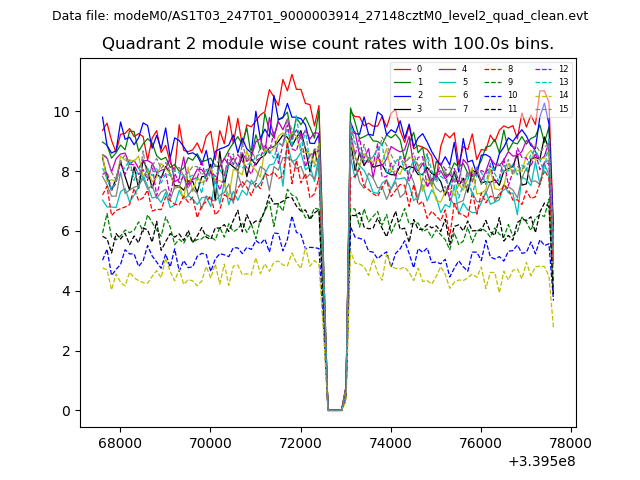
| Module-wise count rates for Quadrant B Data is divided into 100 sec bins |
 |
 |
| Module-wise count rates for Quadrant C Data is divided into 100 sec bins |
 |
 |
| Module-wise count rates for Quadrant D Data is divided into 100 sec bins |
 |
 |
| Parameter | Plot |
|---|---|
| CZT HV Monitor | 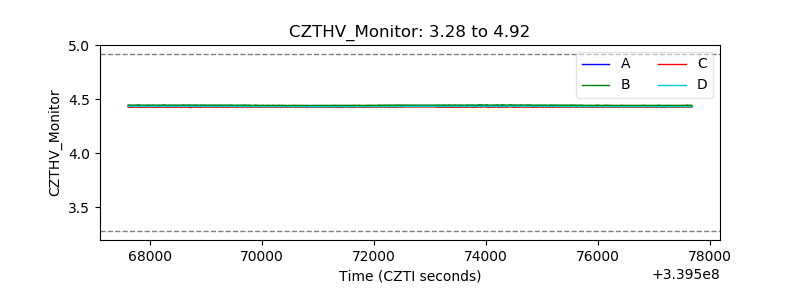 |
| D_VDD | 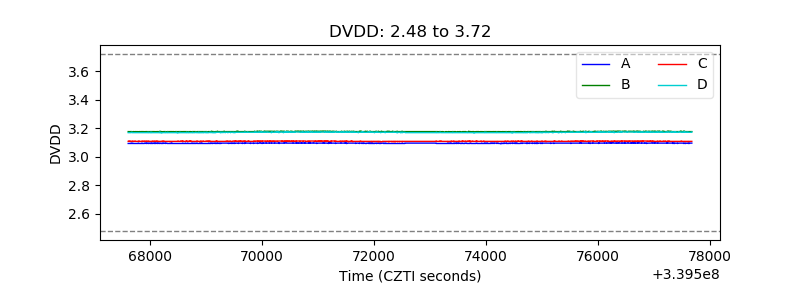 |
| Temperature 1 | 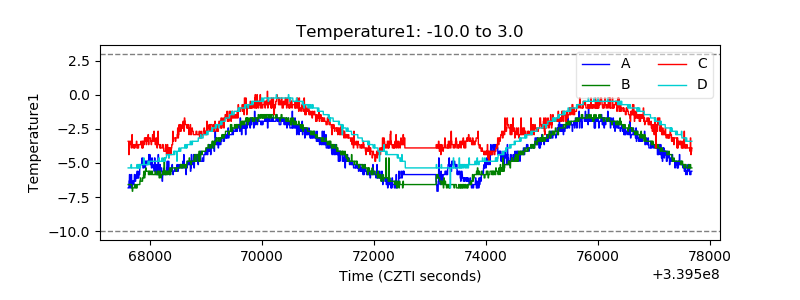 |
| Veto HV Monitor | 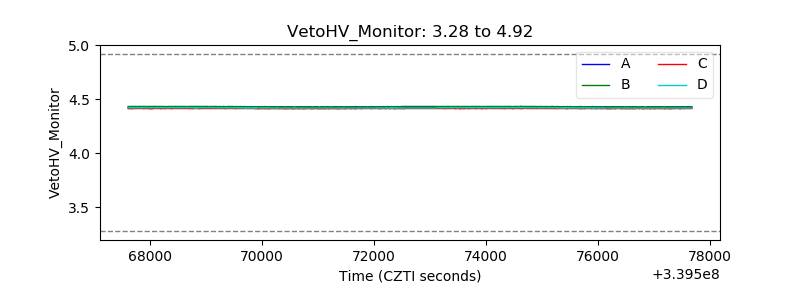 |
| Veto LLD | 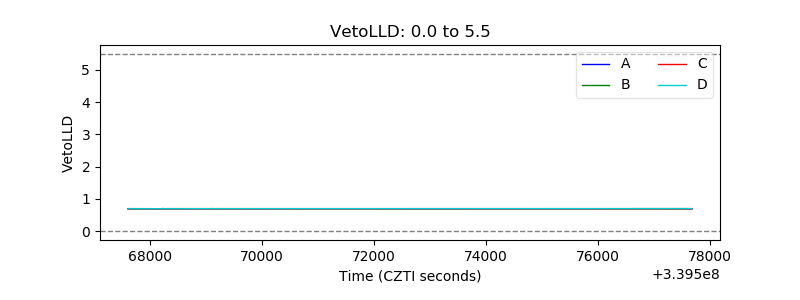 |
| Alpha Counter | 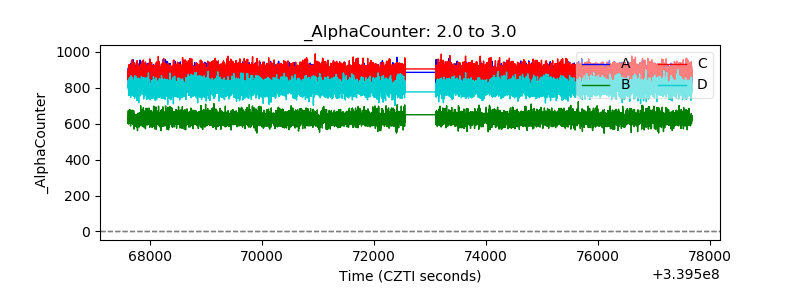 |
| _CPM_Rate | 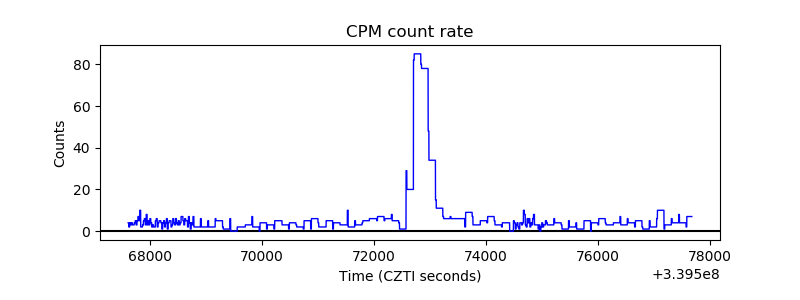 |
| CZT Counter | 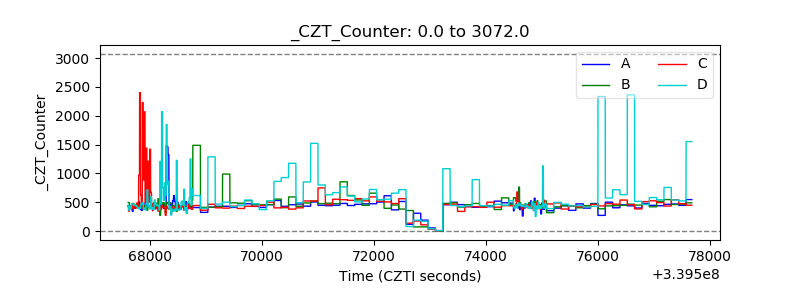 |
| +2.5 Volts monitor |  |
| +5 Volts monitor |  |
| _ROLL_ROT | 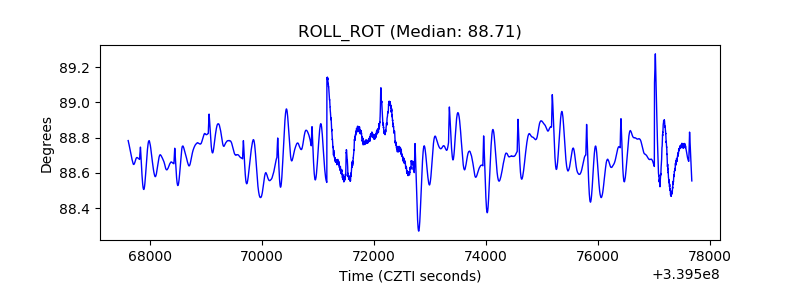 |
| _Roll_DEC | 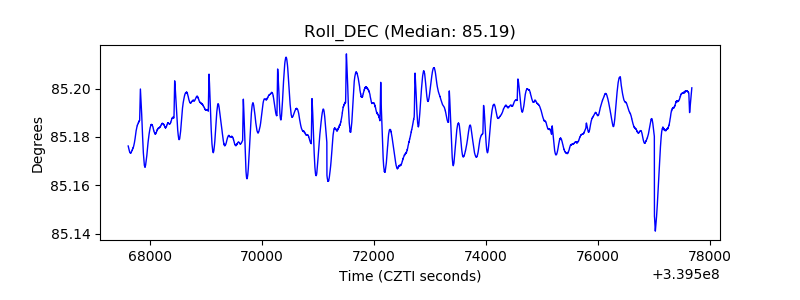 |
| _Roll_RA | 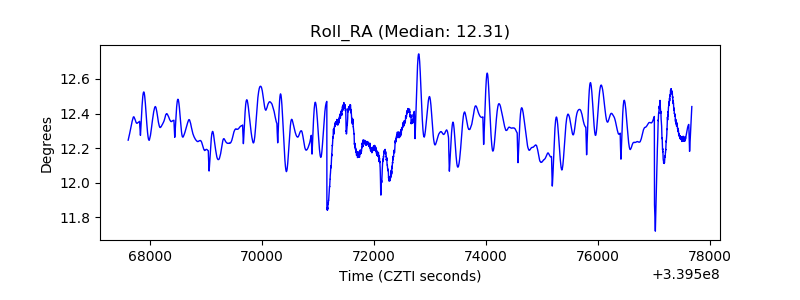 |
| Veto Counter | 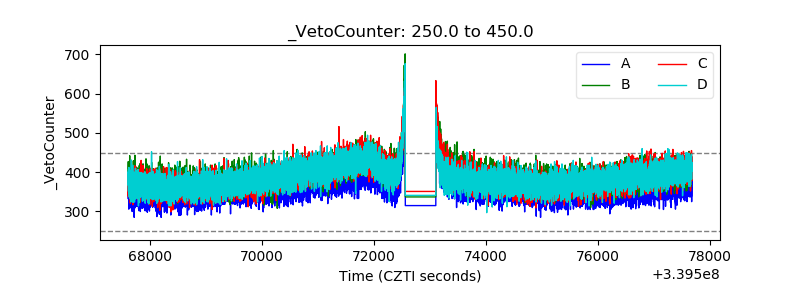 |