| Param | Original file | Final file |
|---|---|---|
| Filename | modeM0/AS1T03_247T01_9000003914_27149cztM0_level2.evt | modeM0/AS1T03_247T01_9000003914_27149cztM0_level2_quad_clean.evt |
| Size (bytes) | 47,309,760 | 12,231,360 |
| Size | 45.1 MB | 11.7 MB |
| Events in quadrant A | 298,005 | 81,156 |
| Events in quadrant B | 310,199 | 81,930 |
| Events in quadrant C | 305,812 | 78,927 |
| Events in quadrant D | 472,897 | 76,557 |
| Mode M0 | |||
|---|---|---|---|
| Quadrant | BADHDUFLAG | Total packets | Discarded packets |
| A | 0 | 1280 | 0 |
| B | 0 | 1284 | 0 |
| C | 0 | 1265 | 0 |
| D | 0 | 1812 | 0 |
| Quadrant | Total seconds | Saturated seconds | Saturation percentage |
|---|---|---|---|
| A | 624 | 1 | 0.160256% |
| B | 625 | 2 | 0.320000% |
| C | 625 | 8 | 1.280000% |
| D | 625 | 25 | 4.000000% |
Noise dominated data is calculated using 1-second bins in cleaned event files. If a bin has >2000 counts, and if more than 50% of those come from <1% of pixels, then it is considered to be noise-dominated and hence unusable.
| Quadrant | # 1 sec bins | Bins with >0 counts | Bins with >2000 counts | High rate bins dominated by noise | Noise dominated (total time) | Noise dominated (detector-on time) | Marked lightcurve |
|---|---|---|---|---|---|---|---|
| A | 624 | 624 | 0 | 0 | 0.00% | 0.00% | 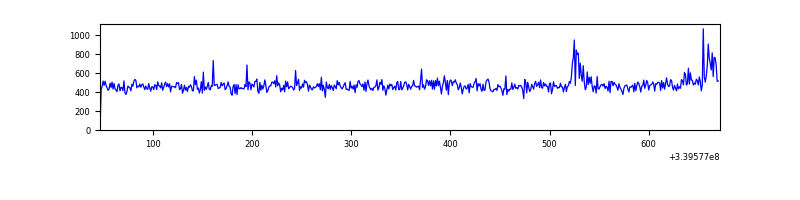 |
| B | 625 | 625 | 0 | 0 | 0.00% | 0.00% |  |
| C | 625 | 625 | 0 | 0 | 0.00% | 0.00% | 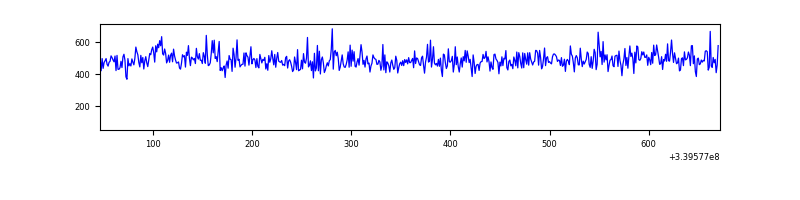 |
| D | 625 | 625 | 16 | 16 | 2.56% | 2.56% | 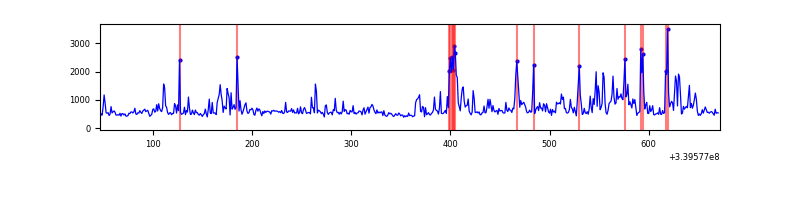 |
Top three noisy pixels from each quadrant. If the there are fewer than three noisy pixels in the level2.evt file, extra rows are filled as -1
| Pixel properties | Quadrant properties | ||||||
|---|---|---|---|---|---|---|---|
| Quadrant | DetID | PixID | Counts | Sigma | Mean | Median | Sigma |
| A | 0 | 13 | 8304 | 489.85 | 73 | 72 | 16.8 |
| A | 7 | 192 | 3422 | 199.35 | 73 | 72 | 16.8 |
| A | 13 | 254 | 1099 | 61.11 | 73 | 72 | 16.8 |
| B | 3 | 112 | 16703 | 989.95 | 74 | 72 | 16.8 |
| B | 12 | 111 | 1634 | 92.98 | 74 | 72 | 16.8 |
| B | 11 | 111 | 1477 | 83.63 | 74 | 72 | 16.8 |
| C | 14 | 238 | 12008 | 611.12 | 74 | 74 | 19.5 |
| C | 2 | 16 | 3066 | 153.22 | 74 | 74 | 19.5 |
| C | 15 | 208 | 814 | 37.89 | 74 | 74 | 19.5 |
| D | 1 | 52 | 103850 | 5272.72 | 73 | 70 | 19.7 |
| D | 7 | 38 | 60993 | 3095.3 | 73 | 70 | 19.7 |
| D | 12 | 233 | 13828 | 699.0 | 73 | 70 | 19.7 |
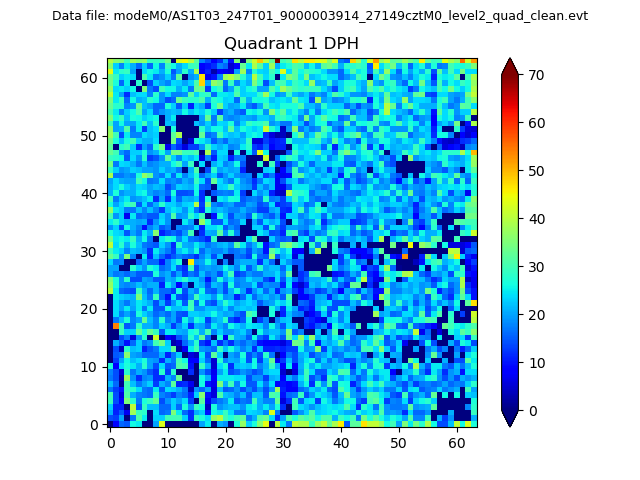
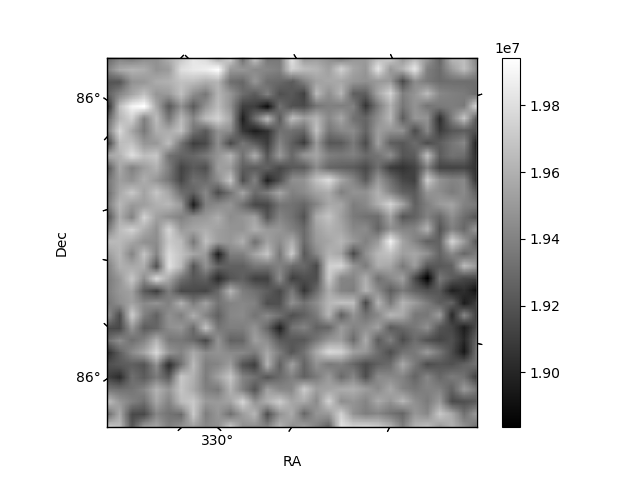
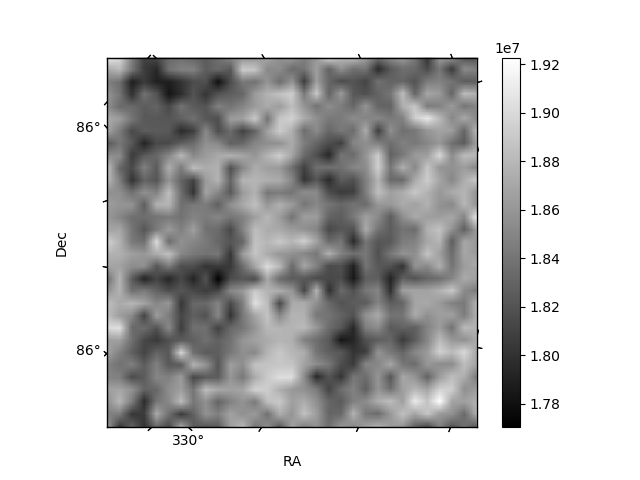
Histogram calculated using DETX and DETY for each event in the final _common_clean file
| Quadrant A | 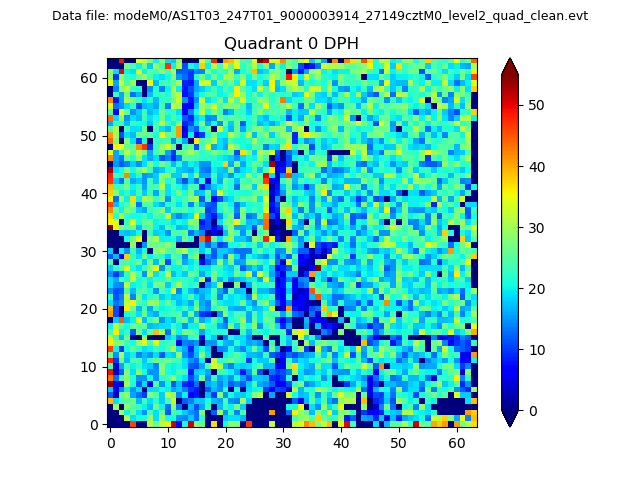 |
 |
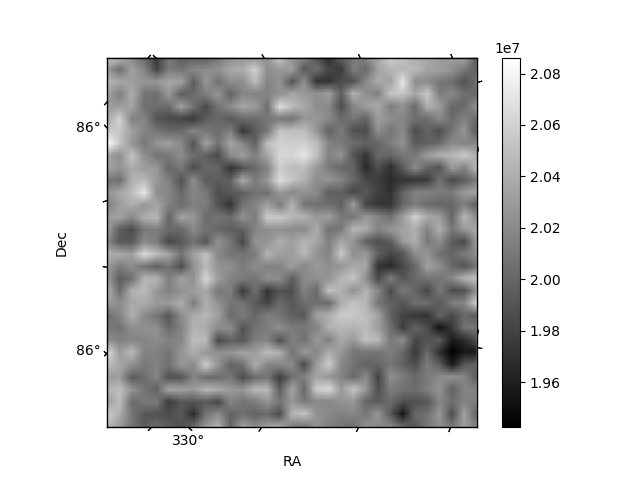
Quadrant B |
|---|---|---|---|
| Quadrant D | 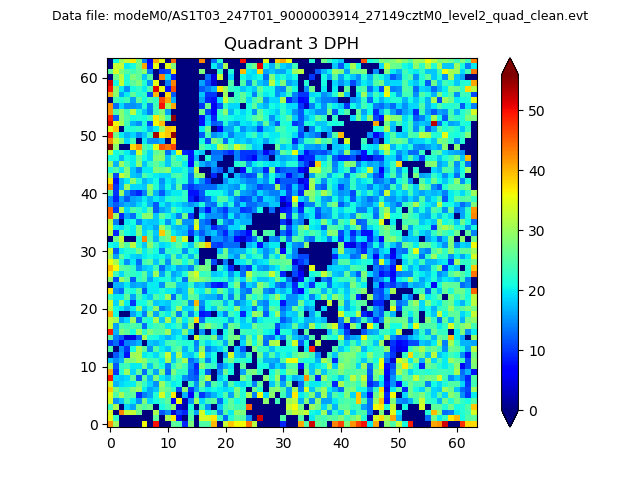 |
 |
Quadrant C |
| Plot type | Count rate plots | Images |
|---|---|---|
| Comparison with Poisson distribution Blue bars denote a histogram of data divided into 1 sec bins. Red curve is a Poisson curve with rate = median count rate of data. |
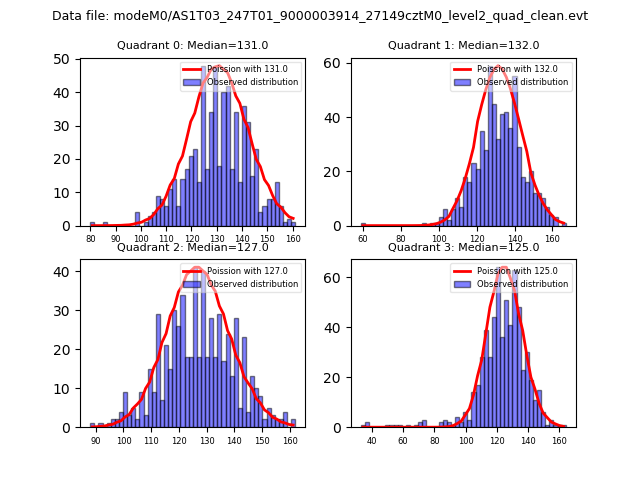 |
 |
| Quadrant-wise count rates Data is divided into 100 sec bins |
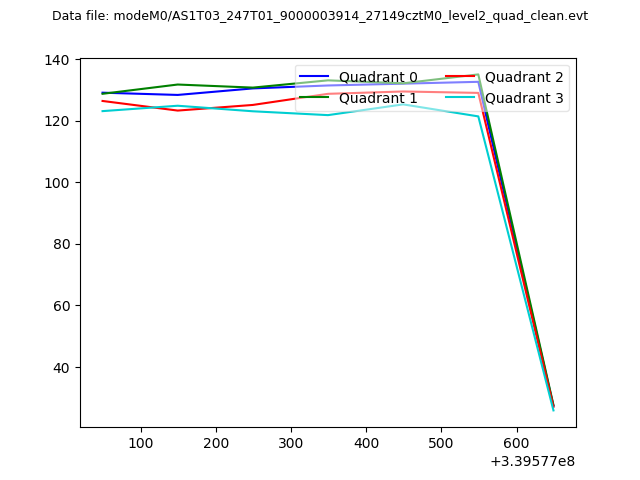 |
|
| Module-wise count rates for Quadrant A Data is divided into 100 sec bins |
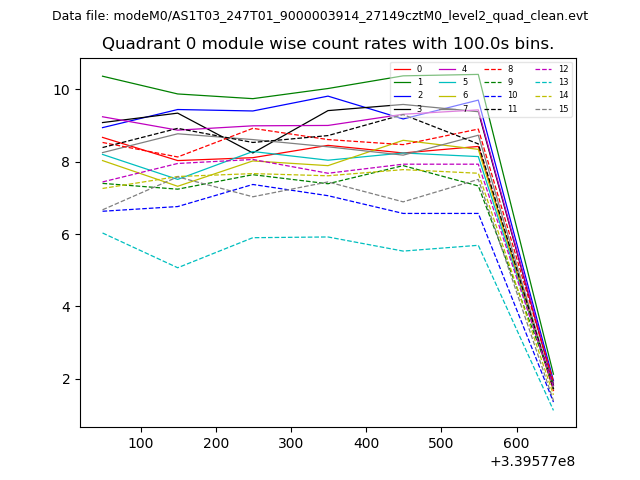 |
 |
| Module-wise count rates for Quadrant B Data is divided into 100 sec bins |
 |
 |
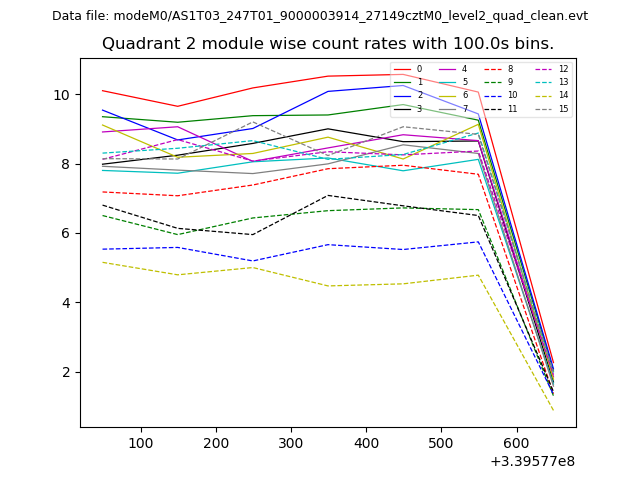
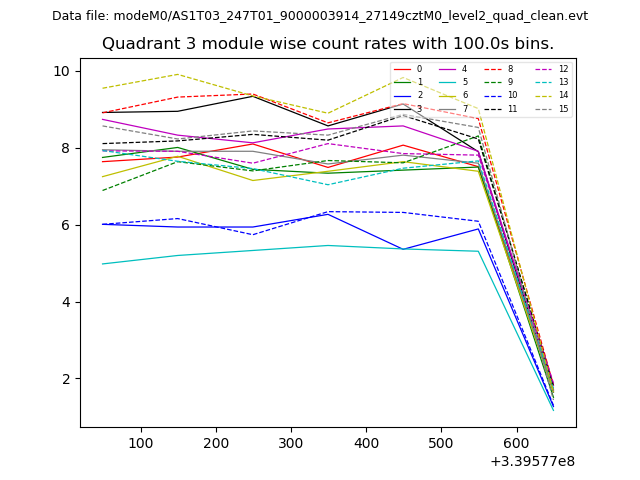
| Module-wise count rates for Quadrant C Data is divided into 100 sec bins |
 |
 |
| Module-wise count rates for Quadrant D Data is divided into 100 sec bins |
 |
 |
| Parameter | Plot |
|---|---|
| CZT HV Monitor | 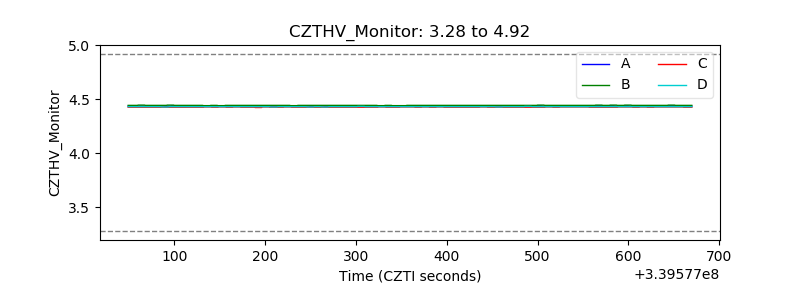 |
| D_VDD | 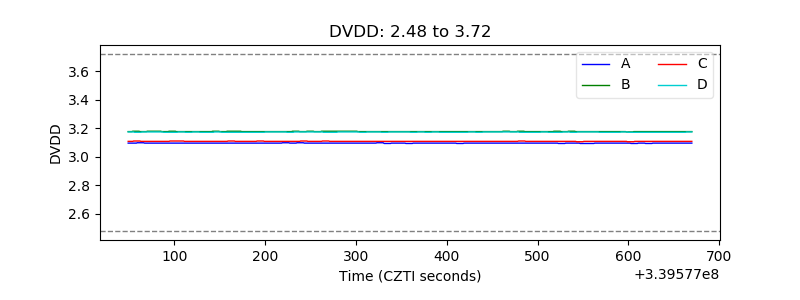 |
| Temperature 1 | 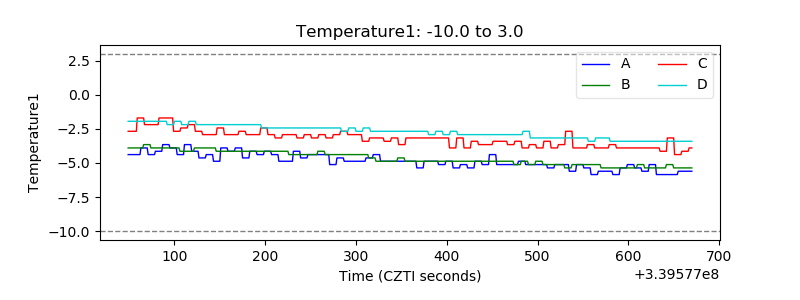 |
| Veto HV Monitor | 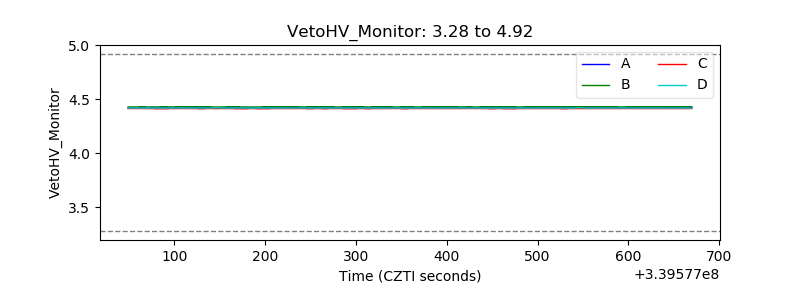 |
| Veto LLD | 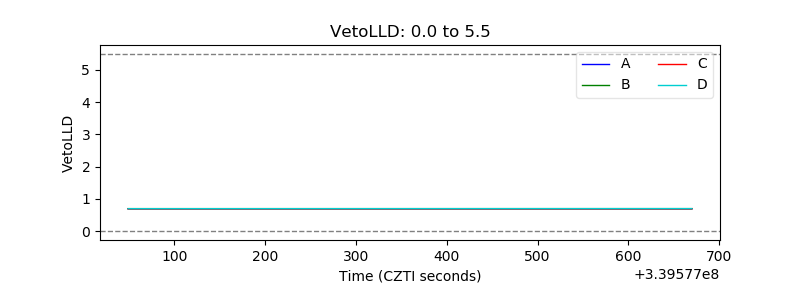 |
| Alpha Counter | 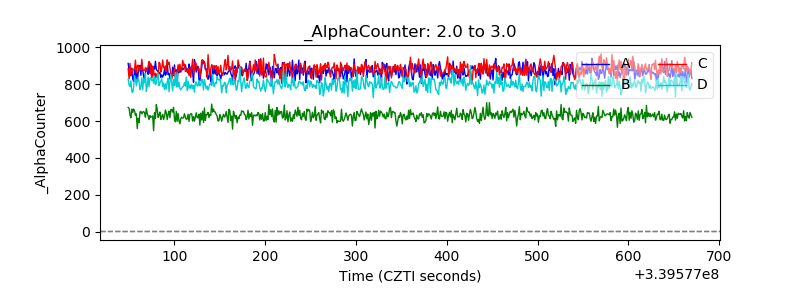 |
| _CPM_Rate | 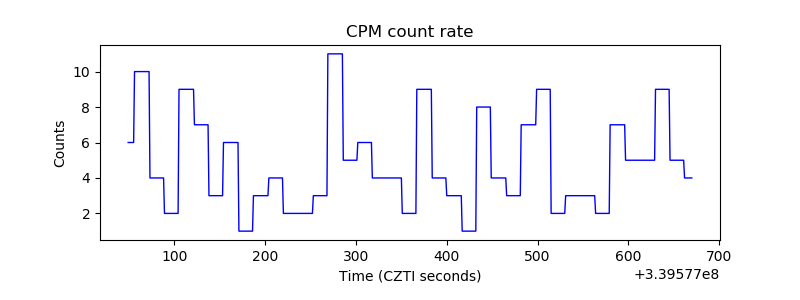 |
| CZT Counter |  |
| +2.5 Volts monitor |  |
| +5 Volts monitor | 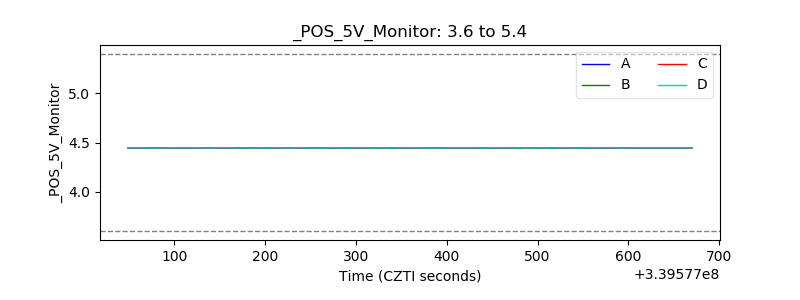 |
| _ROLL_ROT | 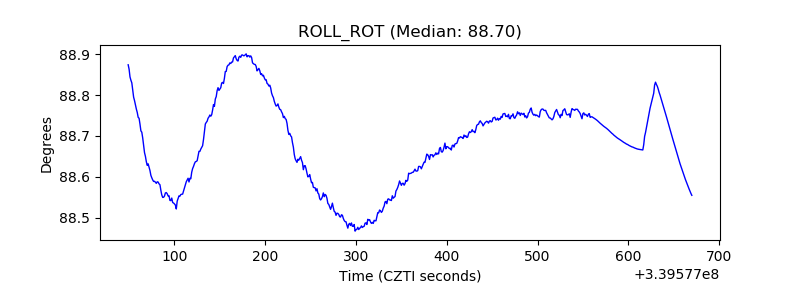 |
| _Roll_DEC | 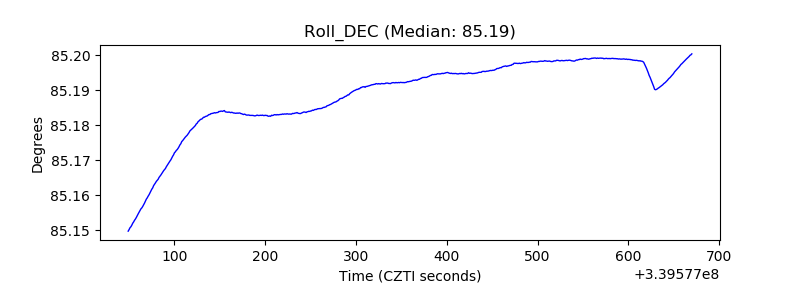 |
| _Roll_RA | 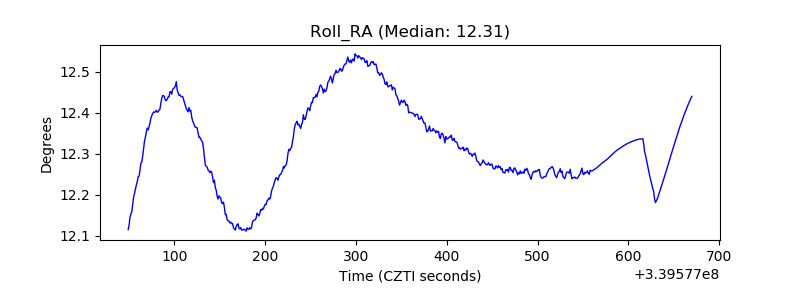 |
| Veto Counter | 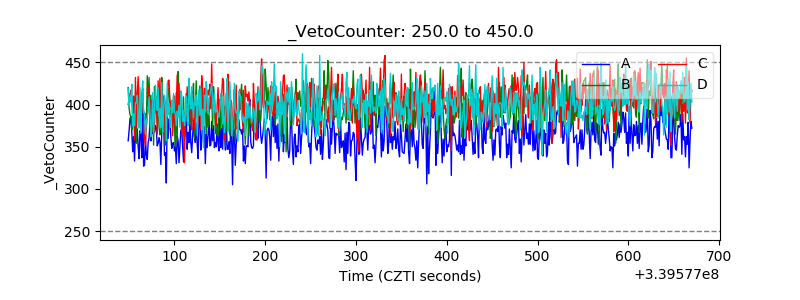 |