| Param | Original file | Final file |
|---|---|---|
| Filename | modeM0/AS1T03_243T01_9000003918_27174cztM0_level2.evt | modeM0/AS1T03_243T01_9000003918_27174cztM0_level2_quad_clean.evt |
| Size (bytes) | 261,069,120 | 28,909,440 |
| Size | 249.0 MB | 27.6 MB |
| Events in quadrant A | 3,283,406 | 133,716 |
| Events in quadrant B | 1,339,904 | 194,241 |
| Events in quadrant C | 1,308,005 | 185,171 |
| Events in quadrant D | 1,799,903 | 177,961 |
| Mode M9 | |||
|---|---|---|---|
| Quadrant | BADHDUFLAG | Total packets | Discarded packets |
| A | 0 | 2 | 0 |
| B | 0 | 2 | 0 |
| C | 0 | 2 | 0 |
| D | 0 | 2 | 0 |
| Mode M0 | |||
|---|---|---|---|
| Quadrant | BADHDUFLAG | Total packets | Discarded packets |
| A | 0 | 11508 | 0 |
| B | 0 | 5621 | 0 |
| C | 0 | 5569 | 0 |
| D | 0 | 7172 | 0 |
| Quadrant | Total seconds | Saturated seconds | Saturation percentage |
|---|---|---|---|
| A | 2559 | 878 | 34.310277% |
| B | 2559 | 141 | 5.509965% |
| C | 2559 | 138 | 5.392732% |
| D | 2559 | 144 | 5.627198% |
Noise dominated data is calculated using 1-second bins in cleaned event files. If a bin has >2000 counts, and if more than 50% of those come from <1% of pixels, then it is considered to be noise-dominated and hence unusable.
| Quadrant | # 1 sec bins | Bins with >0 counts | Bins with >2000 counts | High rate bins dominated by noise | Noise dominated (total time) | Noise dominated (detector-on time) | Marked lightcurve |
|---|---|---|---|---|---|---|---|
| A | 2714 | 2561 | 674 | 674 | 24.83% | 26.32% | 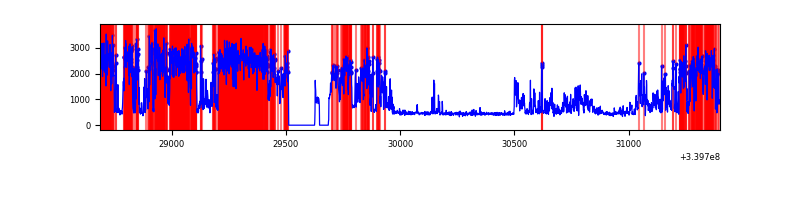 |
| B | 2714 | 2561 | 0 | 0 | 0.00% | 0.00% | 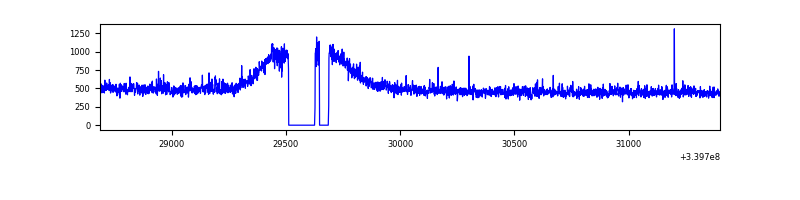 |
| C | 2714 | 2561 | 0 | 0 | 0.00% | 0.00% | 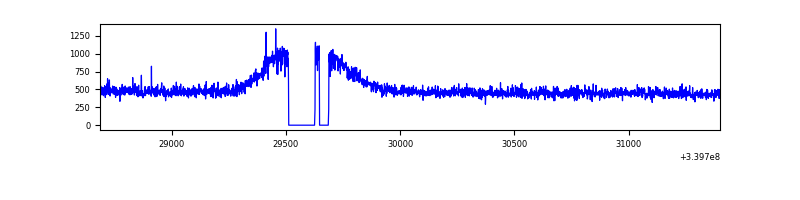 |
| D | 2714 | 2561 | 71 | 71 | 2.62% | 2.77% | 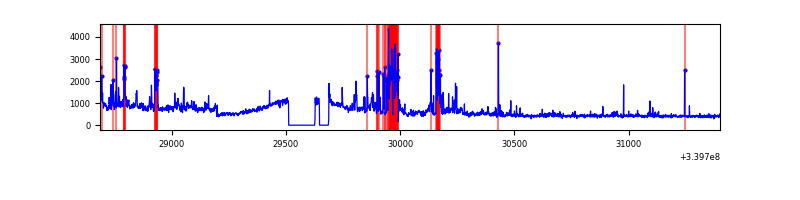 |
Top three noisy pixels from each quadrant. If the there are fewer than three noisy pixels in the level2.evt file, extra rows are filled as -1
| Pixel properties | Quadrant properties | ||||||
|---|---|---|---|---|---|---|---|
| Quadrant | DetID | PixID | Counts | Sigma | Mean | Median | Sigma |
| A | 6 | 16 | 2204599 | 37918.0 | 276 | 270 | 58.1 |
| A | 13 | 248 | 5104 | 83.15 | 276 | 270 | 58.1 |
| A | 13 | 254 | 4125 | 66.31 | 276 | 270 | 58.1 |
| B | 12 | 111 | 8381 | 118.59 | 336 | 327 | 67.9 |
| B | 0 | 189 | 8354 | 118.19 | 336 | 327 | 67.9 |
| B | 11 | 111 | 7056 | 99.08 | 336 | 327 | 67.9 |
| C | 14 | 238 | 49249 | 610.1 | 323 | 326 | 80.2 |
| C | 13 | 61 | 2201 | 23.38 | 323 | 326 | 80.2 |
| C | 15 | 208 | 1240 | 11.4 | 323 | 326 | 80.2 |
| D | 1 | 52 | 258116 | 3151.3 | 319 | 310 | 81.8 |
| D | 2 | 250 | 248360 | 3032.05 | 319 | 310 | 81.8 |
| D | 7 | 38 | 38542 | 467.33 | 319 | 310 | 81.8 |
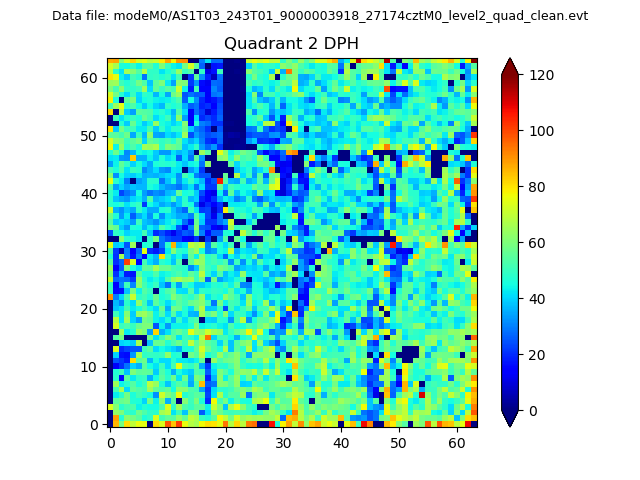
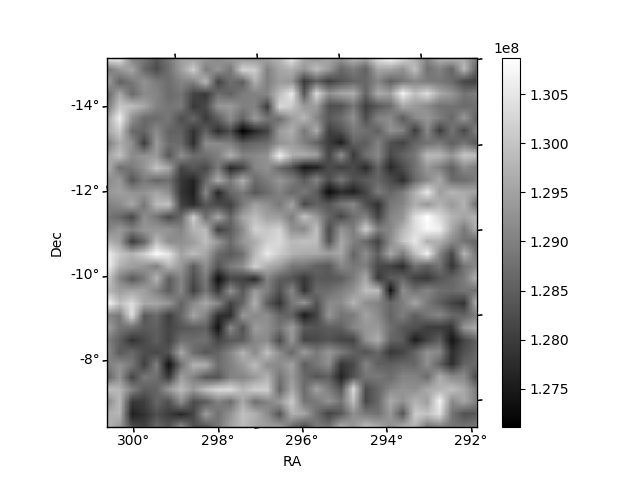
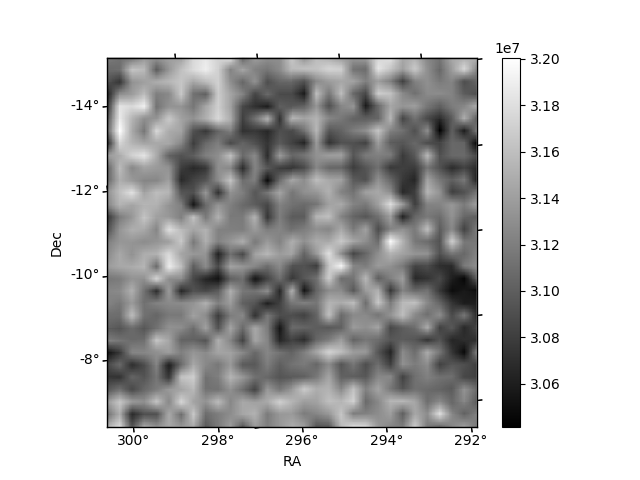
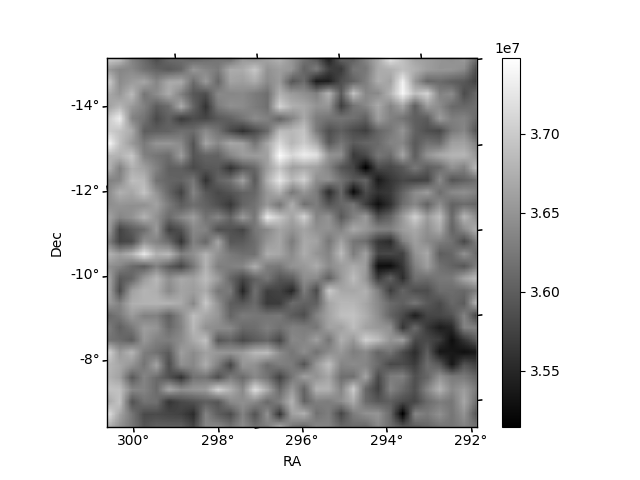
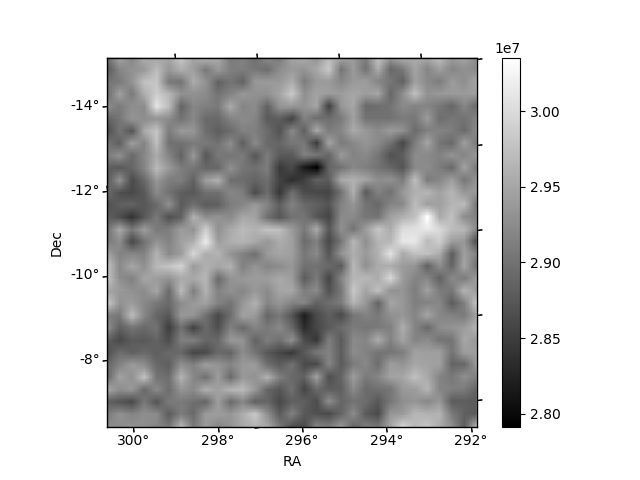
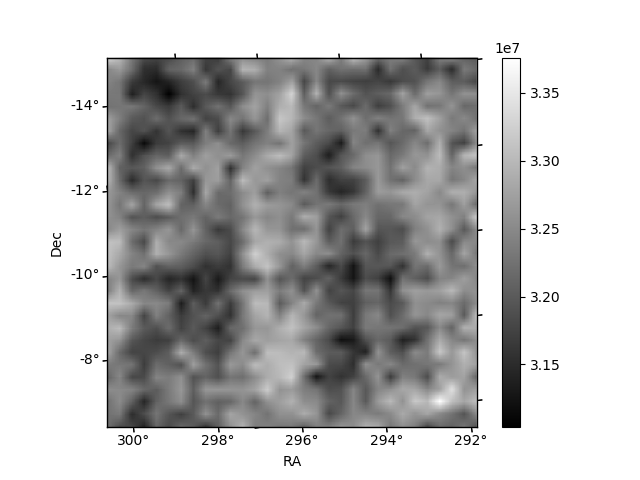
Histogram calculated using DETX and DETY for each event in the final _common_clean file
| Quadrant A | 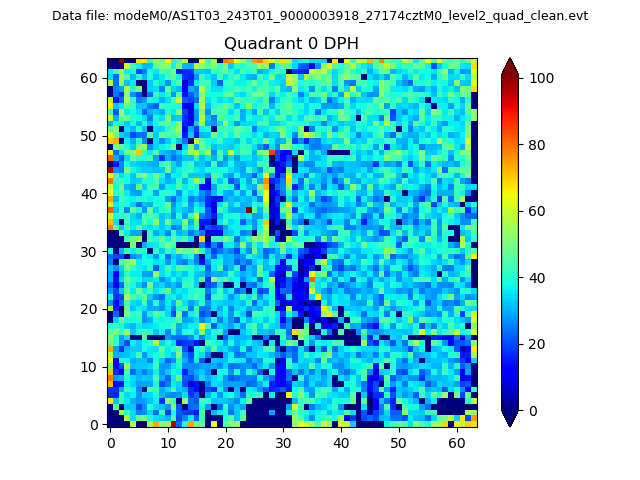 |
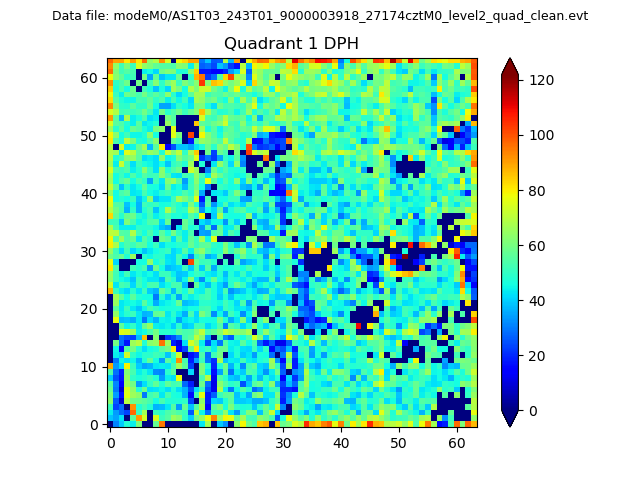 |
Quadrant B |
|---|---|---|---|
| Quadrant D | 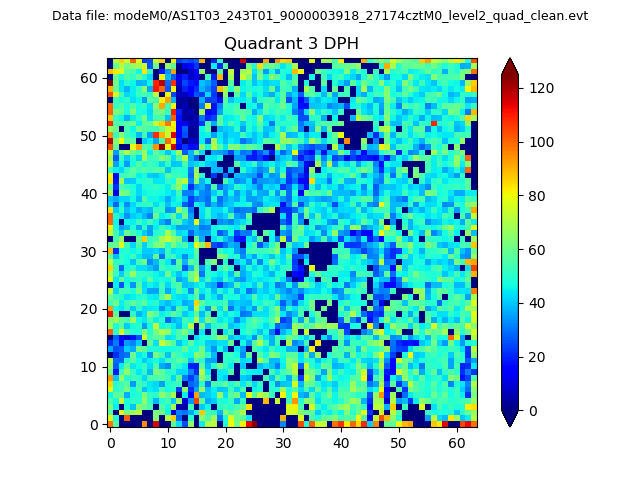 |
 |
Quadrant C |
| Plot type | Count rate plots | Images |
|---|---|---|
| Comparison with Poisson distribution Blue bars denote a histogram of data divided into 1 sec bins. Red curve is a Poisson curve with rate = median count rate of data. |
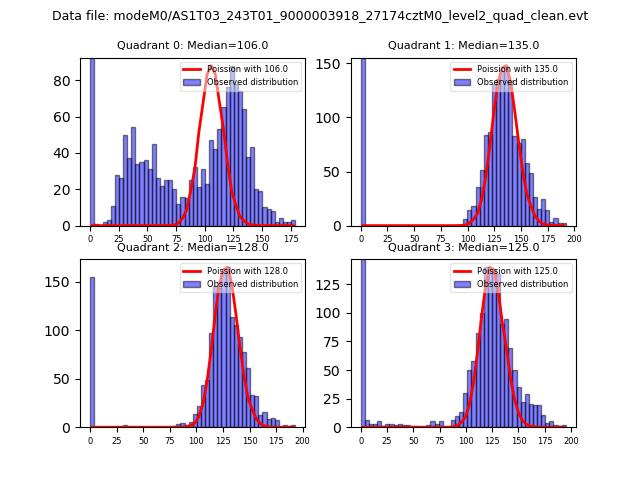 |
 |
| Quadrant-wise count rates Data is divided into 100 sec bins |
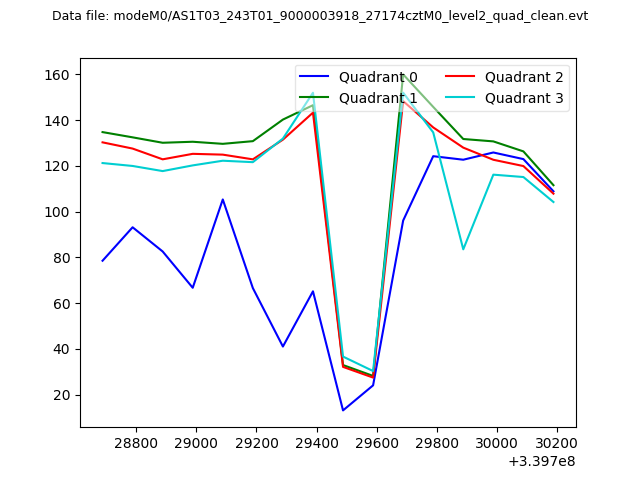 |
|
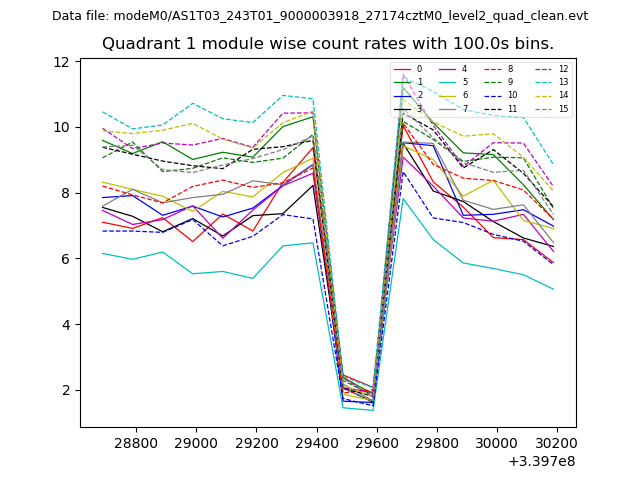
| Module-wise count rates for Quadrant A Data is divided into 100 sec bins |
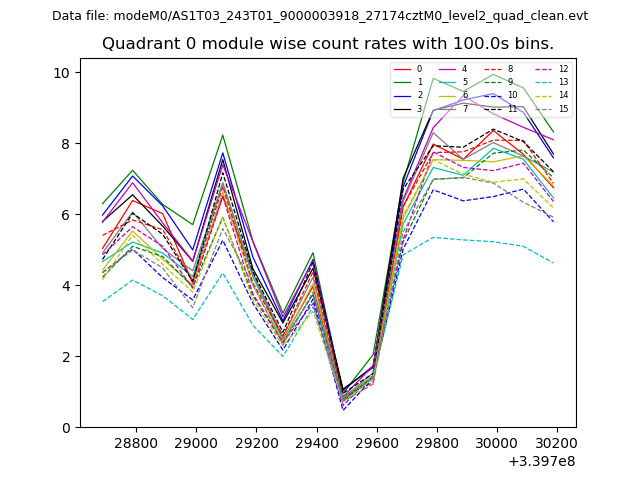 |
 |
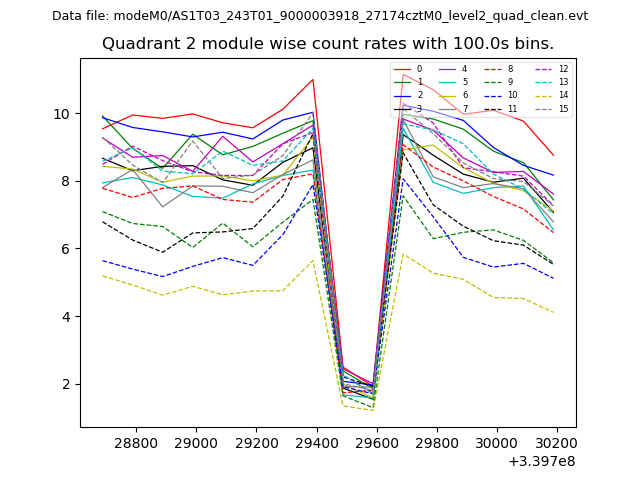
| Module-wise count rates for Quadrant B Data is divided into 100 sec bins |
 |
 |
| Module-wise count rates for Quadrant C Data is divided into 100 sec bins |
 |
 |
| Module-wise count rates for Quadrant D Data is divided into 100 sec bins |
 |
 |
| Parameter | Plot |
|---|---|
| CZT HV Monitor | 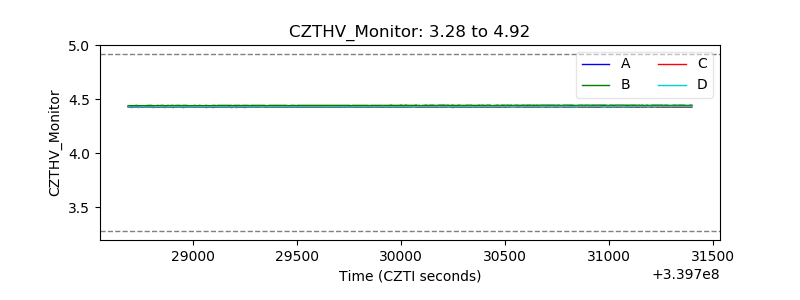 |
| D_VDD | 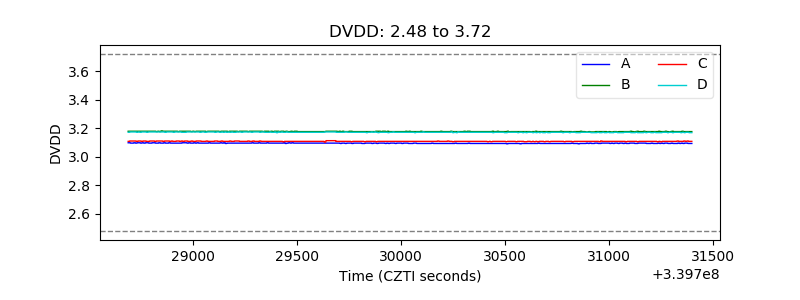 |
| Temperature 1 | 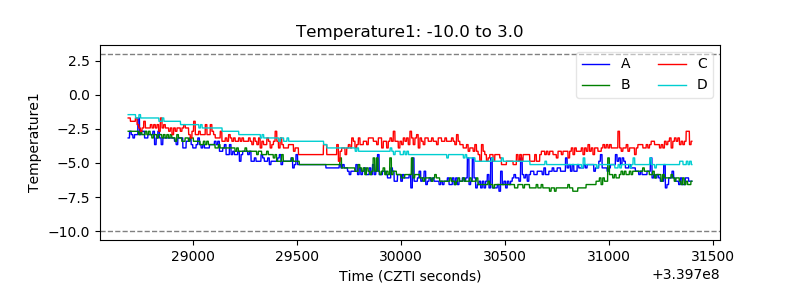 |
| Veto HV Monitor | 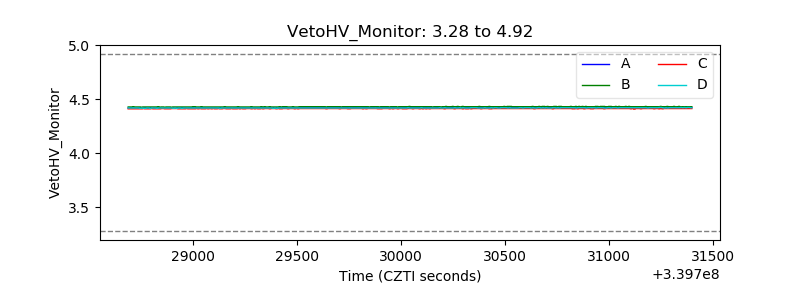 |
| Veto LLD | 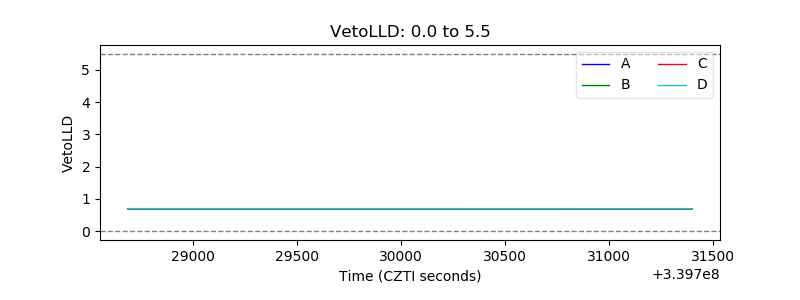 |
| Alpha Counter | 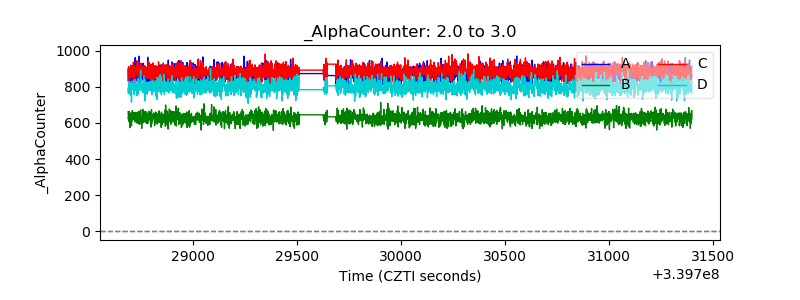 |
| _CPM_Rate | 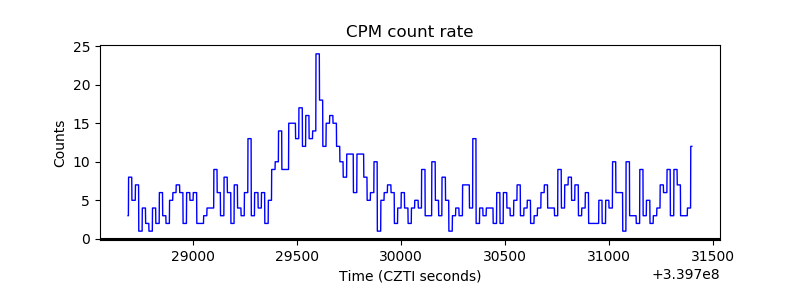 |
| CZT Counter | 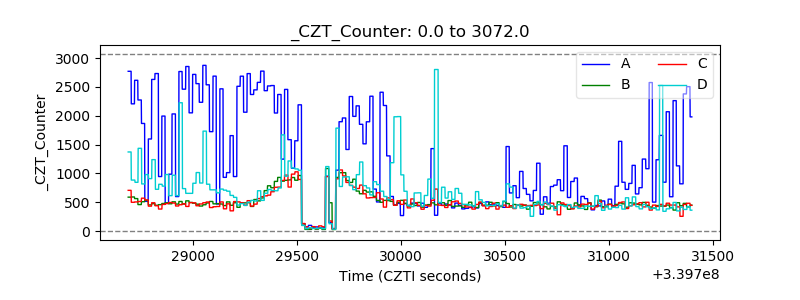 |
| +2.5 Volts monitor |  |
| +5 Volts monitor |  |
| _ROLL_ROT |  |
| _Roll_DEC | 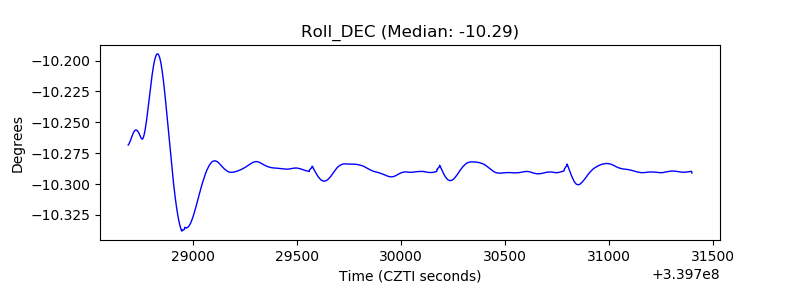 |
| _Roll_RA | 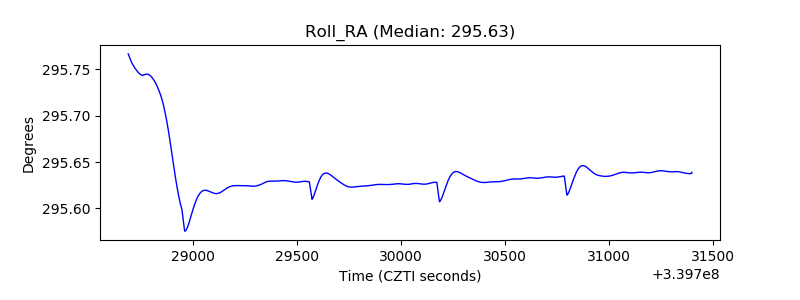 |
| Veto Counter | 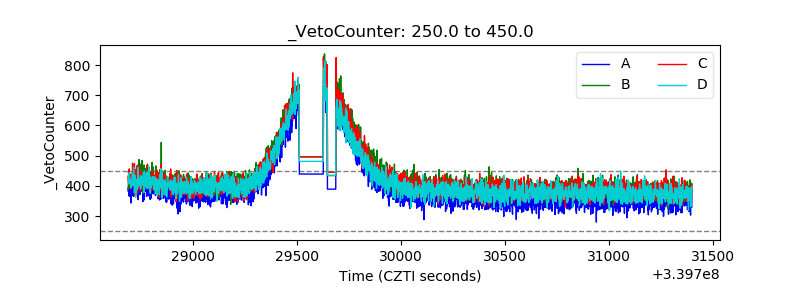 |