| Param | Original file | Final file |
|---|---|---|
| Filename | modeM0/AS1T03_243T01_9000003918_27177cztM0_level2.evt | modeM0/AS1T03_243T01_9000003918_27177cztM0_level2_quad_clean.evt |
| Size (bytes) | 1,039,835,520 | 144,576,000 |
| Size | 991.7 MB | 137.9 MB |
| Events in quadrant A | 6,554,155 | 917,436 |
| Events in quadrant B | 6,090,851 | 936,649 |
| Events in quadrant C | 5,918,967 | 892,843 |
| Events in quadrant D | 12,087,985 | 772,016 |
| Mode M9 | |||
|---|---|---|---|
| Quadrant | BADHDUFLAG | Total packets | Discarded packets |
| A | 0 | 11 | 0 |
| B | 0 | 11 | 0 |
| C | 0 | 11 | 0 |
| D | 0 | 11 | 0 |
| Mode M0 | |||
|---|---|---|---|
| Quadrant | BADHDUFLAG | Total packets | Discarded packets |
| A | 0 | 27235 | 0 |
| B | 0 | 25620 | 0 |
| C | 0 | 25337 | 0 |
| D | 0 | 44263 | 0 |
| Quadrant | Total seconds | Saturated seconds | Saturation percentage |
|---|---|---|---|
| A | 12416 | 211 | 1.699420% |
| B | 12416 | 176 | 1.417526% |
| C | 12416 | 201 | 1.618879% |
| D | 12416 | 1897 | 15.278673% |
Noise dominated data is calculated using 1-second bins in cleaned event files. If a bin has >2000 counts, and if more than 50% of those come from <1% of pixels, then it is considered to be noise-dominated and hence unusable.
| Quadrant | # 1 sec bins | Bins with >0 counts | Bins with >2000 counts | High rate bins dominated by noise | Noise dominated (total time) | Noise dominated (detector-on time) | Marked lightcurve |
|---|---|---|---|---|---|---|---|
| A | 13626 | 12418 | 48 | 48 | 0.35% | 0.39% |  |
| B | 13626 | 12417 | 9 | 9 | 0.07% | 0.07% |  |
| C | 13626 | 12417 | 0 | 0 | 0.00% | 0.00% |  |
| D | 13626 | 12417 | 1551 | 1551 | 11.38% | 12.49% | 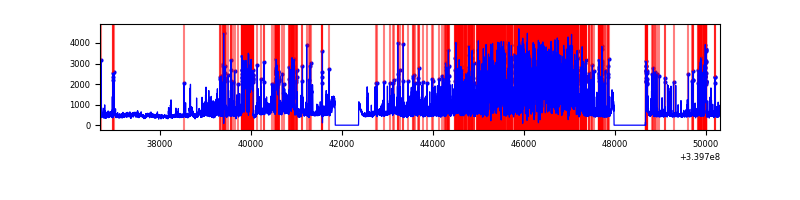 |
Top three noisy pixels from each quadrant. If the there are fewer than three noisy pixels in the level2.evt file, extra rows are filled as -1
| Pixel properties | Quadrant properties | ||||||
|---|---|---|---|---|---|---|---|
| Quadrant | DetID | PixID | Counts | Sigma | Mean | Median | Sigma |
| A | 6 | 16 | 596130 | 1937.89 | 1517 | 1484 | 306.9 |
| A | 0 | 13 | 70825 | 225.98 | 1517 | 1484 | 306.9 |
| A | 13 | 254 | 20026 | 60.43 | 1517 | 1484 | 306.9 |
| B | 0 | 190 | 47546 | 159.22 | 1514 | 1474 | 289.4 |
| B | 12 | 111 | 36311 | 120.39 | 1514 | 1474 | 289.4 |
| B | 11 | 111 | 32500 | 107.22 | 1514 | 1474 | 289.4 |
| C | 14 | 238 | 230387 | 669.78 | 1452 | 1461 | 341.8 |
| C | 8 | 128 | 12806 | 33.19 | 1452 | 1461 | 341.8 |
| C | 13 | 61 | 9850 | 24.54 | 1452 | 1461 | 341.8 |
| D | 12 | 1 | 3610727 | 11106.99 | 1371 | 1340 | 325.0 |
| D | 1 | 52 | 2131094 | 6553.79 | 1371 | 1340 | 325.0 |
| D | 12 | 233 | 759754 | 2333.83 | 1371 | 1340 | 325.0 |
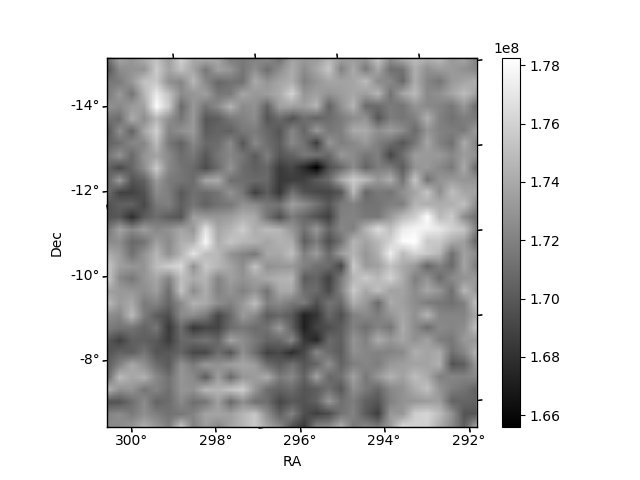
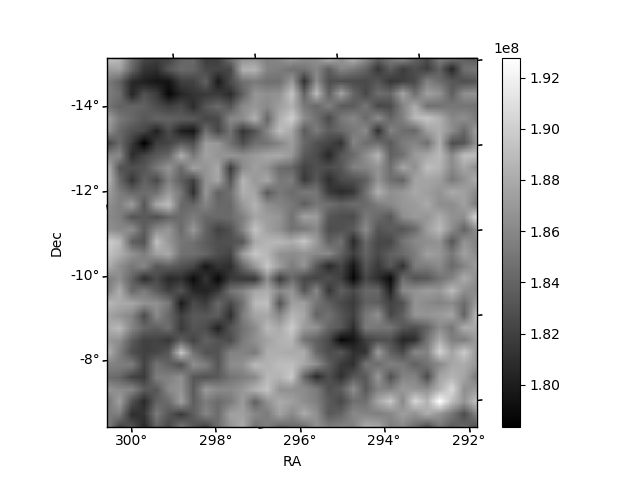
Histogram calculated using DETX and DETY for each event in the final _common_clean file
| Quadrant A | 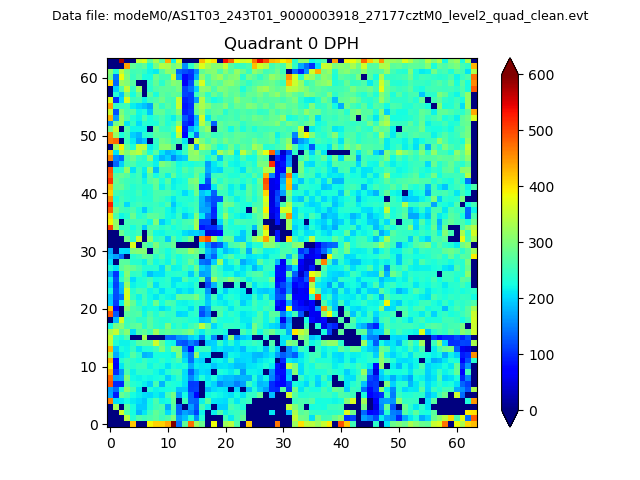 |
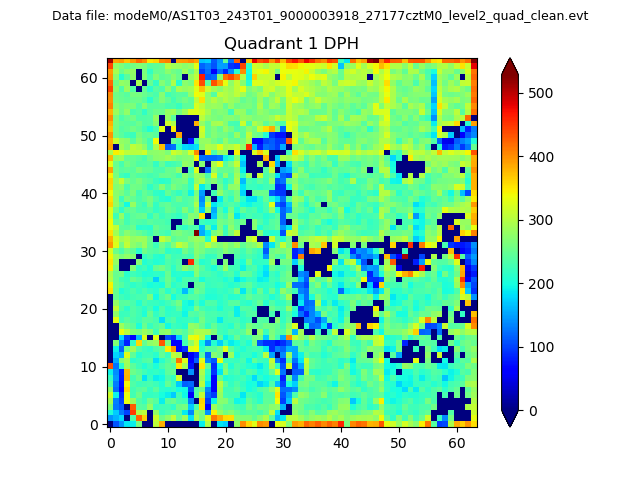 |
Quadrant B |
|---|---|---|---|
| Quadrant D | 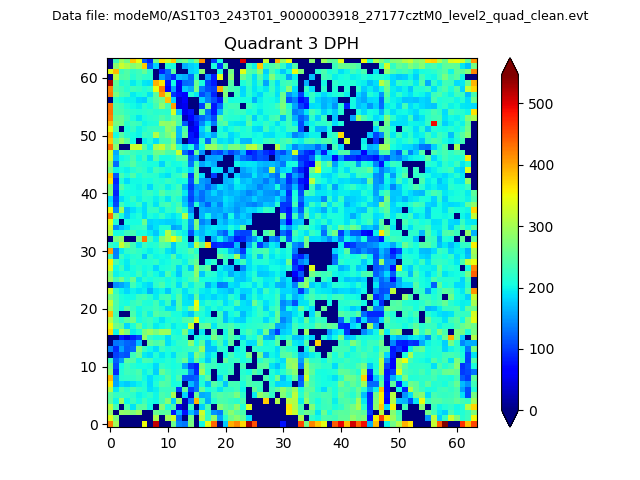 |
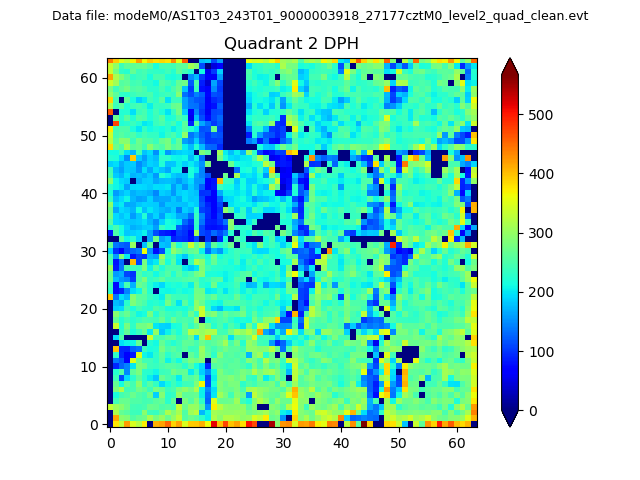 |
Quadrant C |
| Plot type | Count rate plots | Images |
|---|---|---|
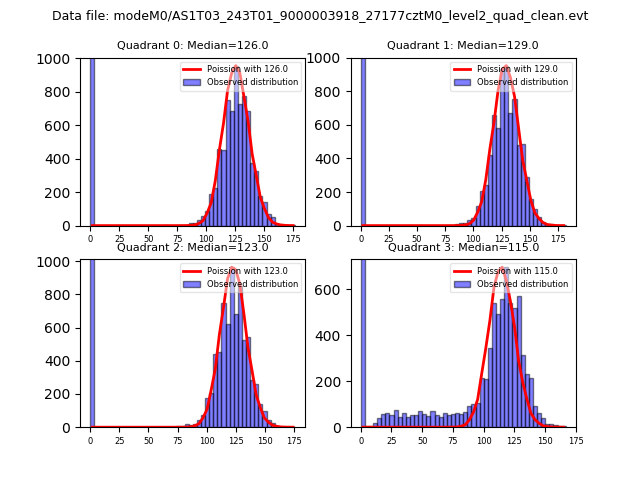
| Comparison with Poisson distribution Blue bars denote a histogram of data divided into 1 sec bins. Red curve is a Poisson curve with rate = median count rate of data. |
 |
 |
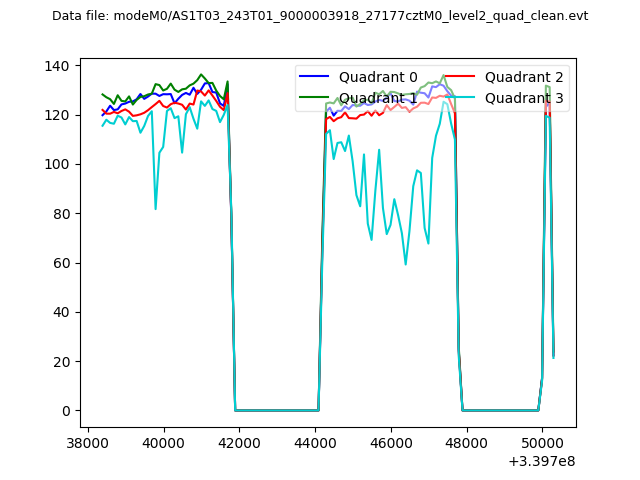
| Quadrant-wise count rates Data is divided into 100 sec bins |
 |
|
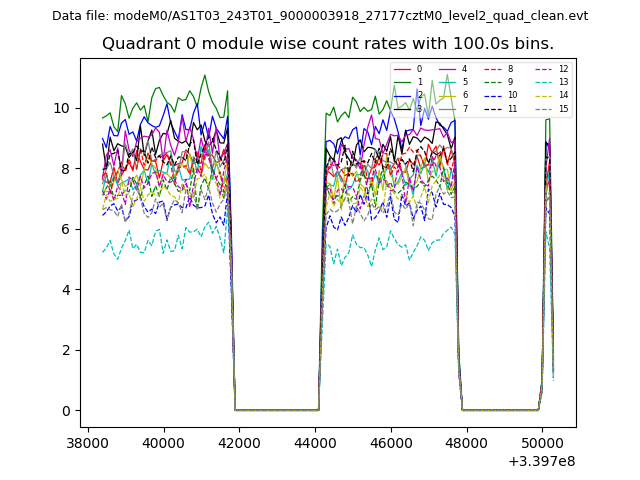
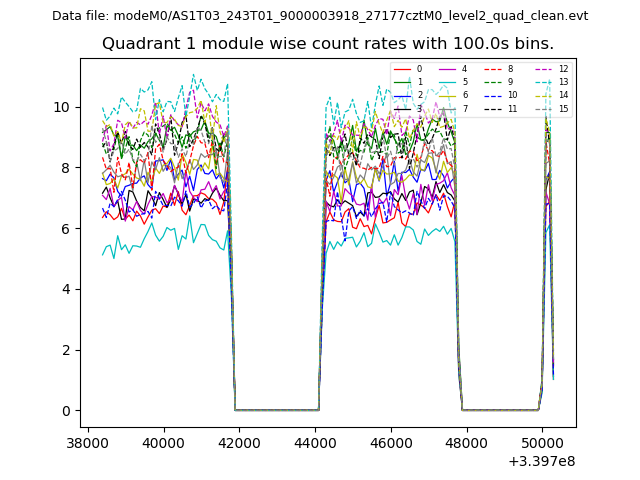
| Module-wise count rates for Quadrant A Data is divided into 100 sec bins |
 |
 |
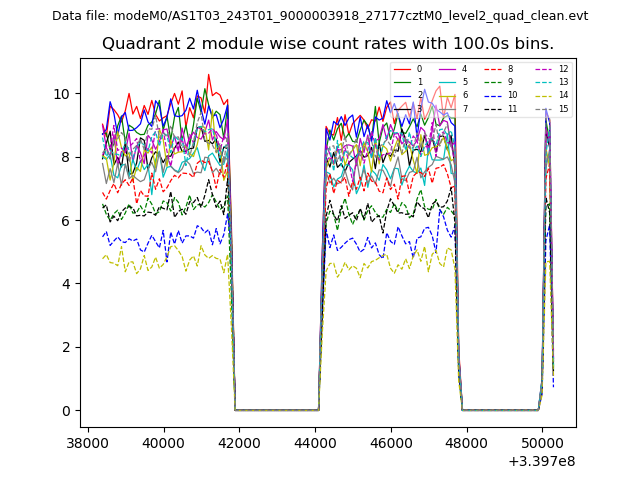
| Module-wise count rates for Quadrant B Data is divided into 100 sec bins |
 |
 |
| Module-wise count rates for Quadrant C Data is divided into 100 sec bins |
 |
 |
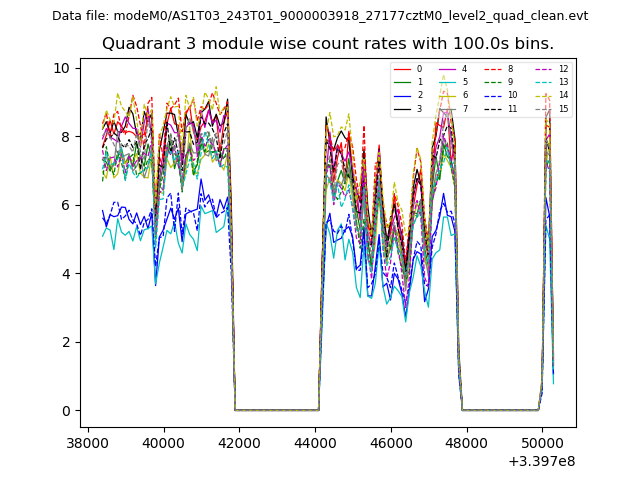
| Module-wise count rates for Quadrant D Data is divided into 100 sec bins |
 |
 |
| Parameter | Plot |
|---|---|
| CZT HV Monitor | 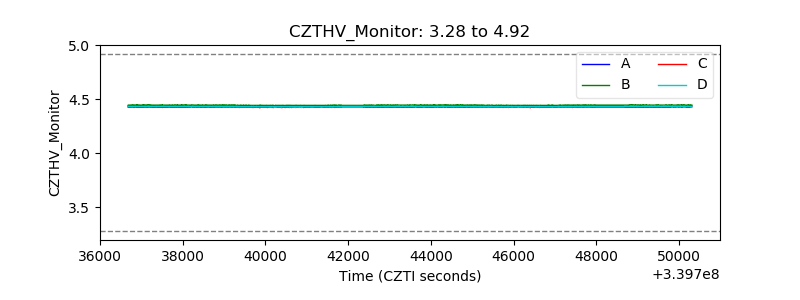 |
| D_VDD | 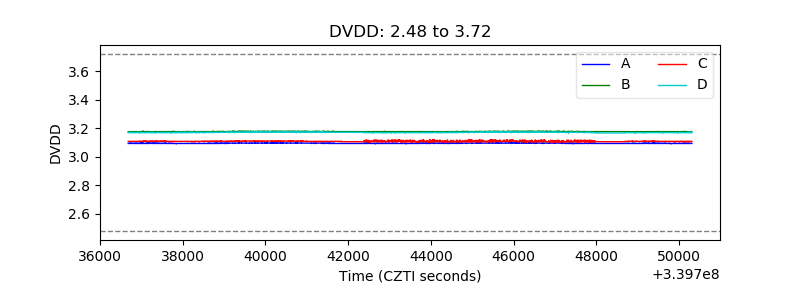 |
| Temperature 1 | 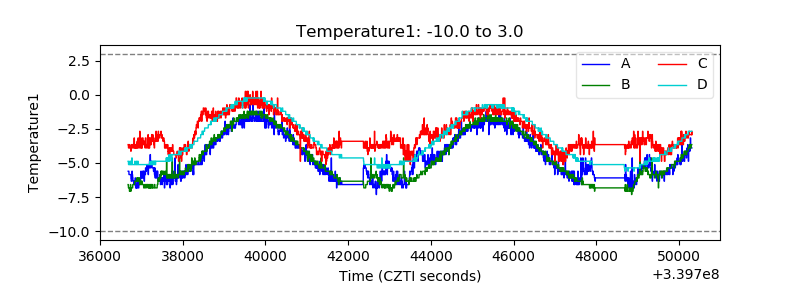 |
| Veto HV Monitor | 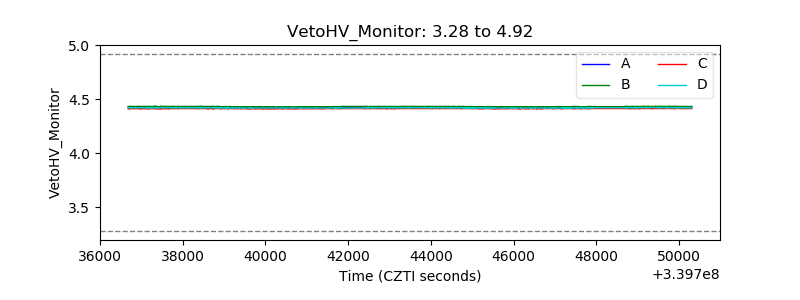 |
| Veto LLD | 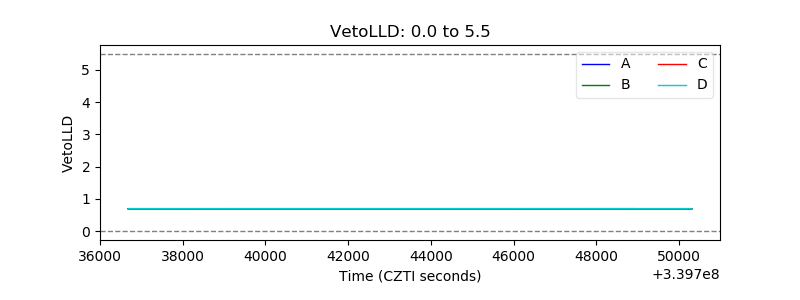 |
| Alpha Counter | 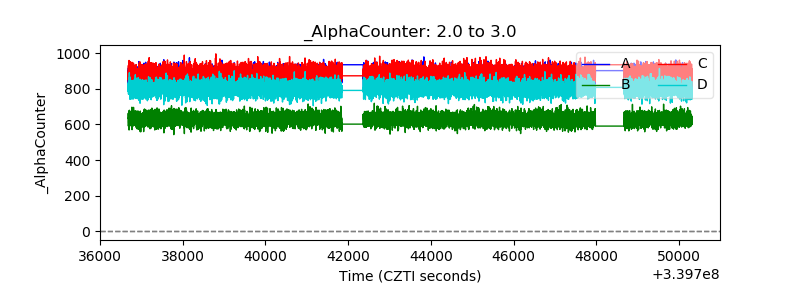 |
| _CPM_Rate |  |
| CZT Counter | 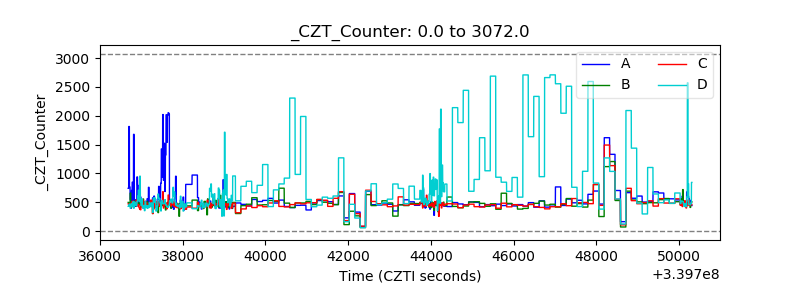 |
| +2.5 Volts monitor | 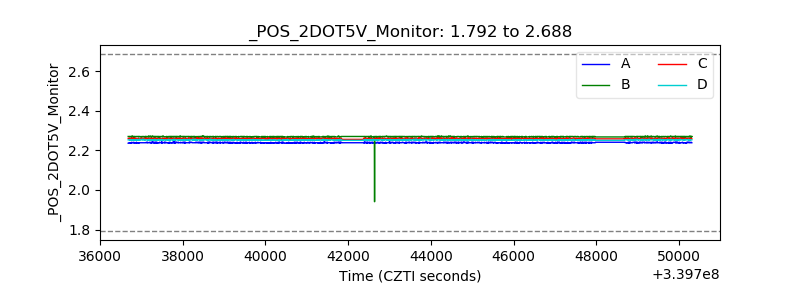 |
| +5 Volts monitor |  |
| _ROLL_ROT | 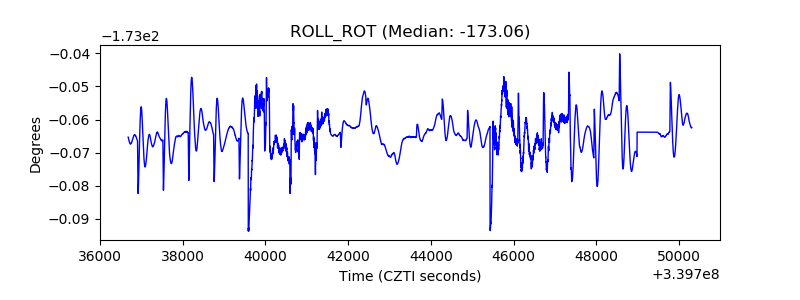 |
| _Roll_DEC |  |
| _Roll_RA |  |
| Veto Counter | 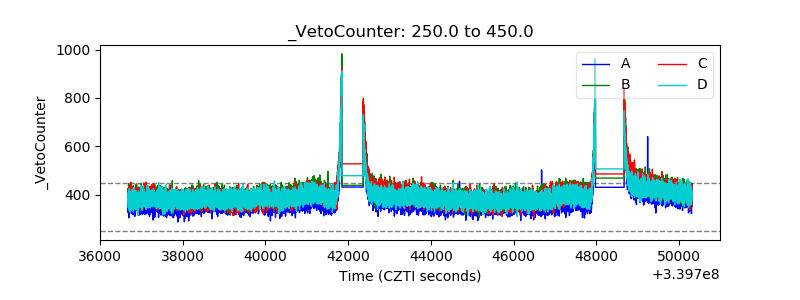 |