| Param | Original file | Final file |
|---|---|---|
| Filename | modeM0/AS1T03_243T01_9000003918_27178cztM0_level2.evt | modeM0/AS1T03_243T01_9000003918_27178cztM0_level2_quad_clean.evt |
| Size (bytes) | 565,992,000 | 82,414,080 |
| Size | 539.8 MB | 78.6 MB |
| Events in quadrant A | 3,559,919 | 521,487 |
| Events in quadrant B | 3,434,117 | 531,759 |
| Events in quadrant C | 3,337,786 | 508,892 |
| Events in quadrant D | 6,344,697 | 455,565 |
| Mode M9 | |||
|---|---|---|---|
| Quadrant | BADHDUFLAG | Total packets | Discarded packets |
| A | 0 | 9 | 0 |
| B | 0 | 9 | 0 |
| C | 0 | 9 | 0 |
| D | 0 | 9 | 0 |
| Mode M0 | |||
|---|---|---|---|
| Quadrant | BADHDUFLAG | Total packets | Discarded packets |
| A | 0 | 14646 | 0 |
| B | 0 | 14253 | 0 |
| C | 0 | 14110 | 0 |
| D | 0 | 23296 | 0 |
| Quadrant | Total seconds | Saturated seconds | Saturation percentage |
|---|---|---|---|
| A | 6855 | 74 | 1.079504% |
| B | 6856 | 81 | 1.181447% |
| C | 6855 | 104 | 1.517141% |
| D | 6855 | 945 | 13.785558% |
Noise dominated data is calculated using 1-second bins in cleaned event files. If a bin has >2000 counts, and if more than 50% of those come from <1% of pixels, then it is considered to be noise-dominated and hence unusable.
| Quadrant | # 1 sec bins | Bins with >0 counts | Bins with >2000 counts | High rate bins dominated by noise | Noise dominated (total time) | Noise dominated (detector-on time) | Marked lightcurve |
|---|---|---|---|---|---|---|---|
| A | 7725 | 6856 | 1 | 1 | 0.01% | 0.01% | 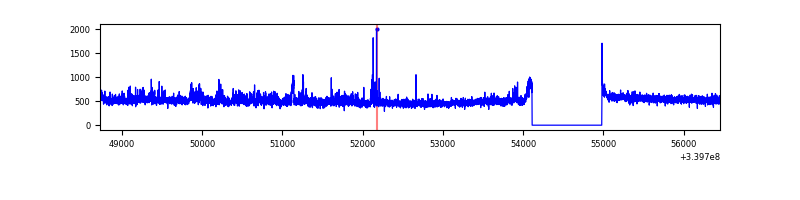 |
| B | 7726 | 6857 | 1 | 1 | 0.01% | 0.01% | 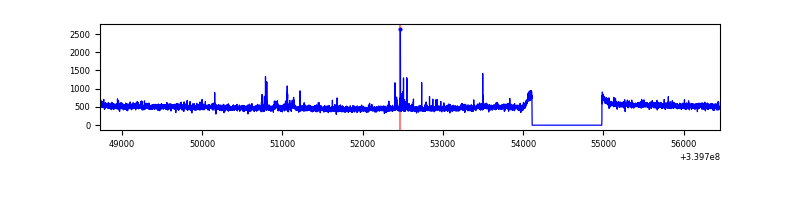 |
| C | 7725 | 6856 | 0 | 0 | 0.00% | 0.00% | 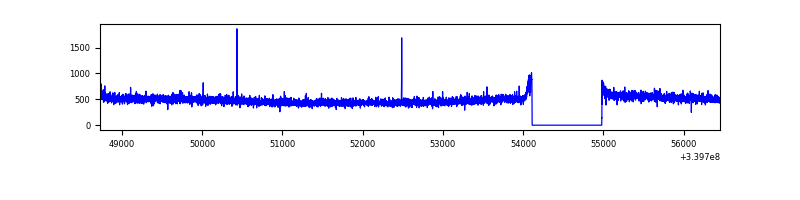 |
| D | 7725 | 6856 | 777 | 777 | 10.06% | 11.33% | 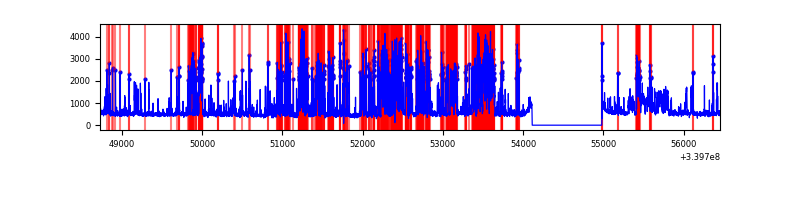 |
Top three noisy pixels from each quadrant. If the there are fewer than three noisy pixels in the level2.evt file, extra rows are filled as -1
| Pixel properties | Quadrant properties | ||||||
|---|---|---|---|---|---|---|---|
| Quadrant | DetID | PixID | Counts | Sigma | Mean | Median | Sigma |
| A | 0 | 13 | 124147 | 707.59 | 860 | 841 | 174.3 |
| A | 6 | 16 | 97304 | 553.55 | 860 | 841 | 174.3 |
| A | 15 | 174 | 13333 | 71.69 | 860 | 841 | 174.3 |
| B | 0 | 190 | 37871 | 223.23 | 856 | 834 | 165.9 |
| B | 12 | 111 | 20808 | 120.39 | 856 | 834 | 165.9 |
| B | 0 | 245 | 19701 | 113.72 | 856 | 834 | 165.9 |
| C | 14 | 238 | 131639 | 676.12 | 821 | 824 | 193.5 |
| C | 15 | 208 | 7902 | 36.58 | 821 | 824 | 193.5 |
| C | 13 | 61 | 5344 | 23.36 | 821 | 824 | 193.5 |
| D | 12 | 1 | 2305102 | 12428.1 | 787 | 769 | 185.4 |
| D | 1 | 52 | 814868 | 4390.73 | 787 | 769 | 185.4 |
| D | 2 | 250 | 182360 | 979.39 | 787 | 769 | 185.4 |
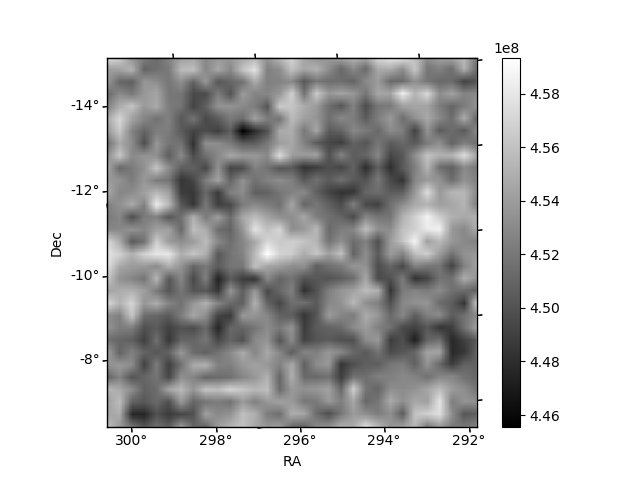
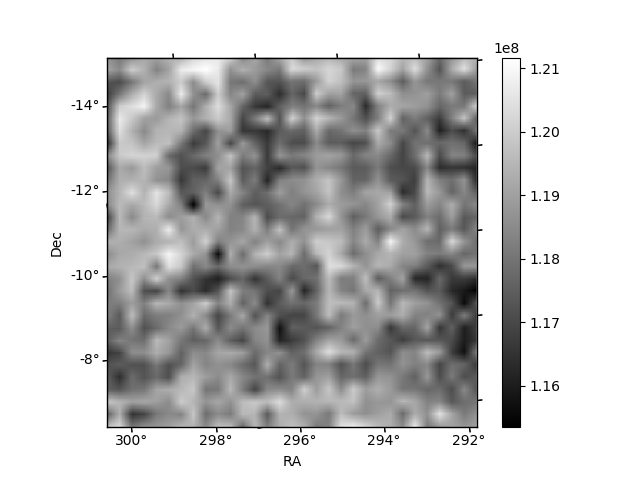
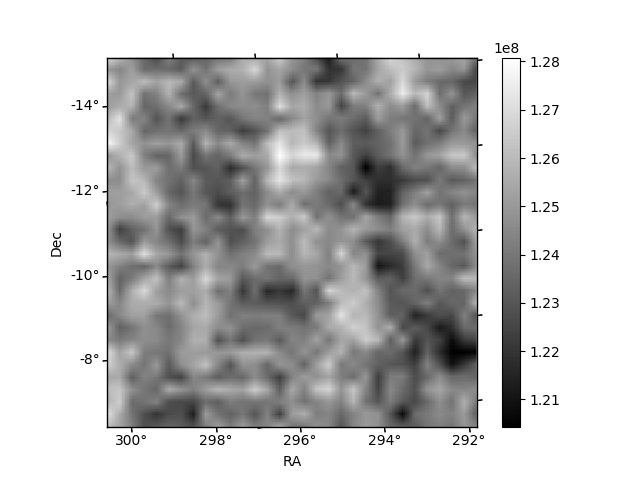
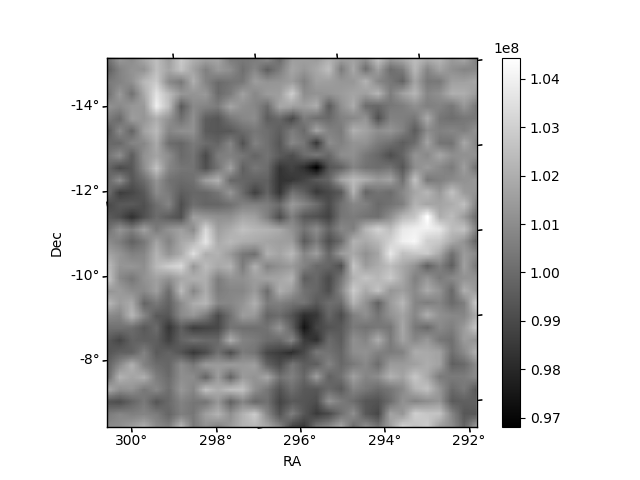
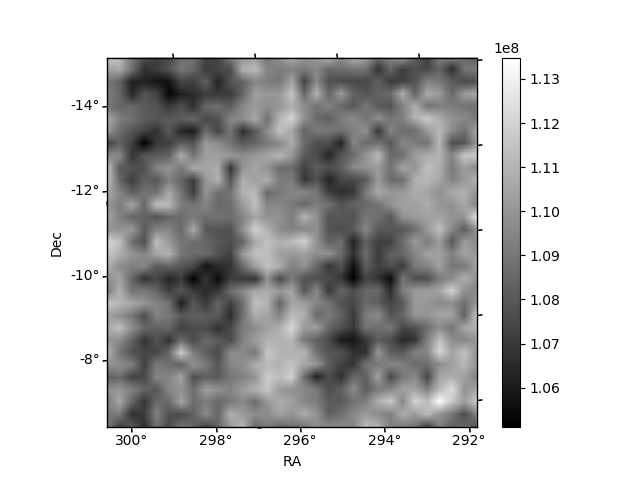
Histogram calculated using DETX and DETY for each event in the final _common_clean file
| Quadrant A | 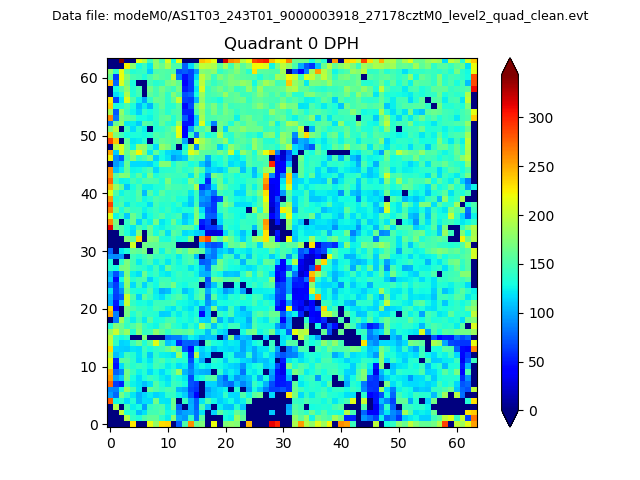 |
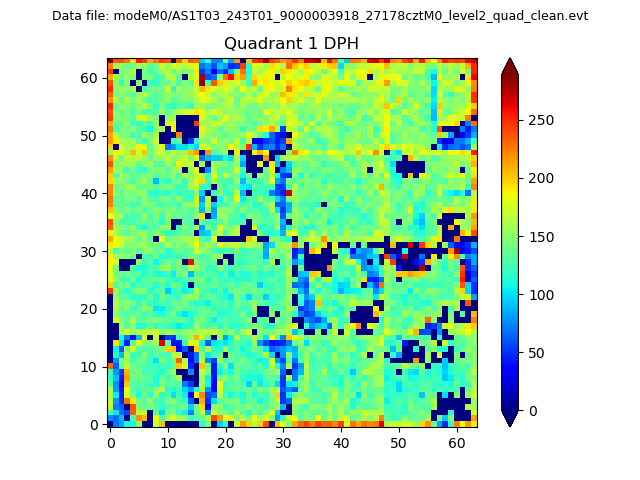 |
Quadrant B |
|---|---|---|---|
| Quadrant D | 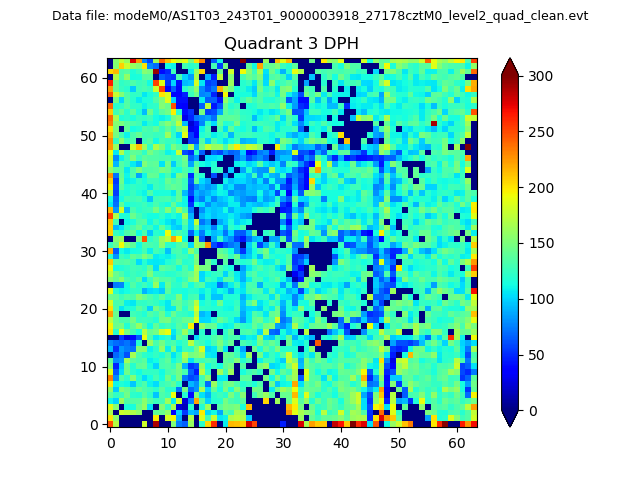 |
 |
Quadrant C |
| Plot type | Count rate plots | Images |
|---|---|---|
| Comparison with Poisson distribution Blue bars denote a histogram of data divided into 1 sec bins. Red curve is a Poisson curve with rate = median count rate of data. |
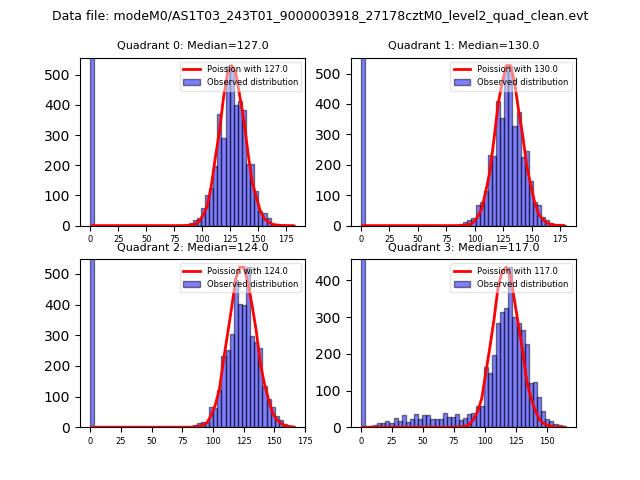 |
 |
| Quadrant-wise count rates Data is divided into 100 sec bins |
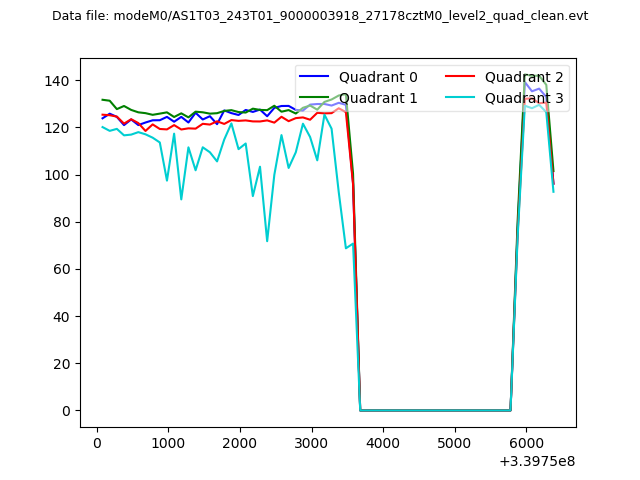 |
|
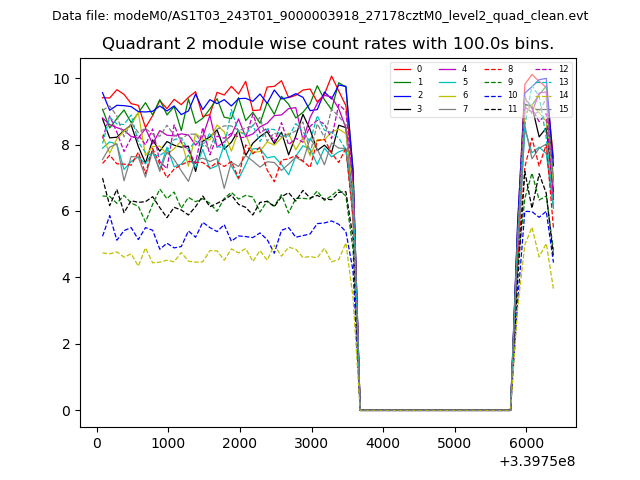
| Module-wise count rates for Quadrant A Data is divided into 100 sec bins |
 |
 |
| Module-wise count rates for Quadrant B Data is divided into 100 sec bins |
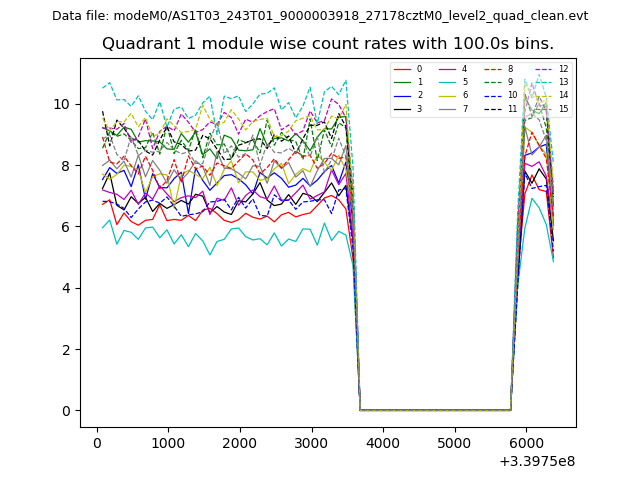 |
 |
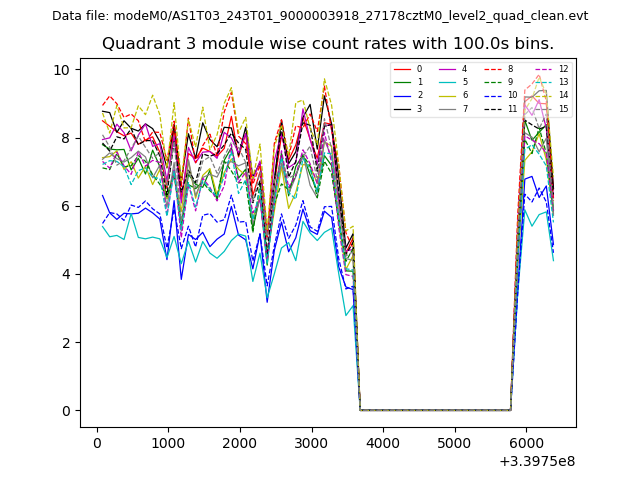
| Module-wise count rates for Quadrant C Data is divided into 100 sec bins |
 |
 |
| Module-wise count rates for Quadrant D Data is divided into 100 sec bins |
 |
 |
| Parameter | Plot |
|---|---|
| CZT HV Monitor | 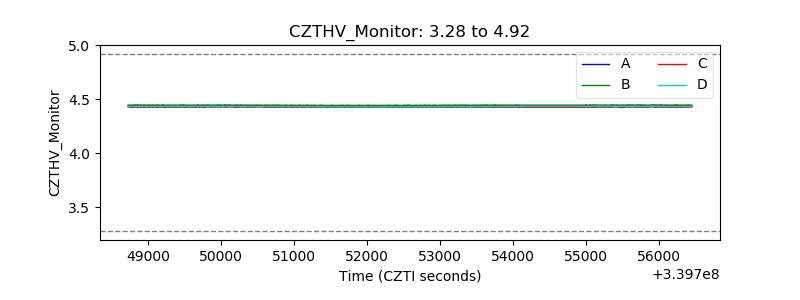 |
| D_VDD | 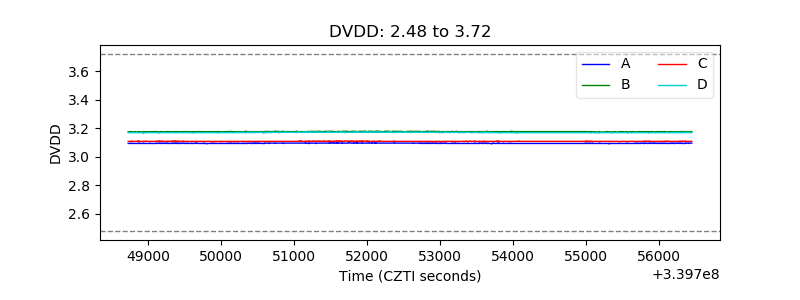 |
| Temperature 1 | 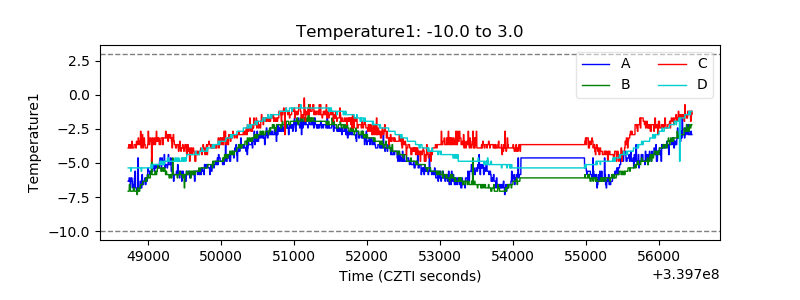 |
| Veto HV Monitor | 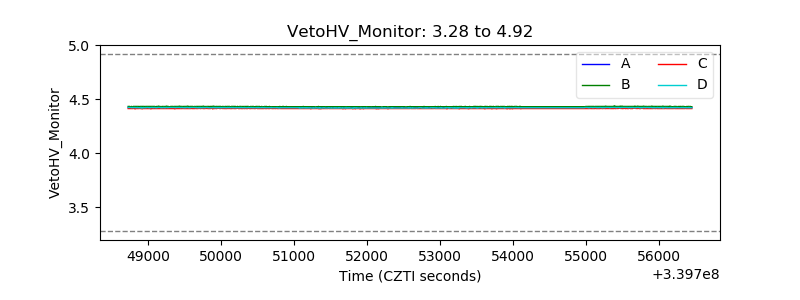 |
| Veto LLD | 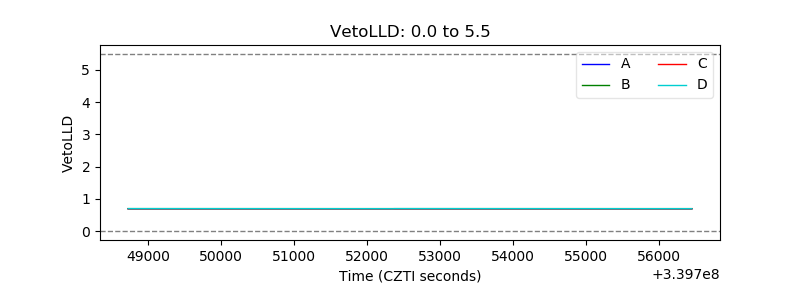 |
| Alpha Counter | 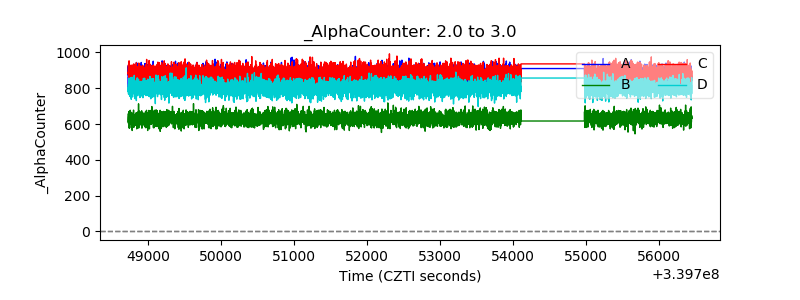 |
| _CPM_Rate | 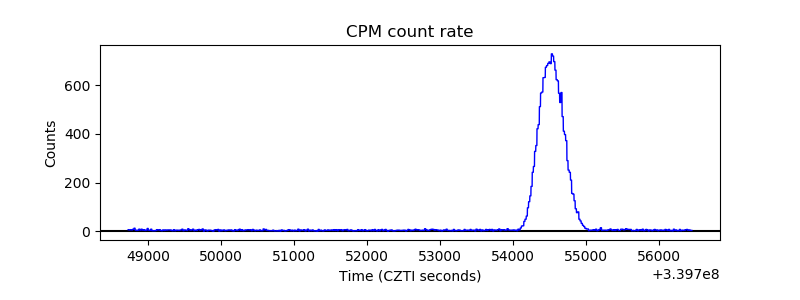 |
| CZT Counter | 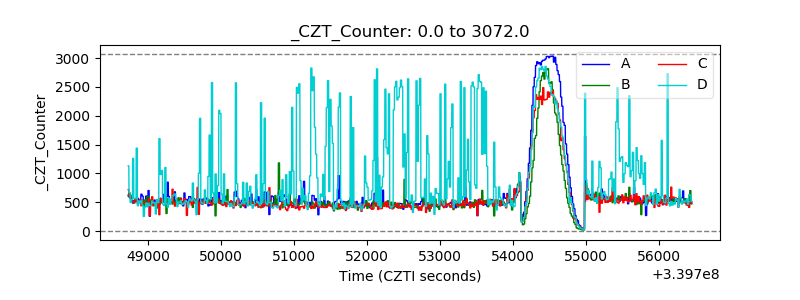 |
| +2.5 Volts monitor | 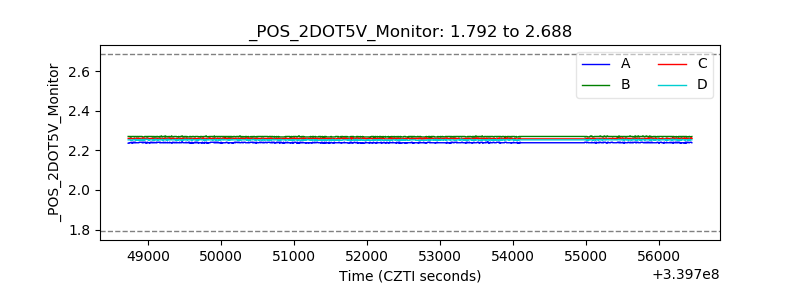 |
| +5 Volts monitor | 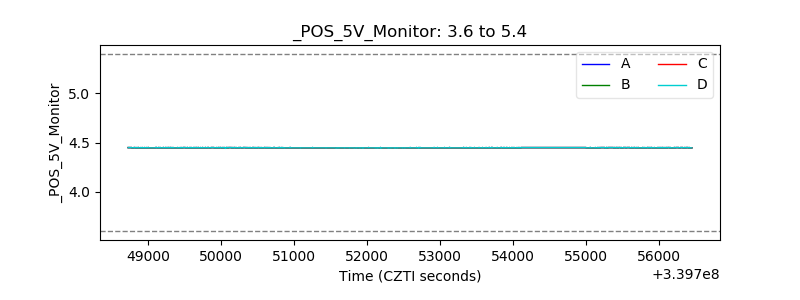 |
| _ROLL_ROT | 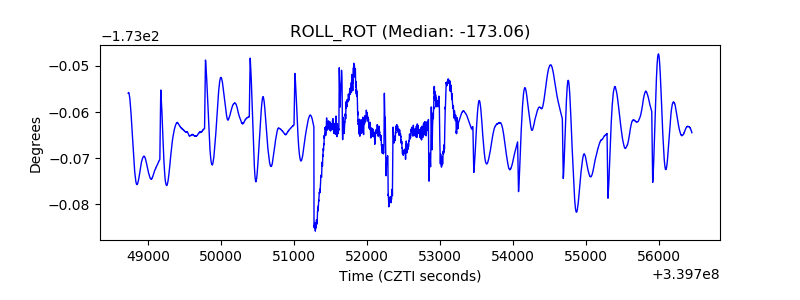 |
| _Roll_DEC | 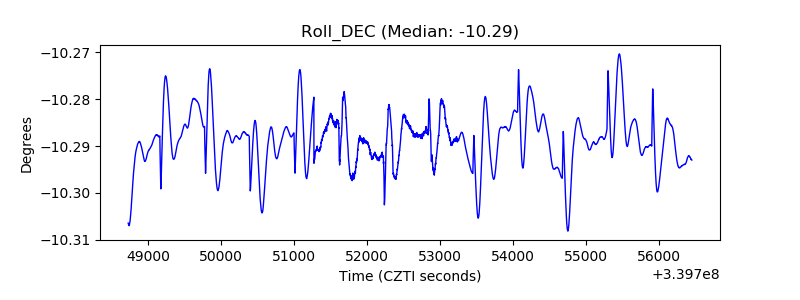 |
| _Roll_RA | 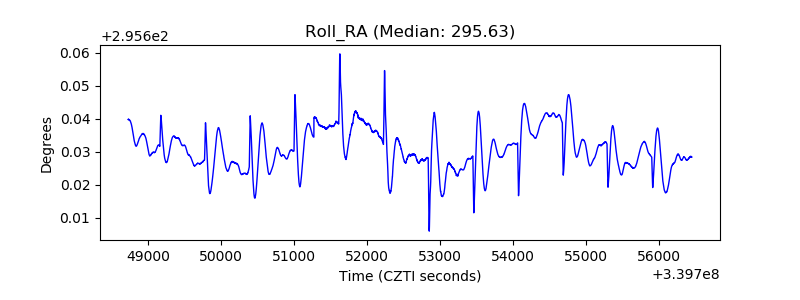 |
| Veto Counter | 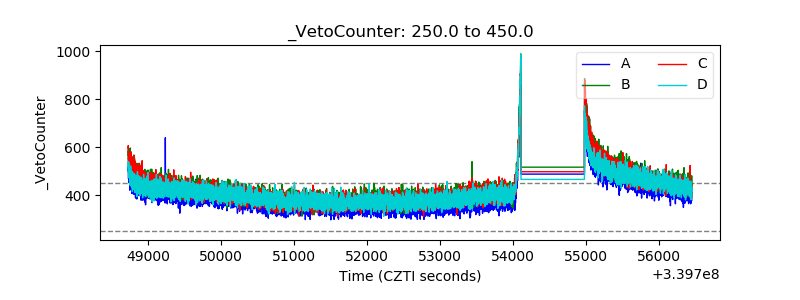 |