| Param | Original file | Final file |
|---|---|---|
| Filename | modeM0/AS1T03_243T01_9000003918_27179cztM0_level2.evt | modeM0/AS1T03_243T01_9000003918_27179cztM0_level2_quad_clean.evt |
| Size (bytes) | 530,864,640 | 90,014,400 |
| Size | 506.3 MB | 85.8 MB |
| Events in quadrant A | 3,566,605 | 600,445 |
| Events in quadrant B | 3,058,749 | 613,726 |
| Events in quadrant C | 2,990,920 | 583,739 |
| Events in quadrant D | 6,049,503 | 503,937 |
| Mode M9 | |||
|---|---|---|---|
| Quadrant | BADHDUFLAG | Total packets | Discarded packets |
| A | 0 | 11 | 0 |
| B | 0 | 11 | 0 |
| C | 0 | 11 | 0 |
| D | 0 | 11 | 0 |
| Mode M0 | |||
|---|---|---|---|
| Quadrant | BADHDUFLAG | Total packets | Discarded packets |
| A | 0 | 14482 | 0 |
| B | 0 | 12896 | 0 |
| C | 0 | 12781 | 0 |
| D | 0 | 22006 | 0 |
| Quadrant | Total seconds | Saturated seconds | Saturation percentage |
|---|---|---|---|
| A | 6064 | 91 | 1.500660% |
| B | 6064 | 63 | 1.038918% |
| C | 6064 | 97 | 1.599604% |
| D | 6064 | 1053 | 17.364776% |
Noise dominated data is calculated using 1-second bins in cleaned event files. If a bin has >2000 counts, and if more than 50% of those come from <1% of pixels, then it is considered to be noise-dominated and hence unusable.
| Quadrant | # 1 sec bins | Bins with >0 counts | Bins with >2000 counts | High rate bins dominated by noise | Noise dominated (total time) | Noise dominated (detector-on time) | Marked lightcurve |
|---|---|---|---|---|---|---|---|
| A | 7124 | 6065 | 37 | 37 | 0.52% | 0.61% | 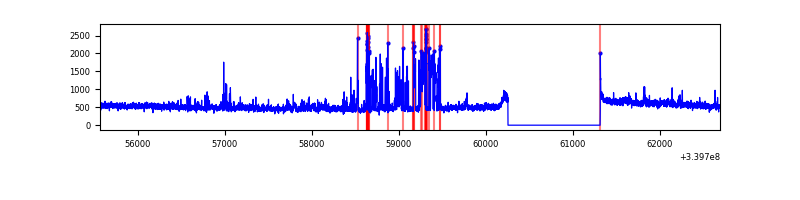 |
| B | 7124 | 6065 | 0 | 0 | 0.00% | 0.00% | 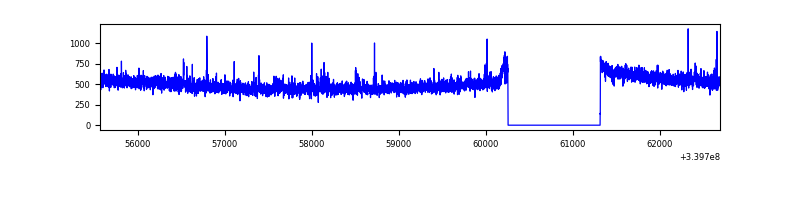 |
| C | 7124 | 6065 | 0 | 0 | 0.00% | 0.00% | 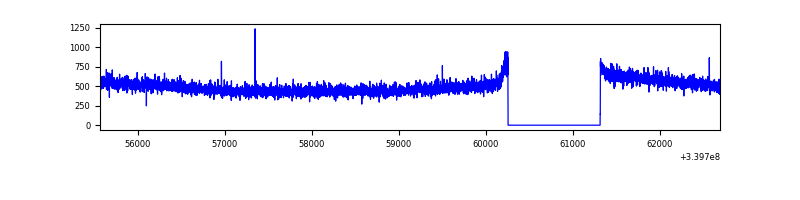 |
| D | 7124 | 6065 | 850 | 850 | 11.93% | 14.01% | 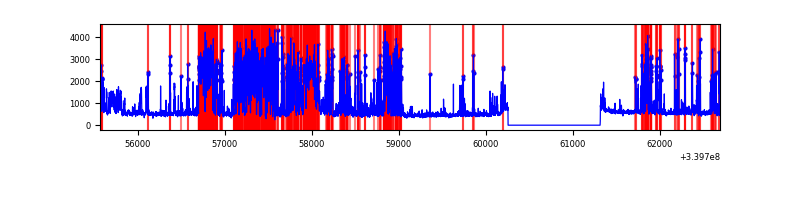 |
Top three noisy pixels from each quadrant. If the there are fewer than three noisy pixels in the level2.evt file, extra rows are filled as -1
| Pixel properties | Quadrant properties | ||||||
|---|---|---|---|---|---|---|---|
| Quadrant | DetID | PixID | Counts | Sigma | Mean | Median | Sigma |
| A | 6 | 16 | 503263 | 3210.5 | 777 | 762 | 156.5 |
| A | 0 | 13 | 41320 | 259.13 | 777 | 762 | 156.5 |
| A | 14 | 235 | 18171 | 111.23 | 777 | 762 | 156.5 |
| B | 0 | 190 | 22905 | 150.67 | 769 | 751 | 147.0 |
| B | 12 | 111 | 17795 | 115.92 | 769 | 751 | 147.0 |
| B | 11 | 111 | 16158 | 104.79 | 769 | 751 | 147.0 |
| C | 14 | 238 | 119122 | 679.1 | 736 | 739 | 174.3 |
| C | 13 | 61 | 4971 | 24.28 | 736 | 739 | 174.3 |
| C | 2 | 16 | 3645 | 16.67 | 736 | 739 | 174.3 |
| D | 12 | 1 | 1808302 | 10186.42 | 691 | 675 | 177.5 |
| D | 1 | 52 | 1056567 | 5950.21 | 691 | 675 | 177.5 |
| D | 7 | 38 | 387228 | 2178.32 | 691 | 675 | 177.5 |
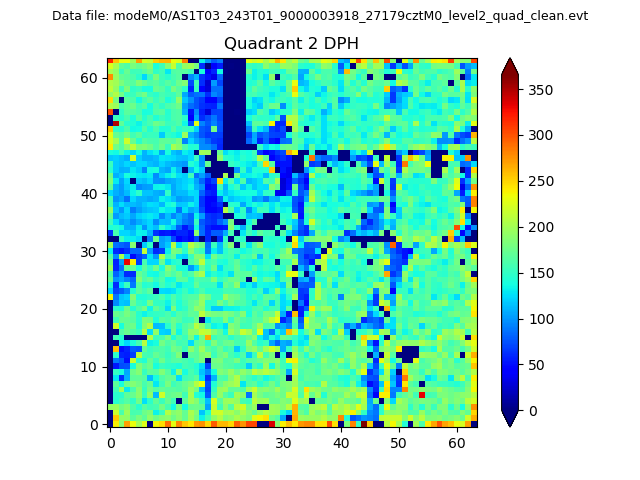
Histogram calculated using DETX and DETY for each event in the final _common_clean file
| Quadrant A | 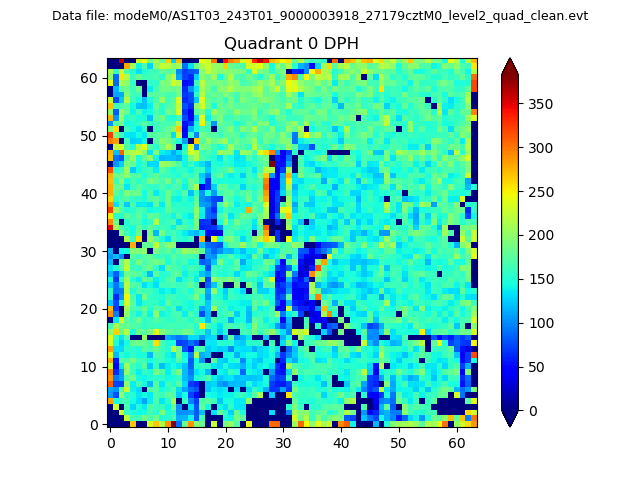 |
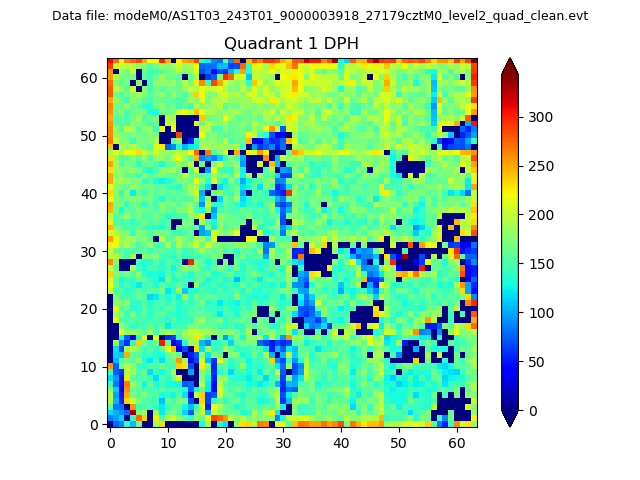 |
Quadrant B |
|---|---|---|---|
| Quadrant D | 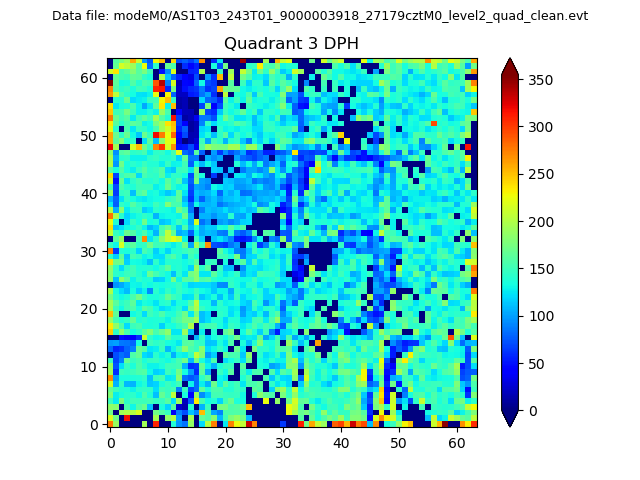 |
 |
Quadrant C |
| Plot type | Count rate plots | Images |
|---|---|---|
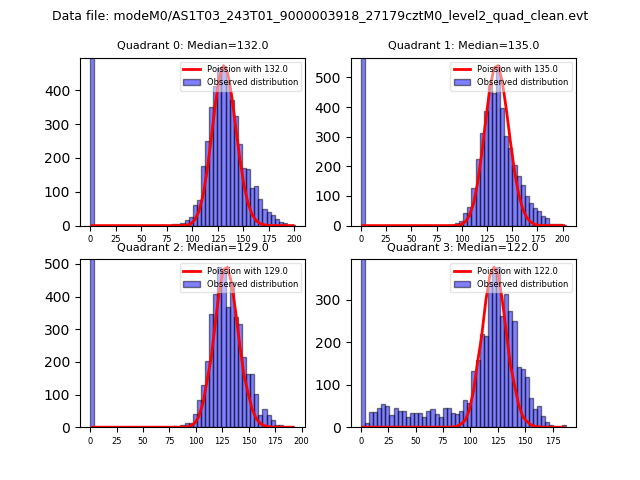
| Comparison with Poisson distribution Blue bars denote a histogram of data divided into 1 sec bins. Red curve is a Poisson curve with rate = median count rate of data. |
 |
 |
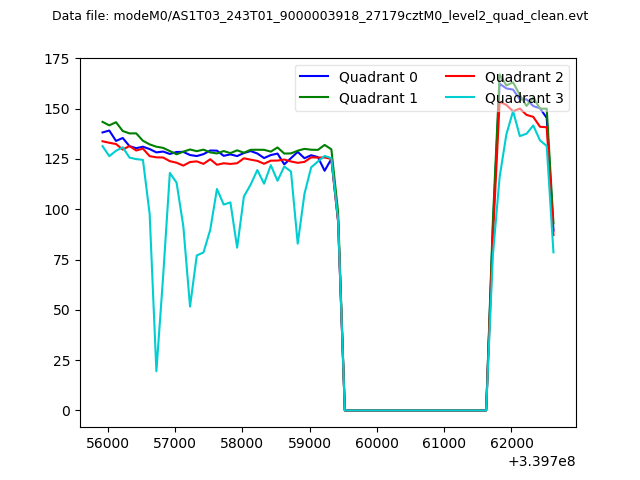
| Quadrant-wise count rates Data is divided into 100 sec bins |
 |
|
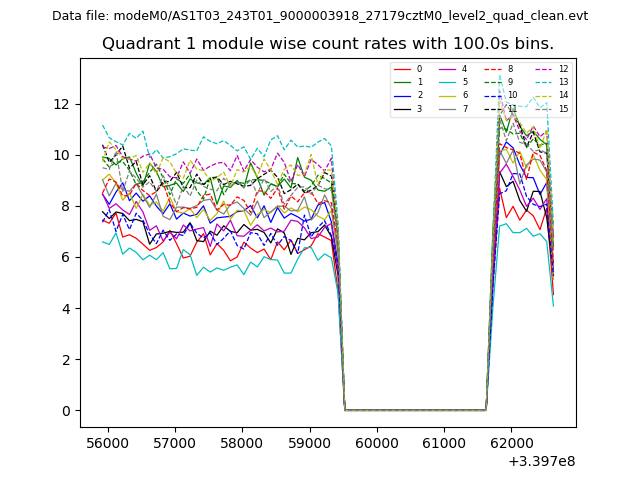
| Module-wise count rates for Quadrant A Data is divided into 100 sec bins |
 |
 |
| Module-wise count rates for Quadrant B Data is divided into 100 sec bins |
 |
 |
| Module-wise count rates for Quadrant C Data is divided into 100 sec bins |
 |
 |
| Module-wise count rates for Quadrant D Data is divided into 100 sec bins |
 |
 |
| Parameter | Plot |
|---|---|
| CZT HV Monitor | 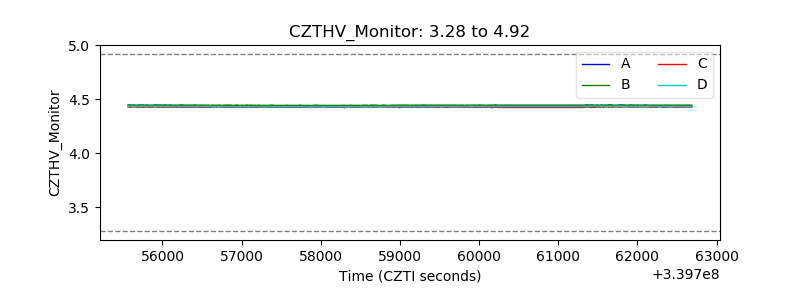 |
| D_VDD | 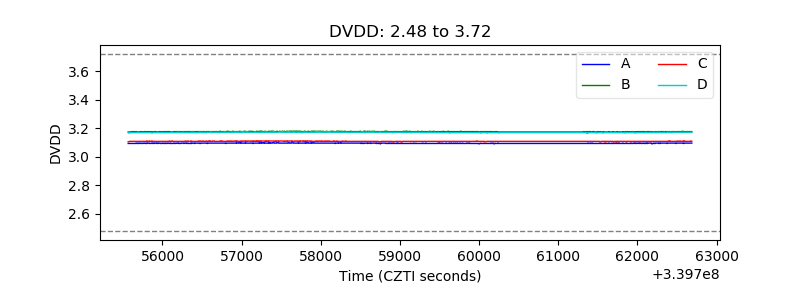 |
| Temperature 1 | 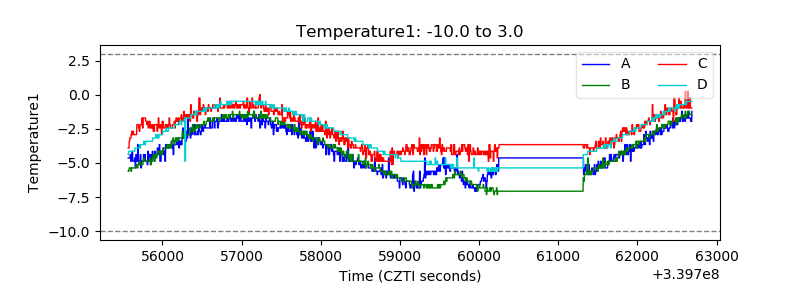 |
| Veto HV Monitor |  |
| Veto LLD | 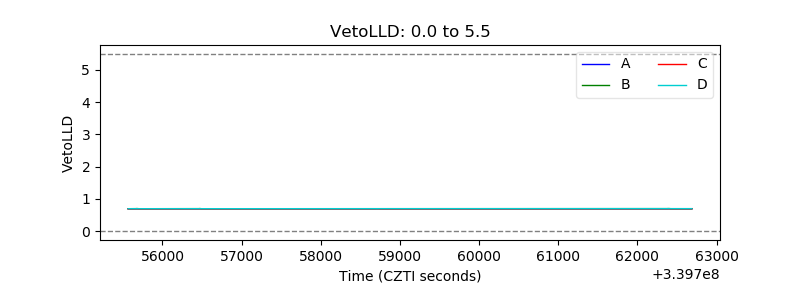 |
| Alpha Counter | 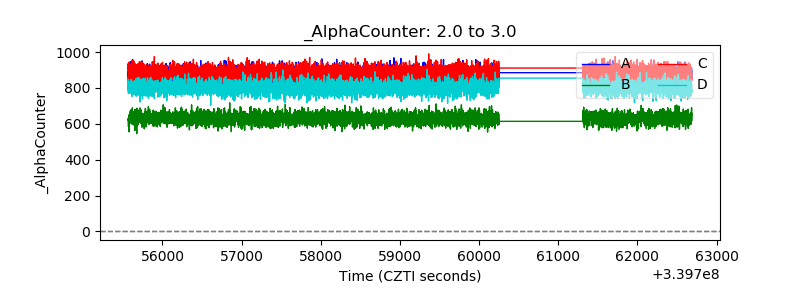 |
| _CPM_Rate | 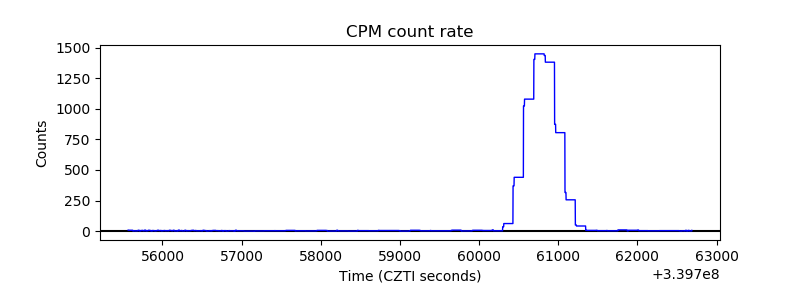 |
| CZT Counter | 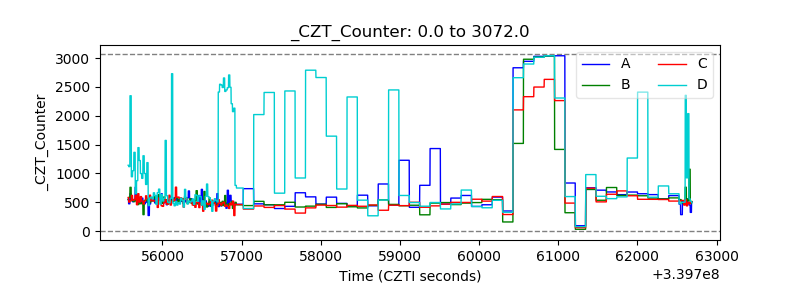 |
| +2.5 Volts monitor | 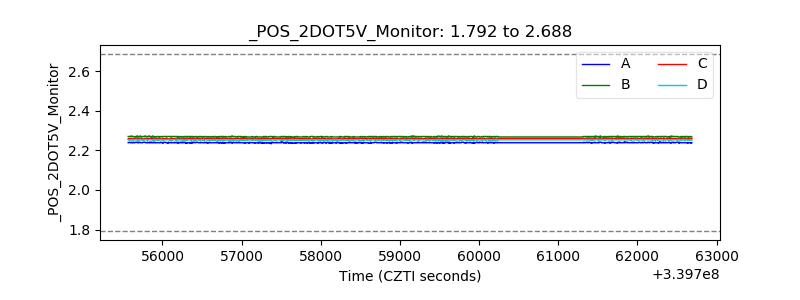 |
| +5 Volts monitor |  |
| _ROLL_ROT | 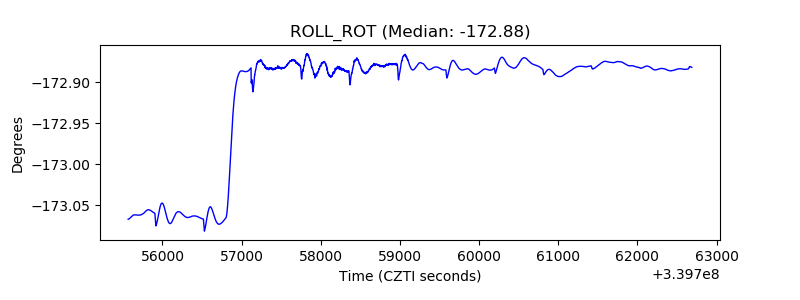 |
| _Roll_DEC |  |
| _Roll_RA | 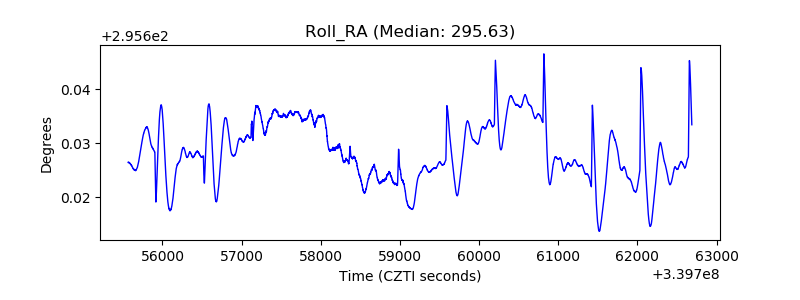 |
| Veto Counter | 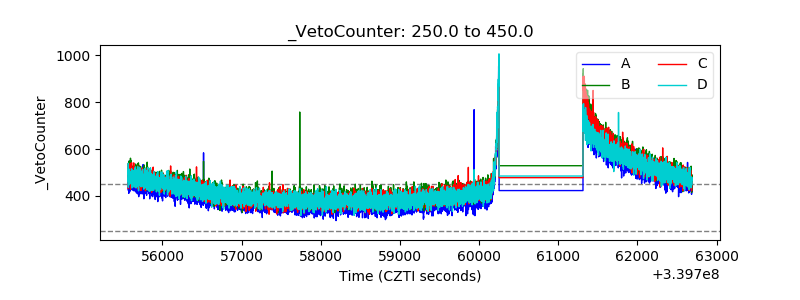 |