| Param | Original file | Final file |
|---|---|---|
| Filename | modeM0/AS1T03_243T01_9000003918_27182cztM0_level2.evt | modeM0/AS1T03_243T01_9000003918_27182cztM0_level2_quad_clean.evt |
| Size (bytes) | 549,587,520 | 106,269,120 |
| Size | 524.1 MB | 101.3 MB |
| Events in quadrant A | 3,487,588 | 741,019 |
| Events in quadrant B | 3,264,249 | 746,865 |
| Events in quadrant C | 3,129,579 | 696,451 |
| Events in quadrant D | 6,356,107 | 614,506 |
| Mode M9 | |||
|---|---|---|---|
| Quadrant | BADHDUFLAG | Total packets | Discarded packets |
| A | 0 | 12 | 0 |
| B | 0 | 12 | 0 |
| C | 0 | 12 | 0 |
| D | 0 | 12 | 0 |
| Mode M0 | |||
|---|---|---|---|
| Quadrant | BADHDUFLAG | Total packets | Discarded packets |
| A | 0 | 14262 | 0 |
| B | 0 | 13506 | 0 |
| C | 0 | 13062 | 0 |
| D | 0 | 23197 | 0 |
| Quadrant | Total seconds | Saturated seconds | Saturation percentage |
|---|---|---|---|
| A | 6003 | 138 | 2.298851% |
| B | 6004 | 99 | 1.648901% |
| C | 6003 | 124 | 2.065634% |
| D | 6003 | 965 | 16.075296% |
Noise dominated data is calculated using 1-second bins in cleaned event files. If a bin has >2000 counts, and if more than 50% of those come from <1% of pixels, then it is considered to be noise-dominated and hence unusable.
| Quadrant | # 1 sec bins | Bins with >0 counts | Bins with >2000 counts | High rate bins dominated by noise | Noise dominated (total time) | Noise dominated (detector-on time) | Marked lightcurve |
|---|---|---|---|---|---|---|---|
| A | 7238 | 6004 | 38 | 38 | 0.53% | 0.63% | 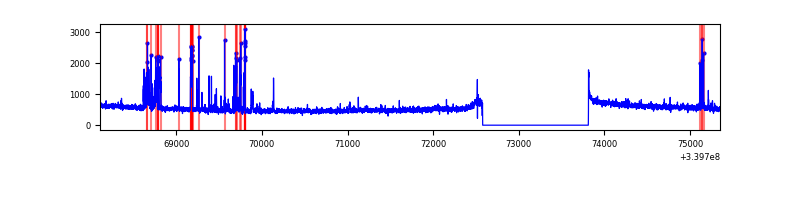 |
| B | 7239 | 6005 | 6 | 6 | 0.08% | 0.10% | 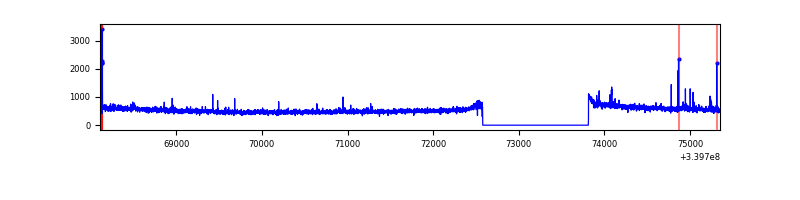 |
| C | 7238 | 6004 | 1 | 1 | 0.01% | 0.02% | 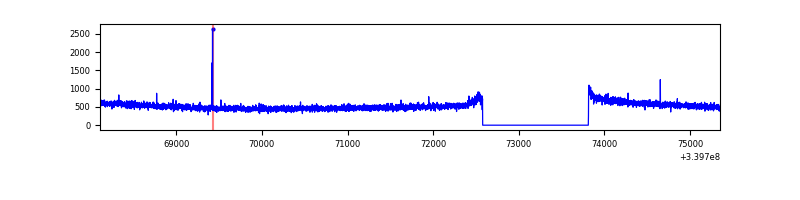 |
| D | 7238 | 6004 | 763 | 763 | 10.54% | 12.71% | 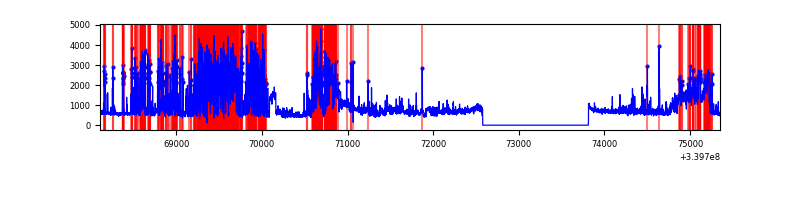 |
Top three noisy pixels from each quadrant. If the there are fewer than three noisy pixels in the level2.evt file, extra rows are filled as -1
| Pixel properties | Quadrant properties | ||||||
|---|---|---|---|---|---|---|---|
| Quadrant | DetID | PixID | Counts | Sigma | Mean | Median | Sigma |
| A | 6 | 16 | 233397 | 1416.26 | 825 | 812 | 164.2 |
| A | 13 | 248 | 53926 | 323.42 | 825 | 812 | 164.2 |
| A | 0 | 13 | 10544 | 59.26 | 825 | 812 | 164.2 |
| B | 0 | 190 | 39703 | 252.94 | 812 | 795 | 153.8 |
| B | 5 | 172 | 21281 | 133.18 | 812 | 795 | 153.8 |
| B | 12 | 111 | 17461 | 108.34 | 812 | 795 | 153.8 |
| C | 14 | 238 | 124470 | 692.61 | 768 | 774 | 178.6 |
| C | 15 | 208 | 8280 | 42.03 | 768 | 774 | 178.6 |
| C | 13 | 61 | 5499 | 26.46 | 768 | 774 | 178.6 |
| D | 1 | 52 | 1597442 | 9078.29 | 739 | 721 | 175.9 |
| D | 12 | 1 | 1547872 | 8796.46 | 739 | 721 | 175.9 |
| D | 7 | 38 | 208806 | 1183.09 | 739 | 721 | 175.9 |
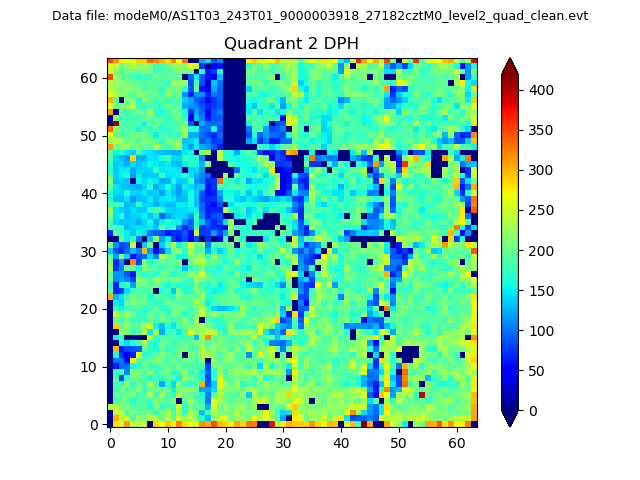
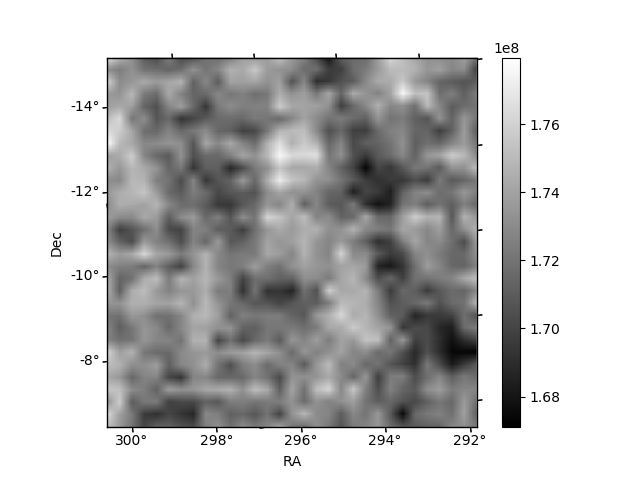
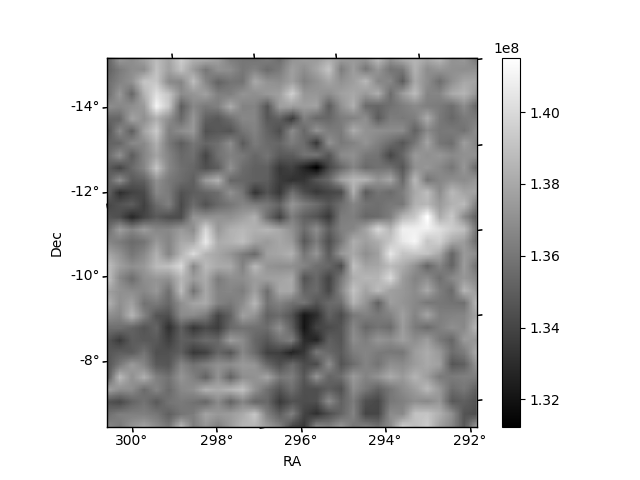
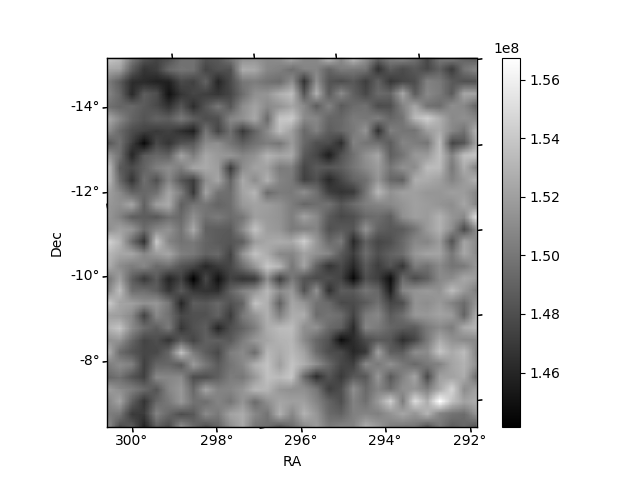
Histogram calculated using DETX and DETY for each event in the final _common_clean file
| Quadrant A | 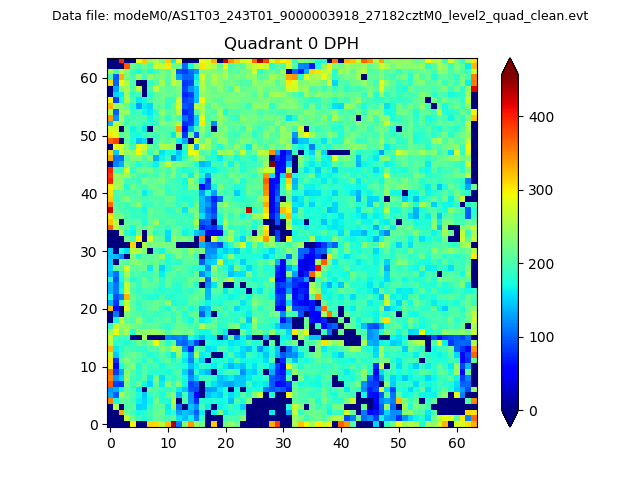 |
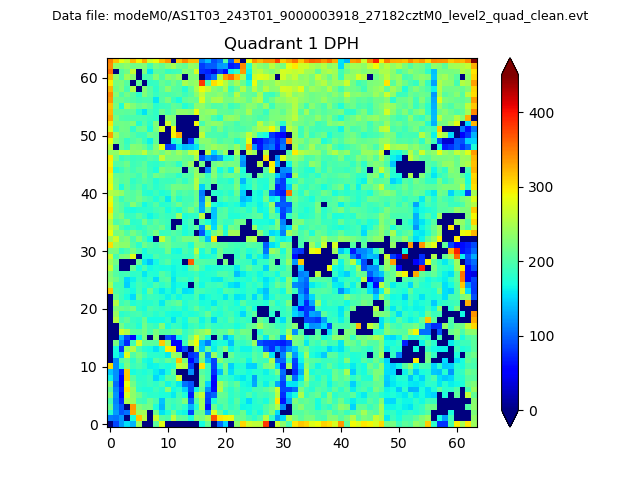 |
Quadrant B |
|---|---|---|---|
| Quadrant D | 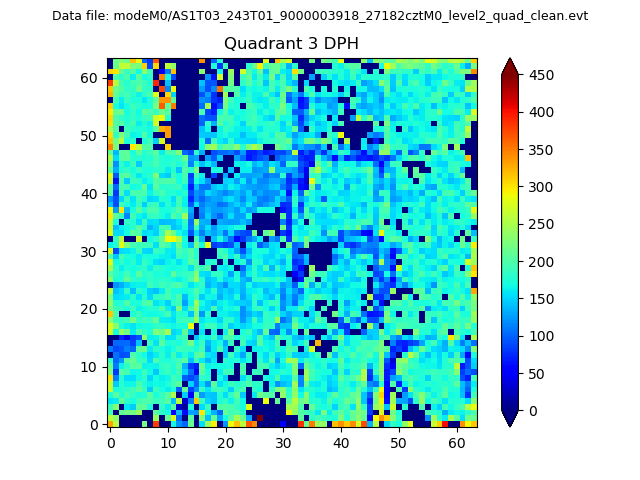 |
 |
Quadrant C |
| Plot type | Count rate plots | Images |
|---|---|---|
| Comparison with Poisson distribution Blue bars denote a histogram of data divided into 1 sec bins. Red curve is a Poisson curve with rate = median count rate of data. |
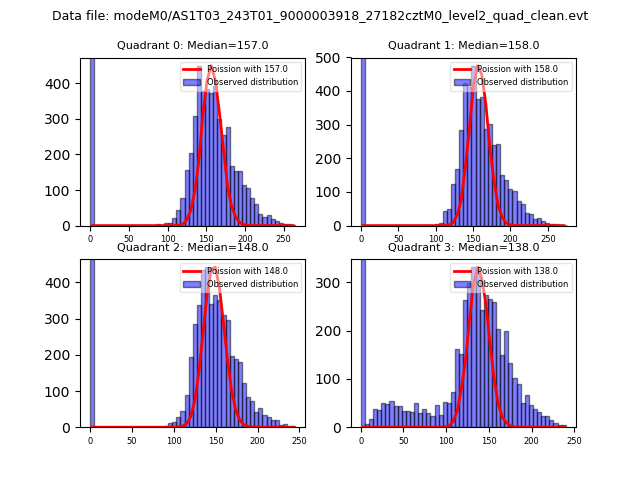 |
 |
| Quadrant-wise count rates Data is divided into 100 sec bins |
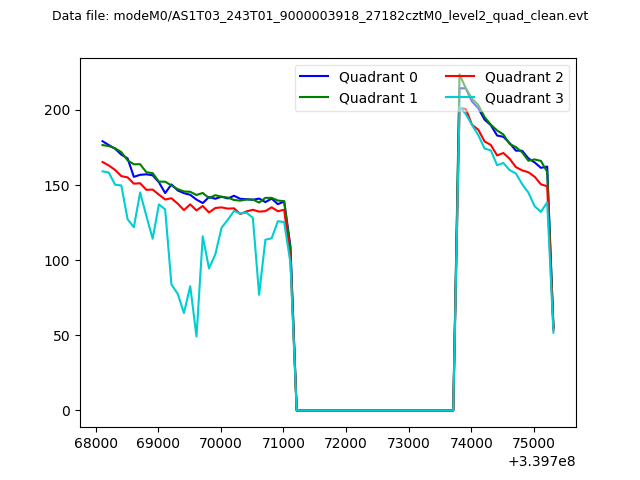 |
|
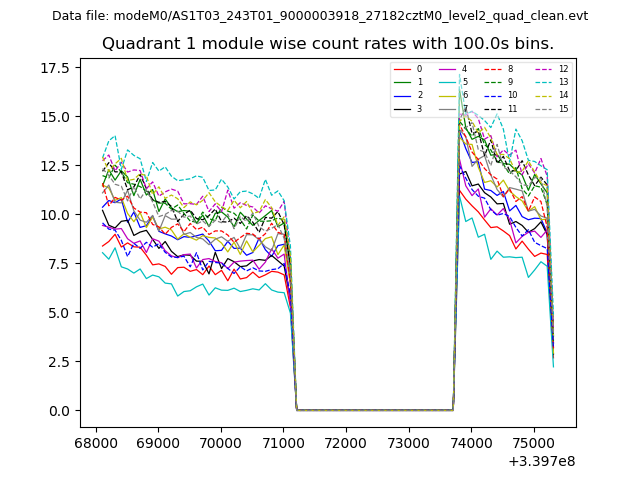
| Module-wise count rates for Quadrant A Data is divided into 100 sec bins |
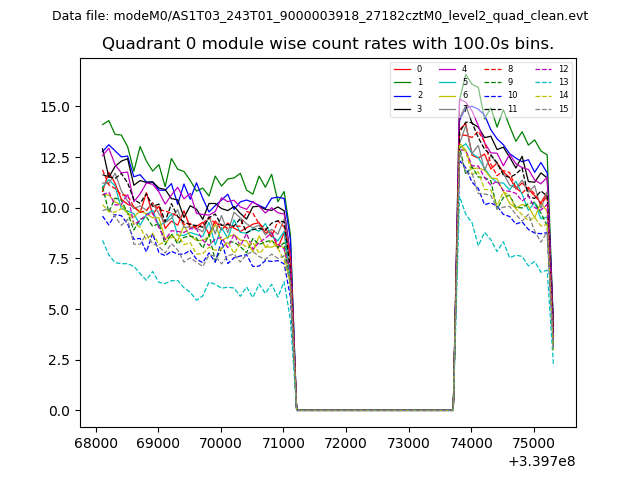 |
 |
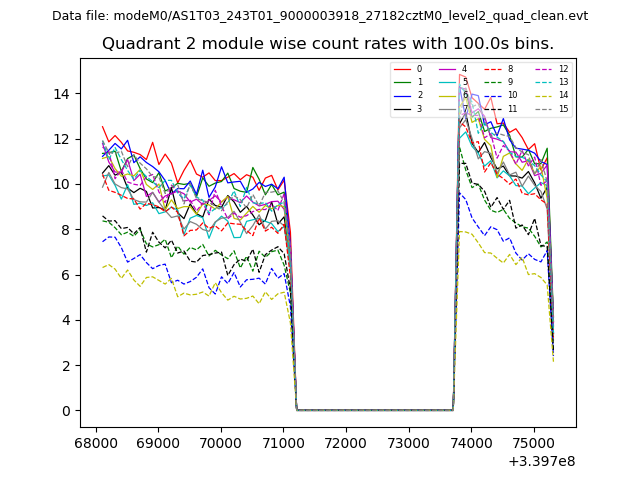
| Module-wise count rates for Quadrant B Data is divided into 100 sec bins |
 |
 |
| Module-wise count rates for Quadrant C Data is divided into 100 sec bins |
 |
 |
| Module-wise count rates for Quadrant D Data is divided into 100 sec bins |
 |
 |
| Parameter | Plot |
|---|---|
| CZT HV Monitor |  |
| D_VDD | 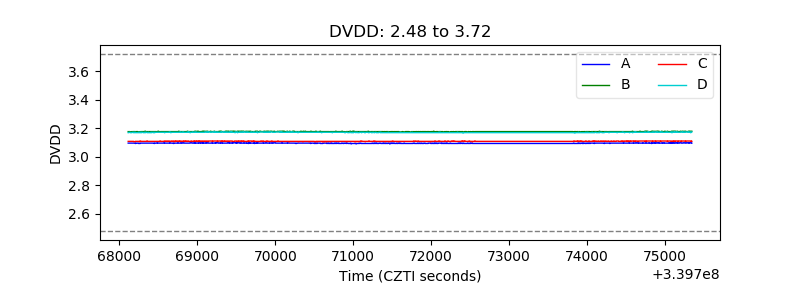 |
| Temperature 1 | 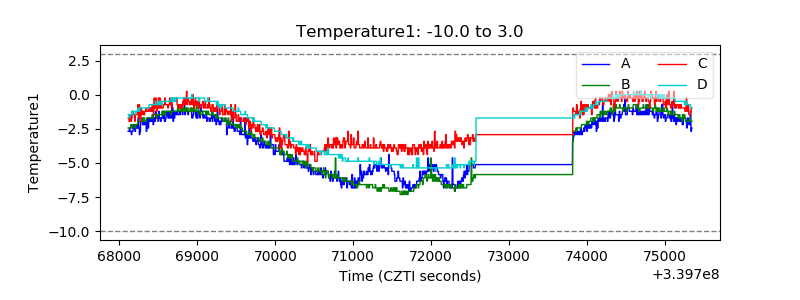 |
| Veto HV Monitor | 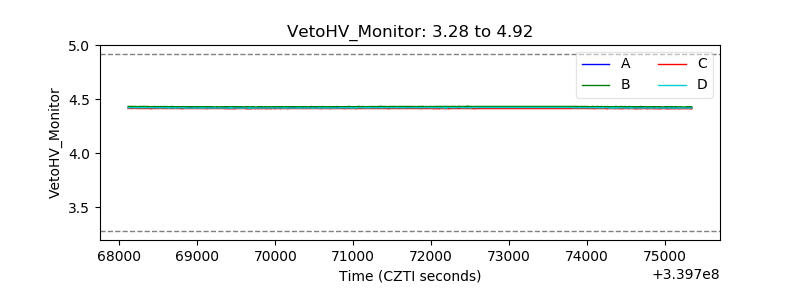 |
| Veto LLD | 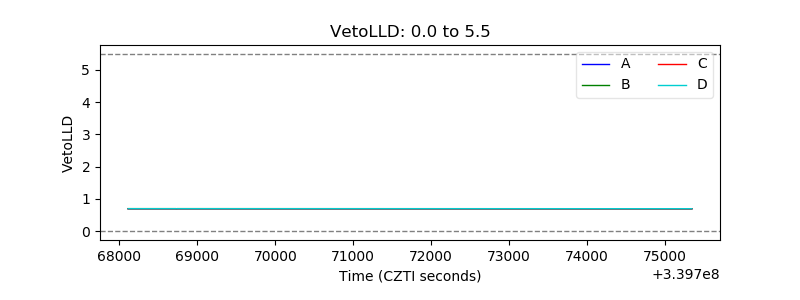 |
| Alpha Counter | 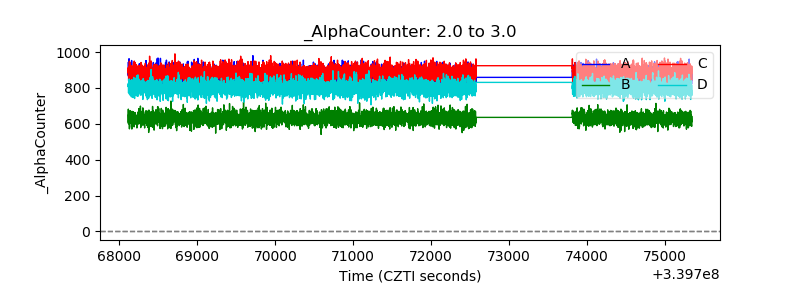 |
| _CPM_Rate | 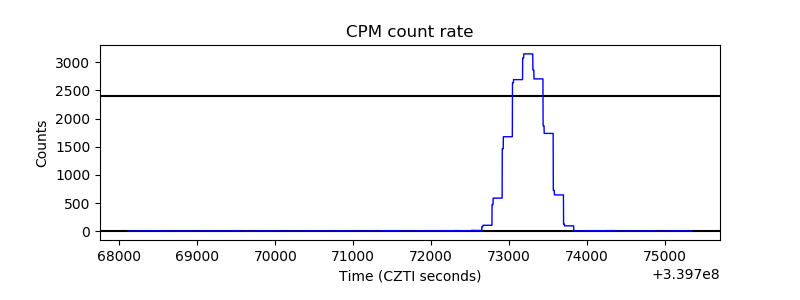 |
| CZT Counter | 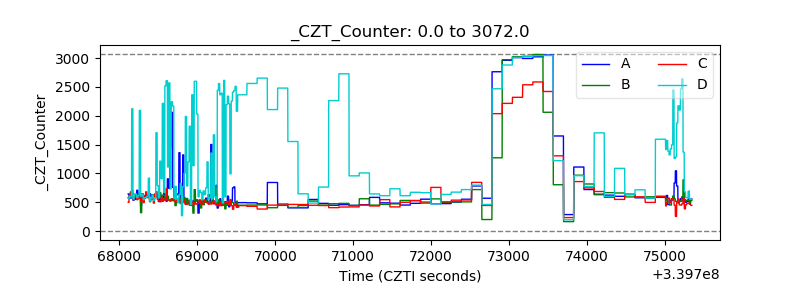 |
| +2.5 Volts monitor |  |
| +5 Volts monitor |  |
| _ROLL_ROT |  |
| _Roll_DEC | 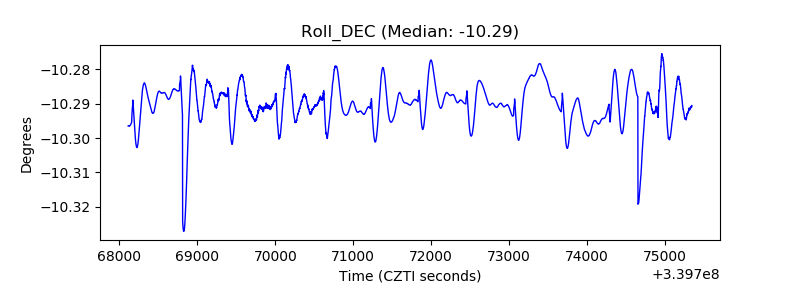 |
| _Roll_RA | 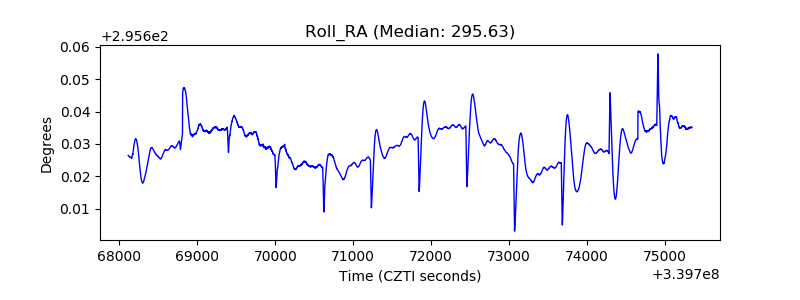 |
| Veto Counter | 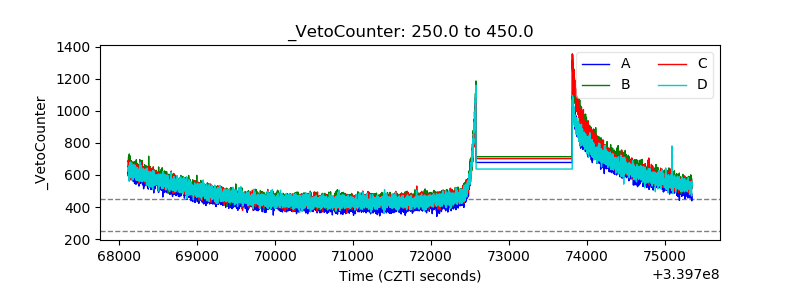 |