| Param | Original file | Final file |
|---|---|---|
| Filename | modeM0/AS1T03_243T01_9000003918_27183cztM0_level2.evt | modeM0/AS1T03_243T01_9000003918_27183cztM0_level2_quad_clean.evt |
| Size (bytes) | 1,375,738,560 | 260,023,680 |
| Size | 1.3 GB | 248.0 MB |
| Events in quadrant A | 8,848,090 | 1,790,102 |
| Events in quadrant B | 8,339,094 | 1,802,594 |
| Events in quadrant C | 8,187,285 | 1,683,898 |
| Events in quadrant D | 15,232,163 | 1,516,902 |
| Mode M9 | |||
|---|---|---|---|
| Quadrant | BADHDUFLAG | Total packets | Discarded packets |
| A | 0 | 36 | 0 |
| B | 0 | 36 | 0 |
| C | 0 | 36 | 0 |
| D | 0 | 36 | 0 |
| Mode M0 | |||
|---|---|---|---|
| Quadrant | BADHDUFLAG | Total packets | Discarded packets |
| A | 0 | 36345 | 0 |
| B | 0 | 34648 | 0 |
| C | 0 | 34242 | 0 |
| D | 0 | 56126 | 0 |
| Quadrant | Total seconds | Saturated seconds | Saturation percentage |
|---|---|---|---|
| A | 15676 | 382 | 2.436846% |
| B | 15676 | 259 | 1.652207% |
| C | 15677 | 344 | 2.194297% |
| D | 15677 | 2168 | 13.829177% |
Noise dominated data is calculated using 1-second bins in cleaned event files. If a bin has >2000 counts, and if more than 50% of those come from <1% of pixels, then it is considered to be noise-dominated and hence unusable.
| Quadrant | # 1 sec bins | Bins with >0 counts | Bins with >2000 counts | High rate bins dominated by noise | Noise dominated (total time) | Noise dominated (detector-on time) | Marked lightcurve |
|---|---|---|---|---|---|---|---|
| A | 19386 | 15679 | 111 | 111 | 0.57% | 0.71% | 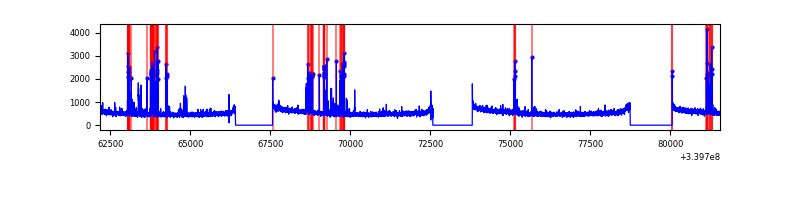 |
| B | 19386 | 15679 | 7 | 7 | 0.04% | 0.04% | 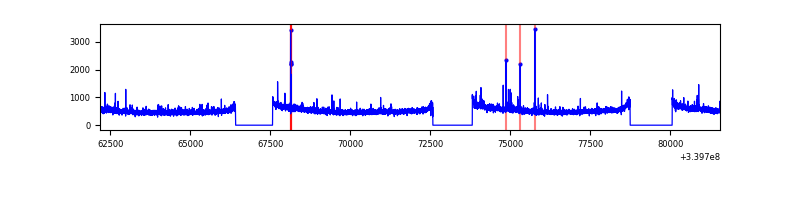 |
| C | 19387 | 15680 | 20 | 20 | 0.10% | 0.13% | 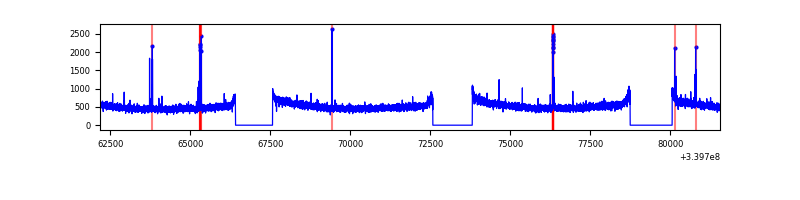 |
| D | 19387 | 15680 | 1782 | 1782 | 9.19% | 11.36% | 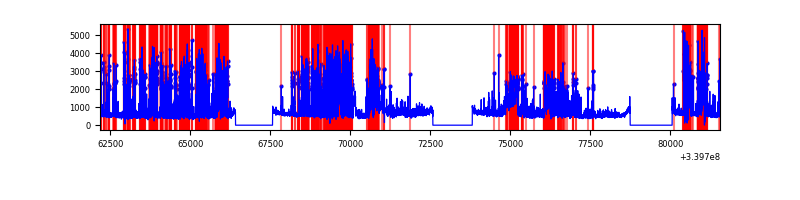 |
Top three noisy pixels from each quadrant. If the there are fewer than three noisy pixels in the level2.evt file, extra rows are filled as -1
| Pixel properties | Quadrant properties | ||||||
|---|---|---|---|---|---|---|---|
| Quadrant | DetID | PixID | Counts | Sigma | Mean | Median | Sigma |
| A | 6 | 16 | 506815 | 1203.45 | 2115 | 2079 | 419.4 |
| A | 13 | 248 | 123138 | 288.64 | 2115 | 2079 | 419.4 |
| A | 0 | 13 | 37936 | 85.49 | 2115 | 2079 | 419.4 |
| B | 0 | 190 | 78505 | 197.46 | 2088 | 2044 | 387.2 |
| B | 12 | 111 | 45466 | 112.14 | 2088 | 2044 | 387.2 |
| B | 11 | 111 | 40800 | 100.09 | 2088 | 2044 | 387.2 |
| C | 14 | 238 | 322746 | 700.9 | 1981 | 1996 | 457.6 |
| C | 15 | 208 | 64486 | 136.55 | 1981 | 1996 | 457.6 |
| C | 2 | 16 | 46981 | 98.3 | 1981 | 1996 | 457.6 |
| D | 1 | 52 | 3464204 | 7581.63 | 1903 | 1860 | 456.7 |
| D | 12 | 1 | 3220482 | 7047.94 | 1903 | 1860 | 456.7 |
| D | 7 | 38 | 806803 | 1762.61 | 1903 | 1860 | 456.7 |
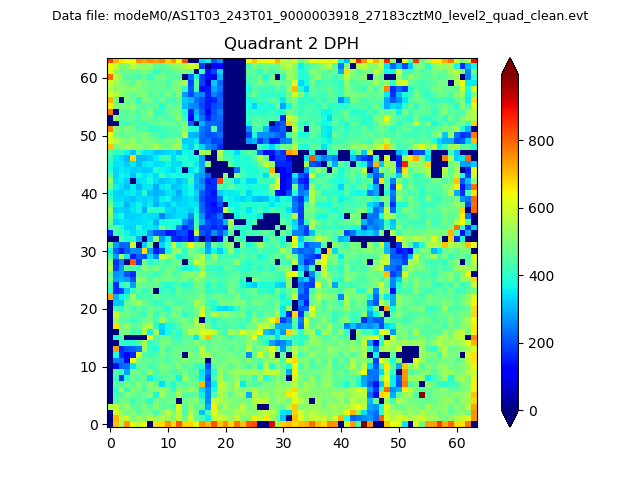
Histogram calculated using DETX and DETY for each event in the final _common_clean file
| Quadrant A | 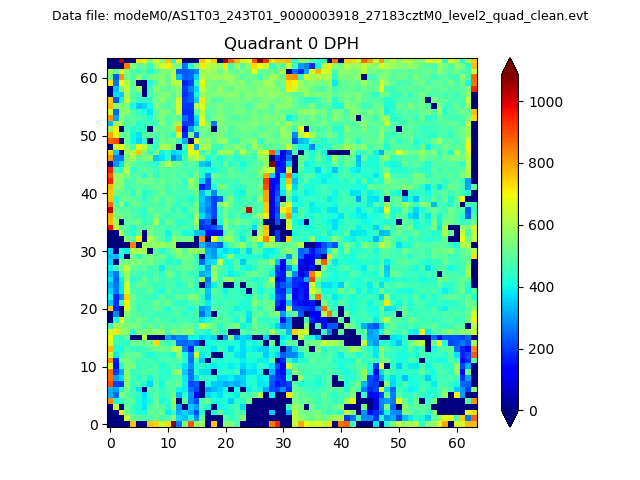 |
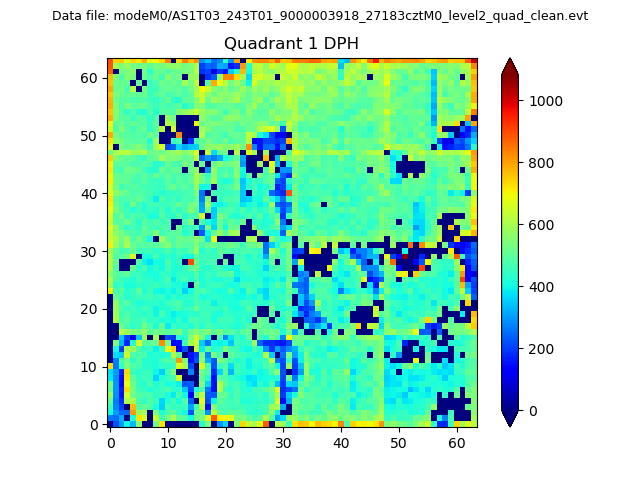 |
Quadrant B |
|---|---|---|---|
| Quadrant D | 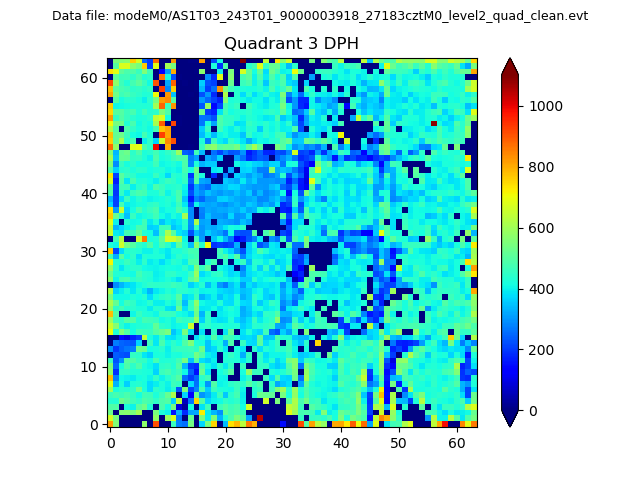 |
 |
Quadrant C |
| Plot type | Count rate plots | Images |
|---|---|---|
| Comparison with Poisson distribution Blue bars denote a histogram of data divided into 1 sec bins. Red curve is a Poisson curve with rate = median count rate of data. |
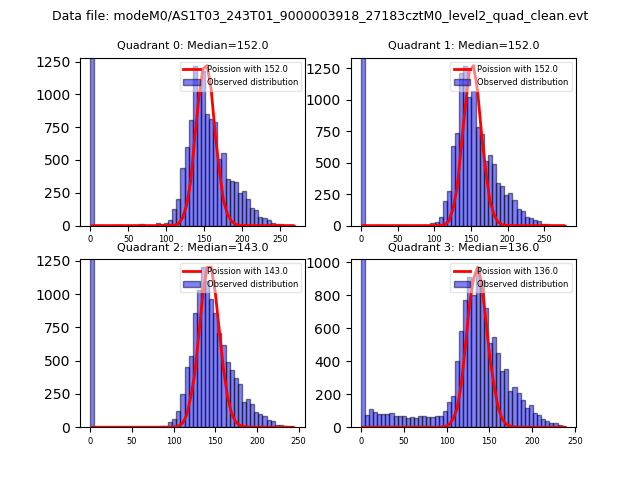 |
 |
| Quadrant-wise count rates Data is divided into 100 sec bins |
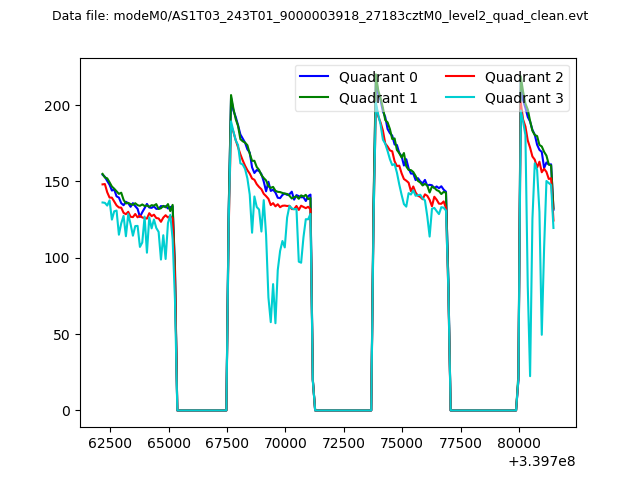 |
|
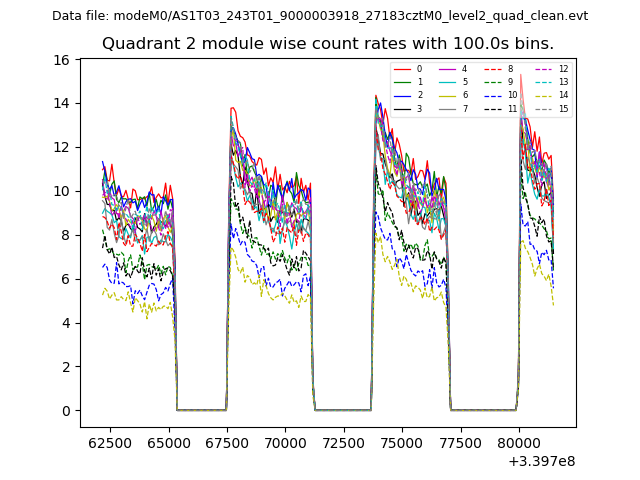
| Module-wise count rates for Quadrant A Data is divided into 100 sec bins |
 |
 |
| Module-wise count rates for Quadrant B Data is divided into 100 sec bins |
 |
 |
| Module-wise count rates for Quadrant C Data is divided into 100 sec bins |
 |
 |
| Module-wise count rates for Quadrant D Data is divided into 100 sec bins |
 |
 |
| Parameter | Plot |
|---|---|
| CZT HV Monitor | 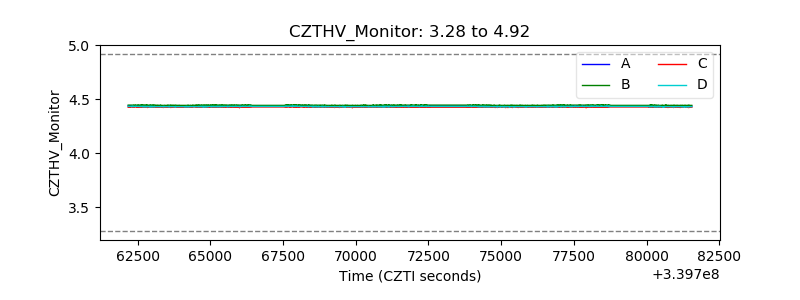 |
| D_VDD | 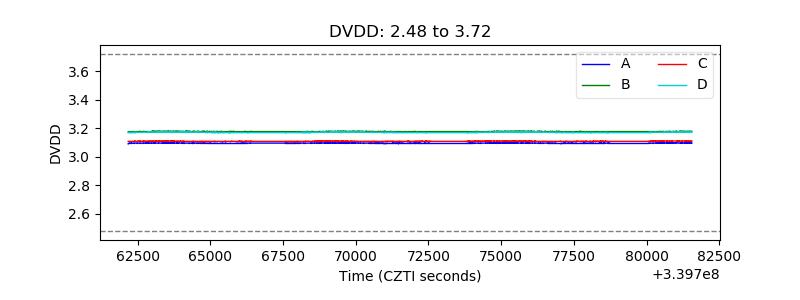 |
| Temperature 1 | 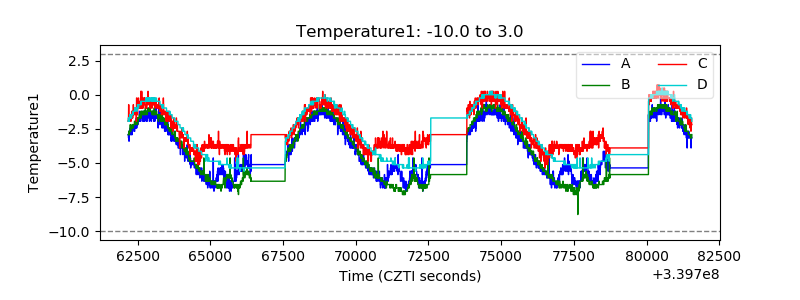 |
| Veto HV Monitor |  |
| Veto LLD | 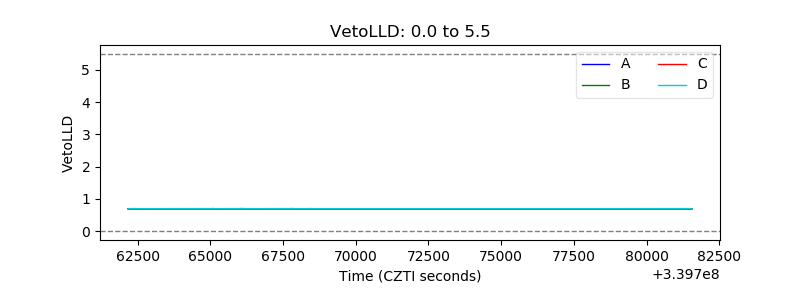 |
| Alpha Counter | 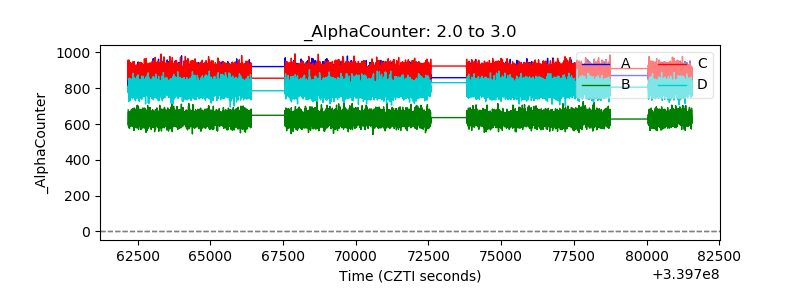 |
| _CPM_Rate | 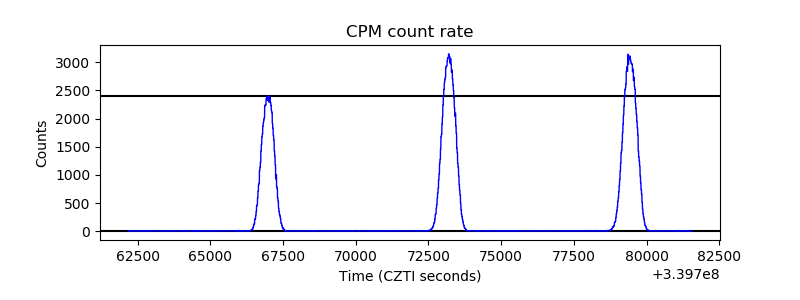 |
| CZT Counter |  |
| +2.5 Volts monitor |  |
| +5 Volts monitor |  |
| _ROLL_ROT | 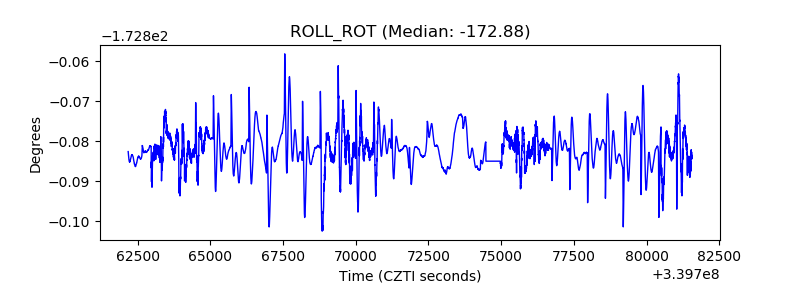 |
| _Roll_DEC |  |
| _Roll_RA |  |
| Veto Counter |  |