| Param | Original file | Final file |
|---|---|---|
| Filename | modeM0/AS1T03_243T01_9000003918_27184cztM0_level2.evt | modeM0/AS1T03_243T01_9000003918_27184cztM0_level2_quad_clean.evt |
| Size (bytes) | 521,536,320 | 100,313,280 |
| Size | 497.4 MB | 95.7 MB |
| Events in quadrant A | 3,527,804 | 686,789 |
| Events in quadrant B | 3,408,903 | 701,813 |
| Events in quadrant C | 3,327,318 | 648,791 |
| Events in quadrant D | 5,109,153 | 566,380 |
| Mode M9 | |||
|---|---|---|---|
| Quadrant | BADHDUFLAG | Total packets | Discarded packets |
| A | 0 | 17 | 0 |
| B | 0 | 18 | 0 |
| C | 0 | 18 | 0 |
| D | 0 | 18 | 0 |
| Mode M0 | |||
|---|---|---|---|
| Quadrant | BADHDUFLAG | Total packets | Discarded packets |
| A | 0 | 14413 | 0 |
| B | 0 | 13974 | 0 |
| C | 0 | 13690 | 0 |
| D | 0 | 19312 | 0 |
| Quadrant | Total seconds | Saturated seconds | Saturation percentage |
|---|---|---|---|
| A | 6220 | 101 | 1.623794% |
| B | 6220 | 62 | 0.996785% |
| C | 6220 | 95 | 1.527331% |
| D | 6220 | 590 | 9.485531% |
Noise dominated data is calculated using 1-second bins in cleaned event files. If a bin has >2000 counts, and if more than 50% of those come from <1% of pixels, then it is considered to be noise-dominated and hence unusable.
| Quadrant | # 1 sec bins | Bins with >0 counts | Bins with >2000 counts | High rate bins dominated by noise | Noise dominated (total time) | Noise dominated (detector-on time) | Marked lightcurve |
|---|---|---|---|---|---|---|---|
| A | 7585 | 6221 | 24 | 24 | 0.32% | 0.39% | 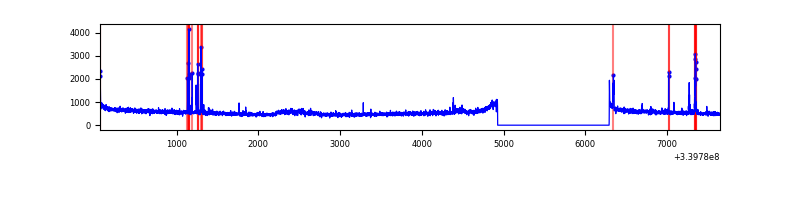 |
| B | 7585 | 6221 | 0 | 0 | 0.00% | 0.00% | 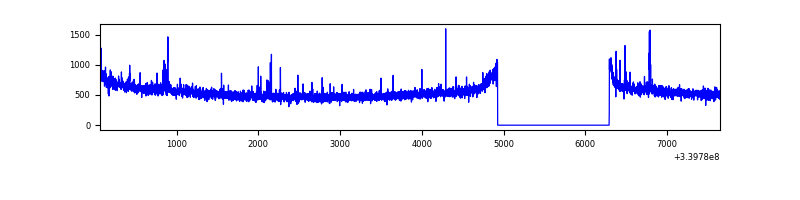 |
| C | 7585 | 6221 | 2 | 2 | 0.03% | 0.03% | 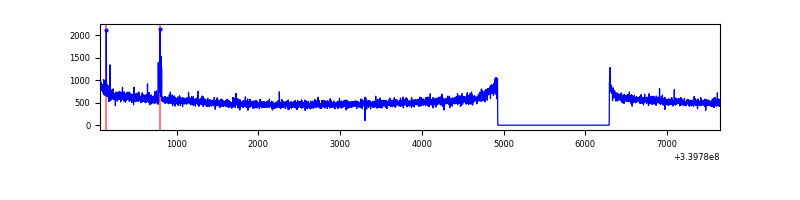 |
| D | 7585 | 6221 | 544 | 544 | 7.17% | 8.74% | 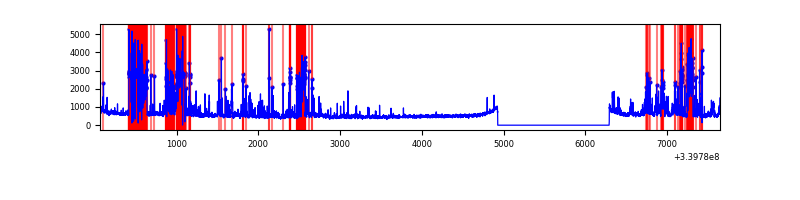 |
Top three noisy pixels from each quadrant. If the there are fewer than three noisy pixels in the level2.evt file, extra rows are filled as -1
| Pixel properties | Quadrant properties | ||||||
|---|---|---|---|---|---|---|---|
| Quadrant | DetID | PixID | Counts | Sigma | Mean | Median | Sigma |
| A | 13 | 248 | 106608 | 624.45 | 860 | 850 | 169.4 |
| A | 6 | 16 | 70643 | 412.09 | 860 | 850 | 169.4 |
| A | 15 | 174 | 19659 | 111.06 | 860 | 850 | 169.4 |
| B | 0 | 190 | 24801 | 150.48 | 854 | 838 | 159.2 |
| B | 5 | 172 | 19477 | 117.05 | 854 | 838 | 159.2 |
| B | 12 | 111 | 18232 | 109.23 | 854 | 838 | 159.2 |
| C | 14 | 238 | 130369 | 689.06 | 809 | 816 | 188.0 |
| C | 0 | 207 | 34982 | 181.72 | 809 | 816 | 188.0 |
| C | 15 | 208 | 7037 | 33.09 | 809 | 816 | 188.0 |
| D | 1 | 52 | 1701550 | 8384.62 | 766 | 752 | 202.8 |
| D | 7 | 38 | 255412 | 1255.42 | 766 | 752 | 202.8 |
| D | 2 | 250 | 190148 | 933.69 | 766 | 752 | 202.8 |
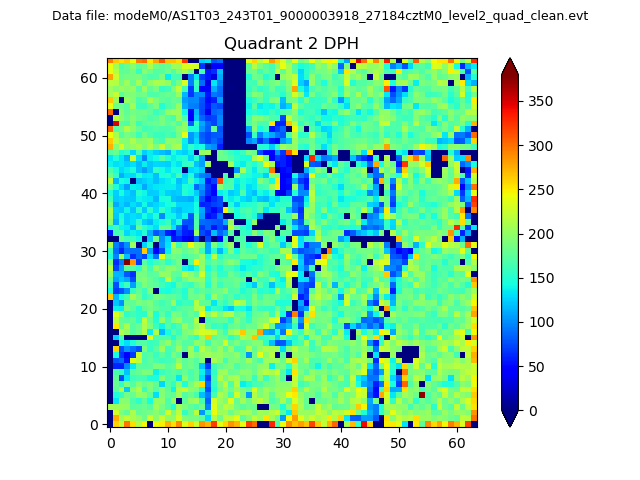
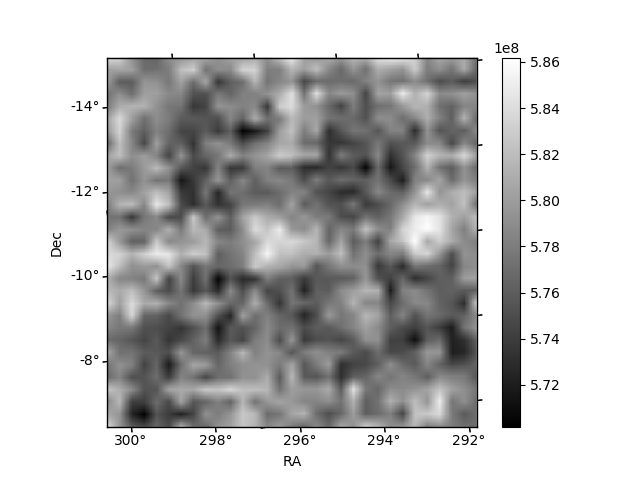
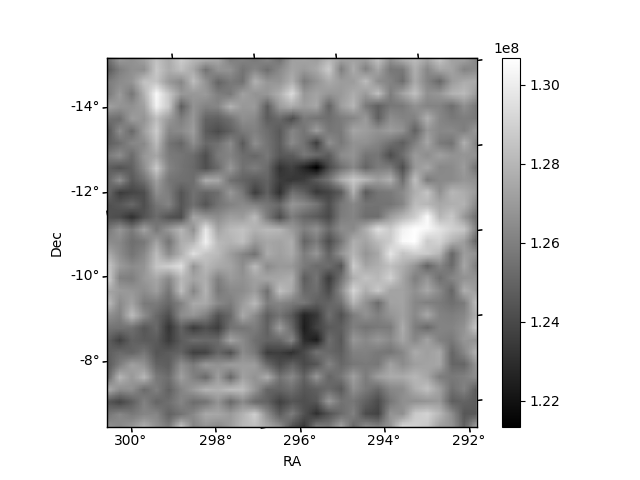
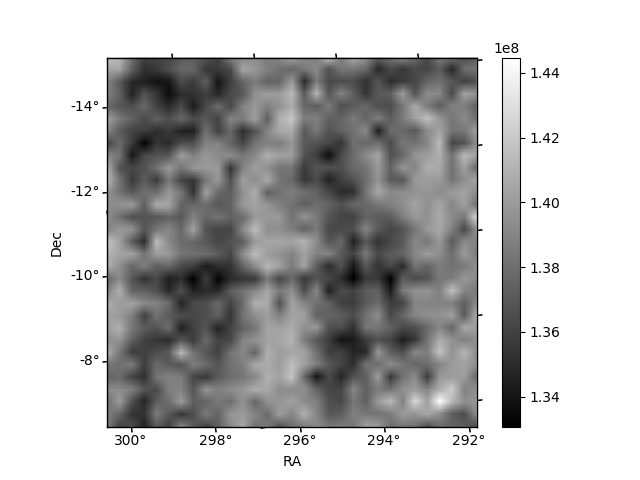
Histogram calculated using DETX and DETY for each event in the final _common_clean file
| Quadrant A | 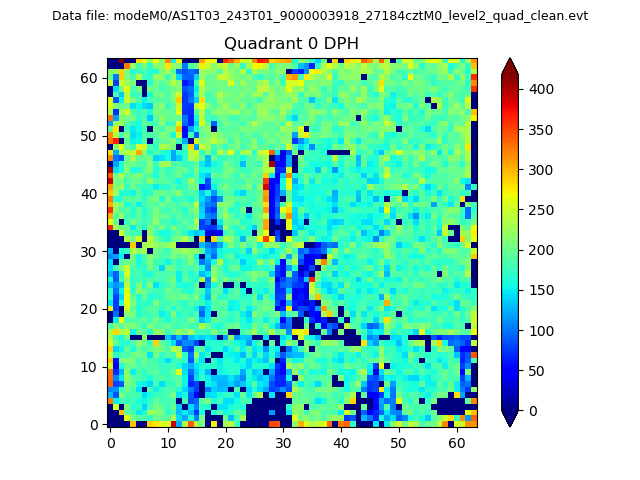 |
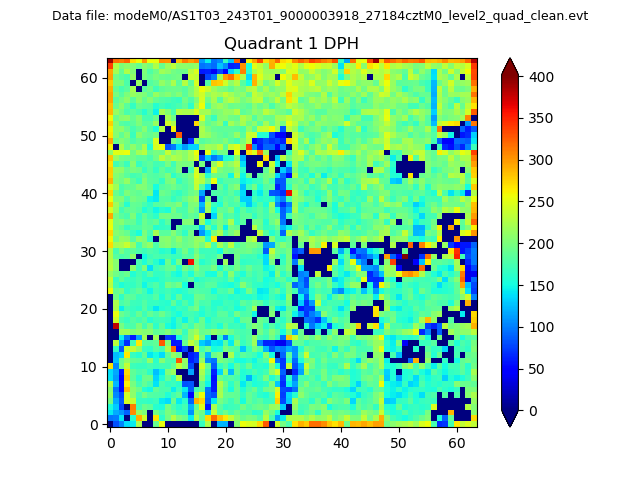 |
Quadrant B |
|---|---|---|---|
| Quadrant D | 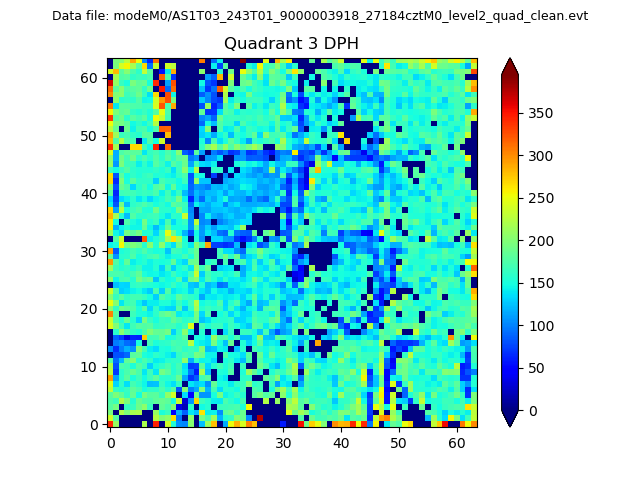 |
 |
Quadrant C |
| Plot type | Count rate plots | Images |
|---|---|---|
| Comparison with Poisson distribution Blue bars denote a histogram of data divided into 1 sec bins. Red curve is a Poisson curve with rate = median count rate of data. |
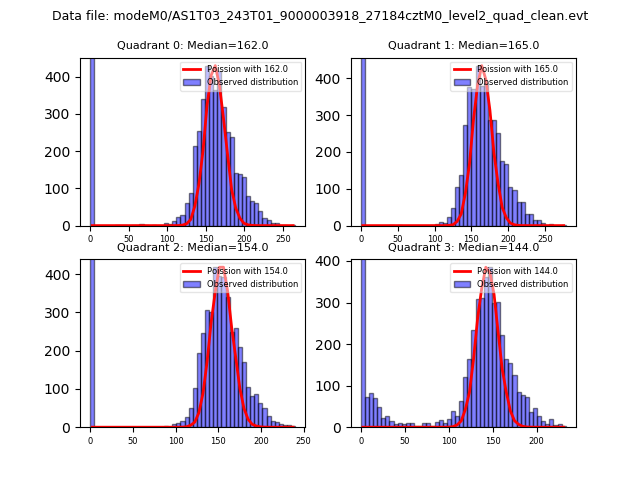 |
 |
| Quadrant-wise count rates Data is divided into 100 sec bins |
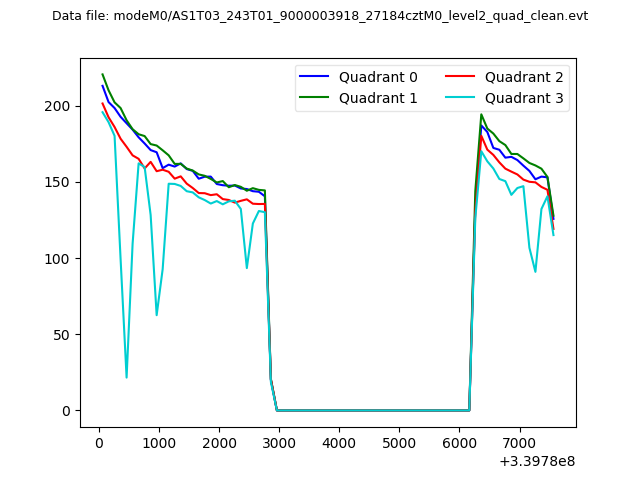 |
|
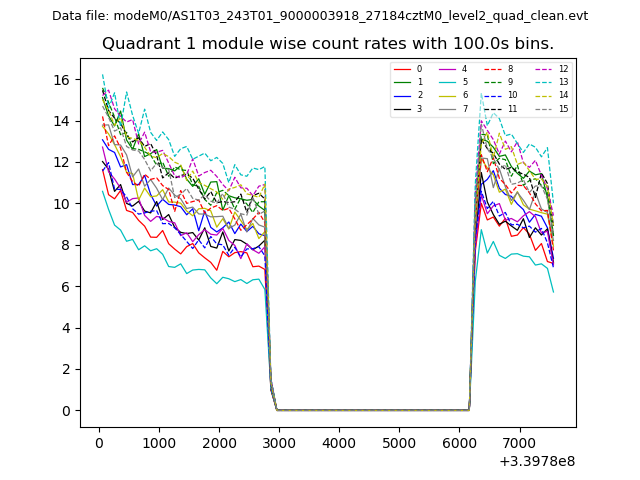
| Module-wise count rates for Quadrant A Data is divided into 100 sec bins |
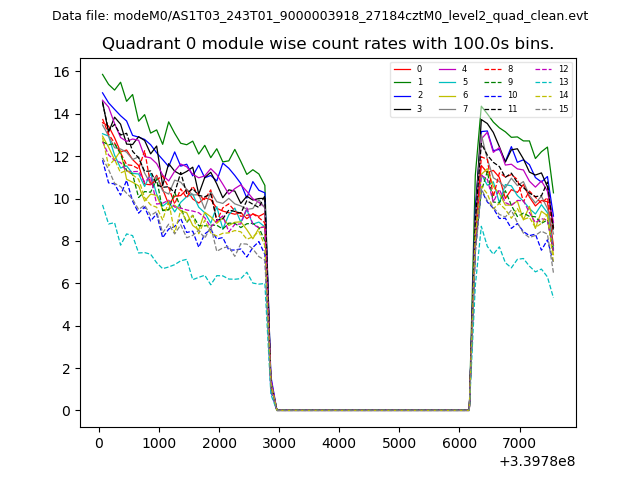 |
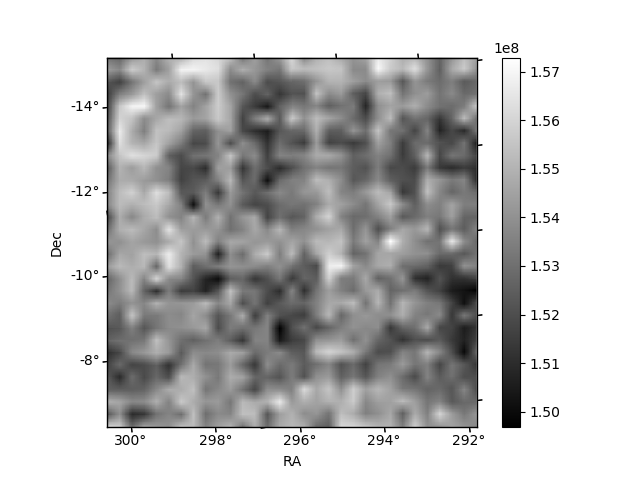 |
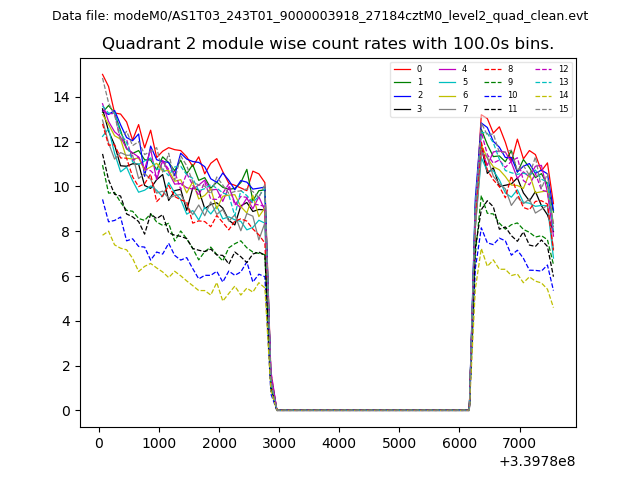
| Module-wise count rates for Quadrant B Data is divided into 100 sec bins |
 |
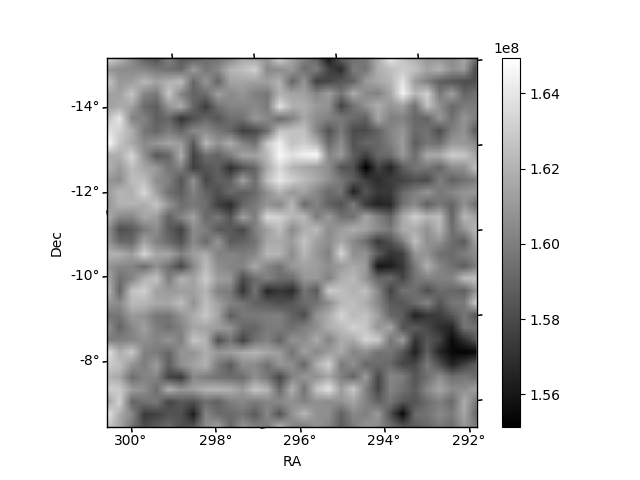 |
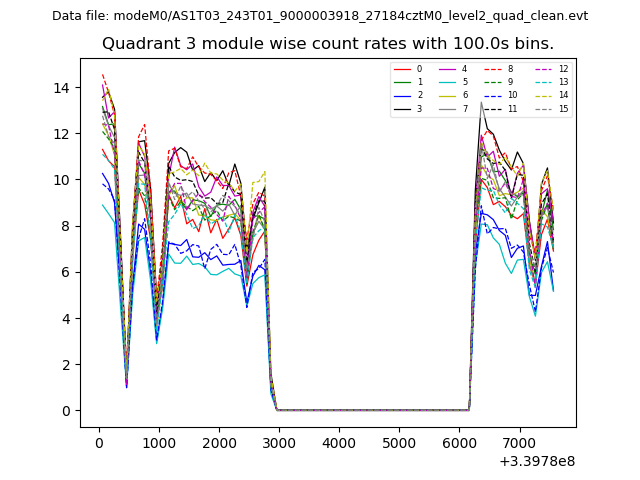
| Module-wise count rates for Quadrant C Data is divided into 100 sec bins |
 |
 |
| Module-wise count rates for Quadrant D Data is divided into 100 sec bins |
 |
 |
| Parameter | Plot |
|---|---|
| CZT HV Monitor | 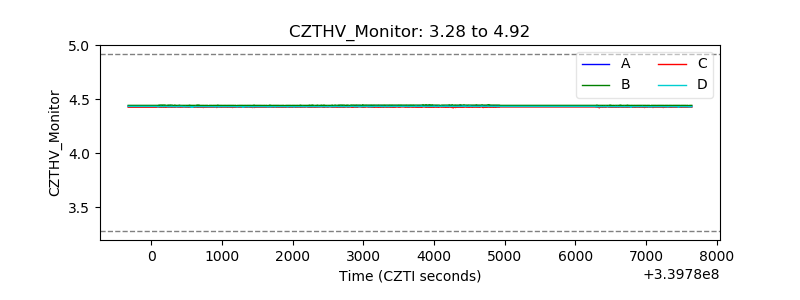 |
| D_VDD | 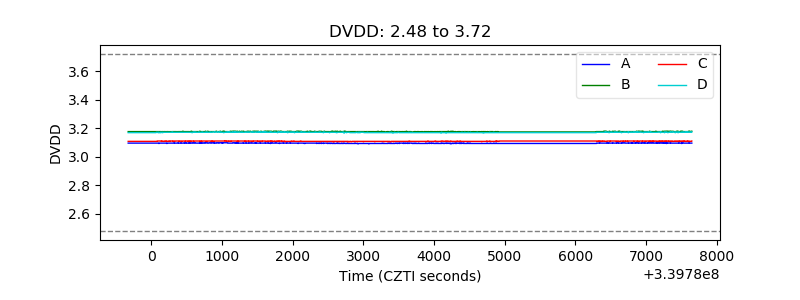 |
| Temperature 1 | 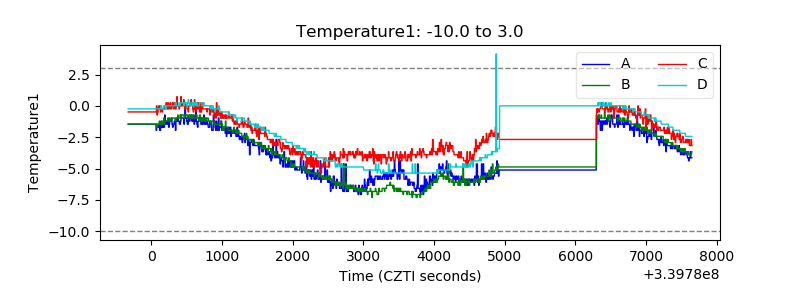 |
| Veto HV Monitor |  |
| Veto LLD | 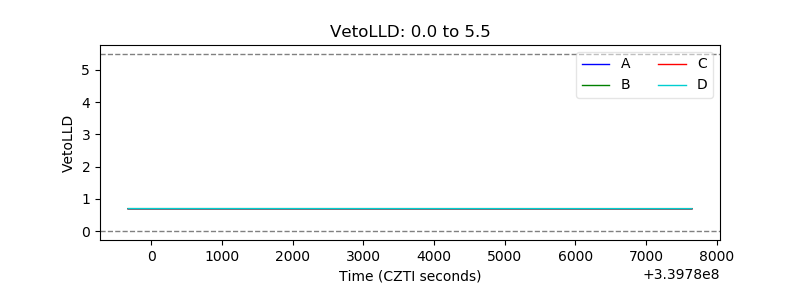 |
| Alpha Counter | 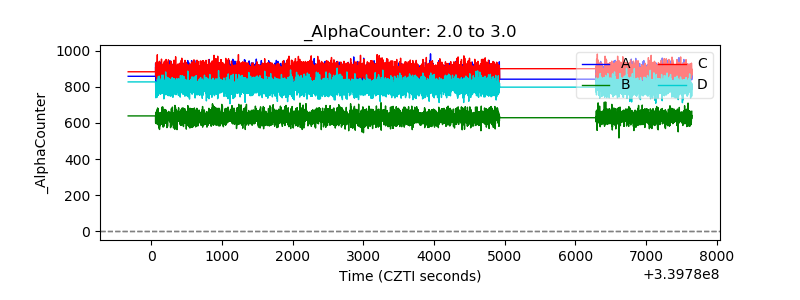 |
| _CPM_Rate | 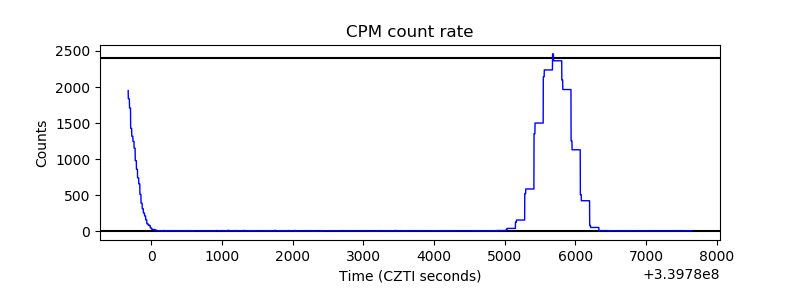 |
| CZT Counter | 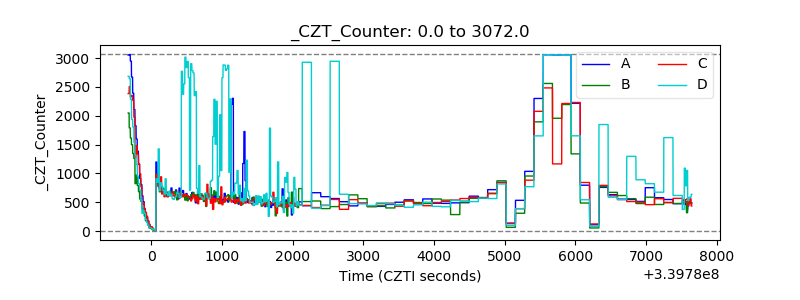 |
| +2.5 Volts monitor |  |
| +5 Volts monitor | 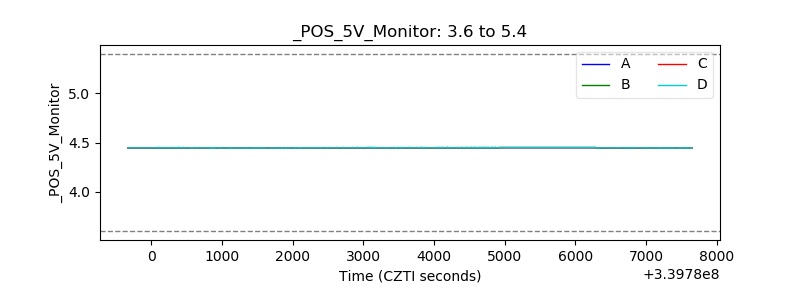 |
| _ROLL_ROT | 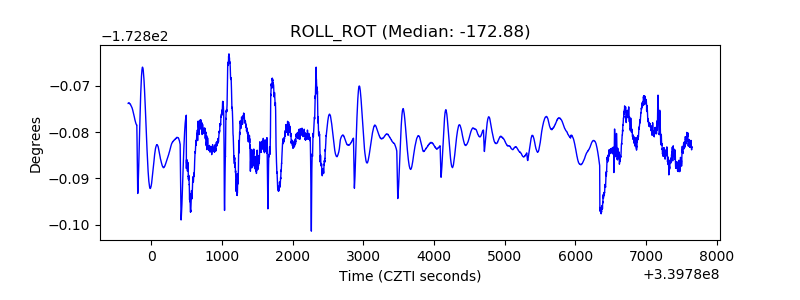 |
| _Roll_DEC | 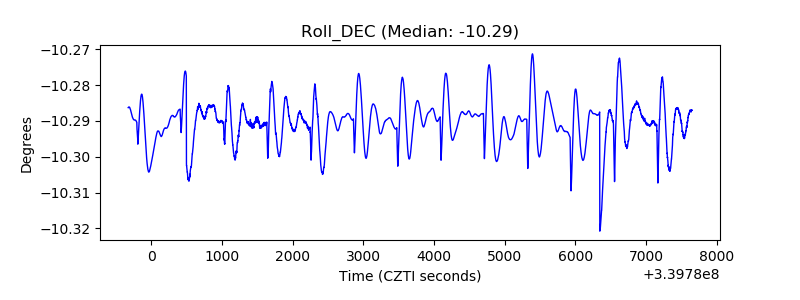 |
| _Roll_RA | 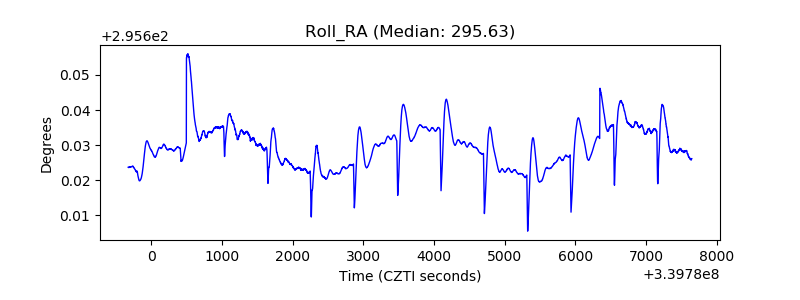 |
| Veto Counter | 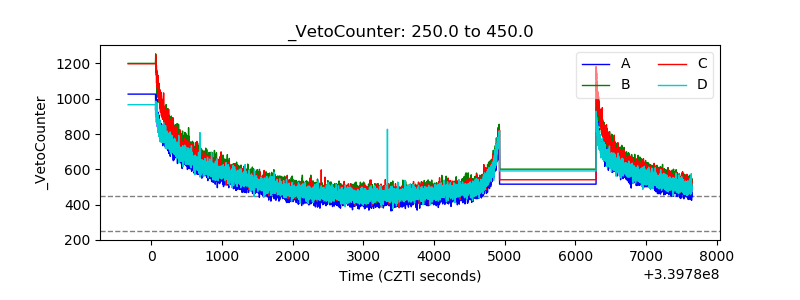 |