| Param | Original file | Final file |
|---|---|---|
| Filename | modeM0/AS1T03_243T01_9000003918_27185cztM0_level2.evt | modeM0/AS1T03_243T01_9000003918_27185cztM0_level2_quad_clean.evt |
| Size (bytes) | 512,424,000 | 91,514,880 |
| Size | 488.7 MB | 87.3 MB |
| Events in quadrant A | 3,279,447 | 607,604 |
| Events in quadrant B | 3,295,460 | 625,478 |
| Events in quadrant C | 3,181,677 | 580,529 |
| Events in quadrant D | 5,340,625 | 523,680 |
| Mode M9 | |||
|---|---|---|---|
| Quadrant | BADHDUFLAG | Total packets | Discarded packets |
| A | 0 | 18 | 0 |
| B | 0 | 19 | 0 |
| C | 0 | 19 | 0 |
| D | 0 | 19 | 0 |
| Mode M0 | |||
|---|---|---|---|
| Quadrant | BADHDUFLAG | Total packets | Discarded packets |
| A | 0 | 13660 | 0 |
| B | 0 | 13583 | 0 |
| C | 0 | 13236 | 0 |
| D | 0 | 20013 | 0 |
| Quadrant | Total seconds | Saturated seconds | Saturation percentage |
|---|---|---|---|
| A | 6218 | 59 | 0.948858% |
| B | 6218 | 48 | 0.771952% |
| C | 6218 | 58 | 0.932776% |
| D | 6218 | 615 | 9.890640% |
Noise dominated data is calculated using 1-second bins in cleaned event files. If a bin has >2000 counts, and if more than 50% of those come from <1% of pixels, then it is considered to be noise-dominated and hence unusable.
| Quadrant | # 1 sec bins | Bins with >0 counts | Bins with >2000 counts | High rate bins dominated by noise | Noise dominated (total time) | Noise dominated (detector-on time) | Marked lightcurve |
|---|---|---|---|---|---|---|---|
| A | 7528 | 6219 | 11 | 11 | 0.15% | 0.18% | 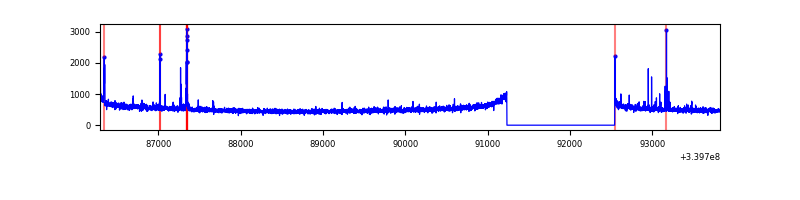 |
| B | 7528 | 6219 | 0 | 0 | 0.00% | 0.00% | 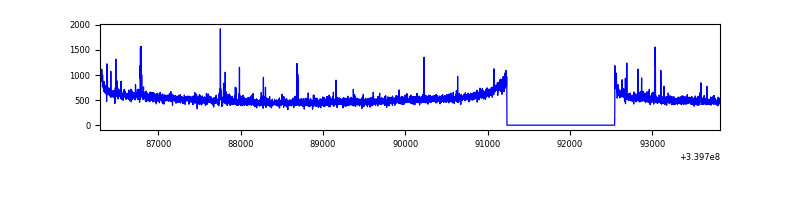 |
| C | 7528 | 6219 | 0 | 0 | 0.00% | 0.00% | 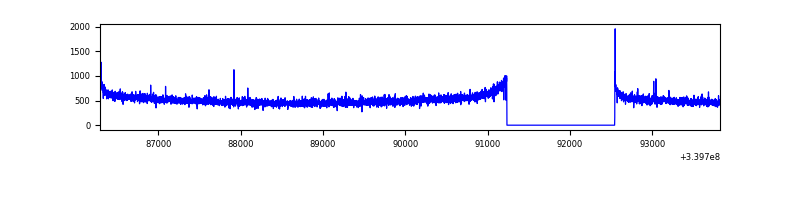 |
| D | 7528 | 6219 | 639 | 639 | 8.49% | 10.27% | 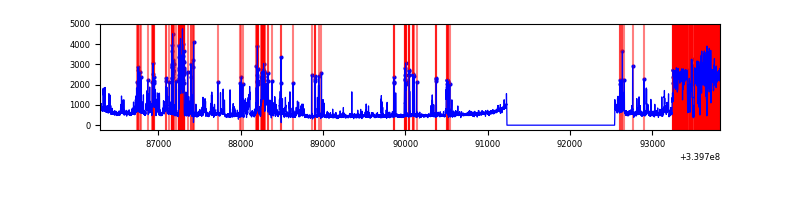 |
Top three noisy pixels from each quadrant. If the there are fewer than three noisy pixels in the level2.evt file, extra rows are filled as -1
| Pixel properties | Quadrant properties | ||||||
|---|---|---|---|---|---|---|---|
| Quadrant | DetID | PixID | Counts | Sigma | Mean | Median | Sigma |
| A | 13 | 248 | 67328 | 406.46 | 823 | 811 | 163.7 |
| A | 15 | 174 | 19836 | 116.25 | 823 | 811 | 163.7 |
| A | 8 | 192 | 13307 | 76.36 | 823 | 811 | 163.7 |
| B | 5 | 172 | 26772 | 167.63 | 822 | 805 | 154.9 |
| B | 0 | 190 | 19918 | 123.38 | 822 | 805 | 154.9 |
| B | 12 | 111 | 17964 | 110.77 | 822 | 805 | 154.9 |
| C | 14 | 238 | 125751 | 685.34 | 781 | 788 | 182.3 |
| C | 13 | 61 | 5428 | 25.45 | 781 | 788 | 182.3 |
| C | 15 | 208 | 5323 | 24.87 | 781 | 788 | 182.3 |
| D | 1 | 52 | 1713323 | 8631.42 | 754 | 740 | 198.4 |
| D | 7 | 38 | 558668 | 2811.96 | 754 | 740 | 198.4 |
| D | 2 | 250 | 125867 | 630.64 | 754 | 740 | 198.4 |
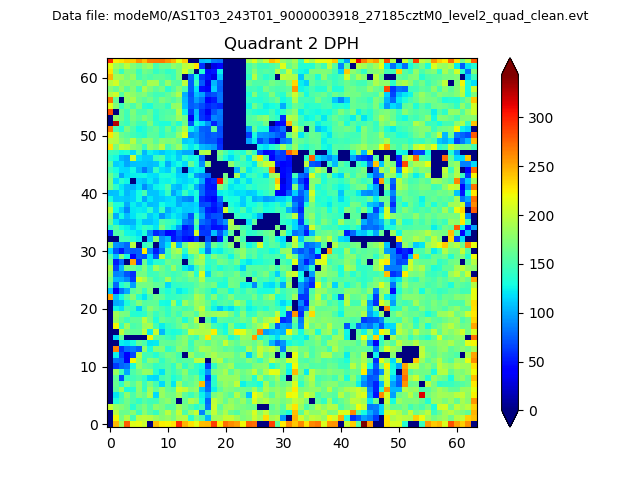
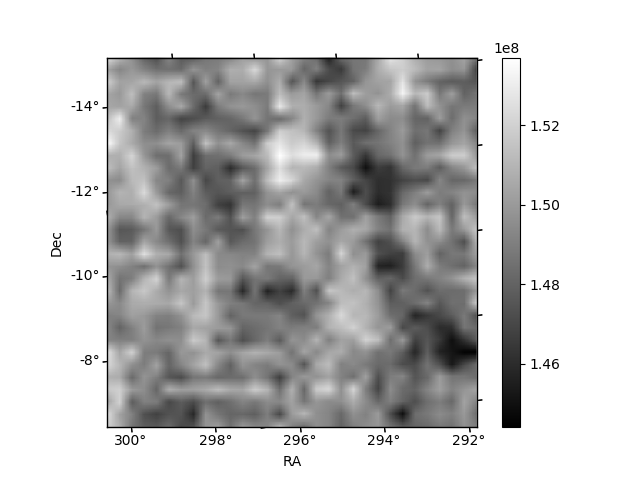
Histogram calculated using DETX and DETY for each event in the final _common_clean file
| Quadrant A | 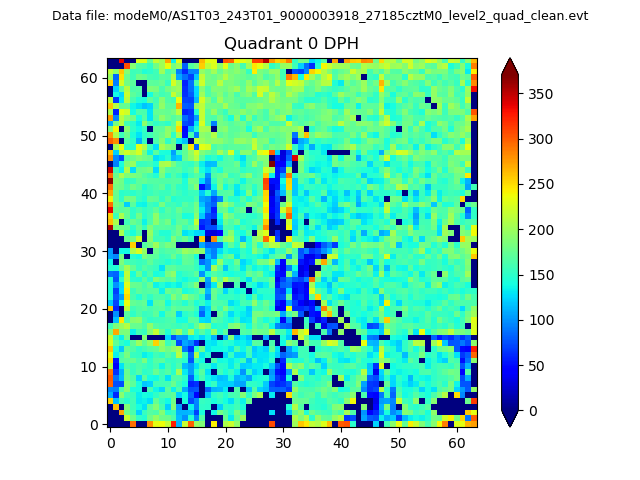 |
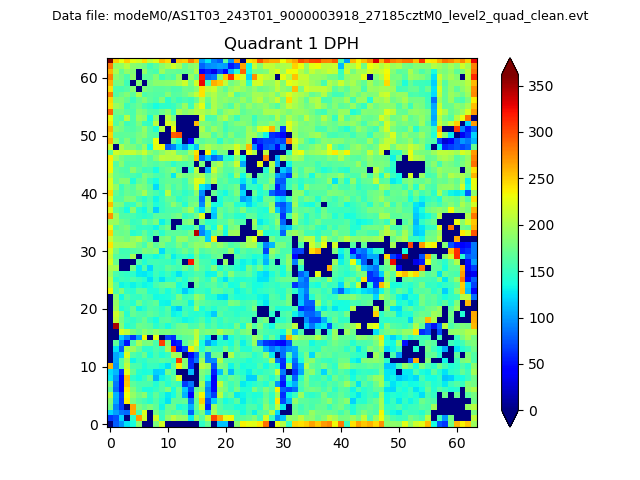 |
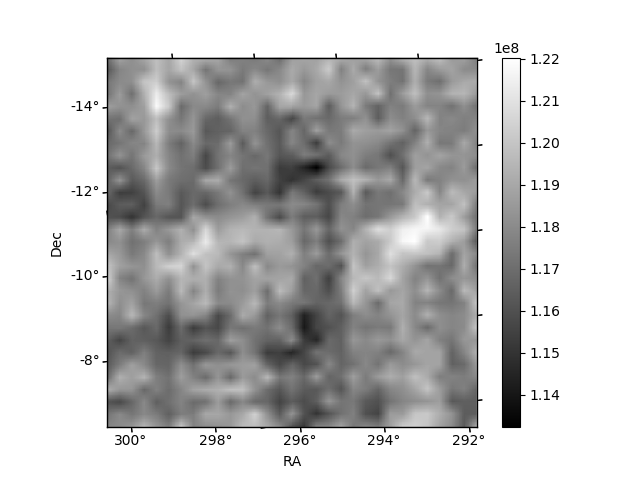
Quadrant B |
|---|---|---|---|
| Quadrant D | 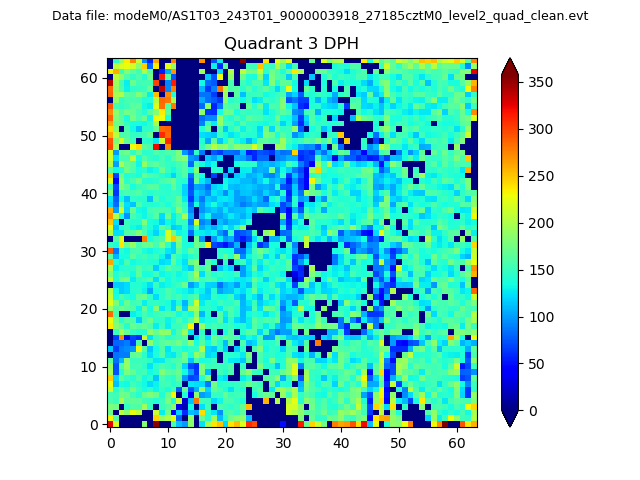 |
 |
Quadrant C |
| Plot type | Count rate plots | Images |
|---|---|---|
| Comparison with Poisson distribution Blue bars denote a histogram of data divided into 1 sec bins. Red curve is a Poisson curve with rate = median count rate of data. |
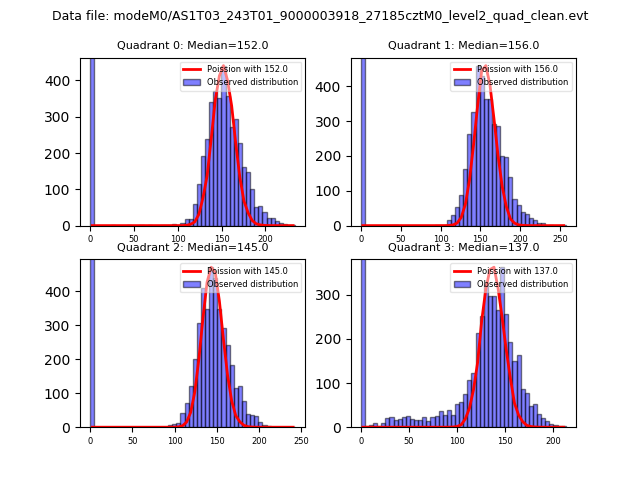 |
 |
| Quadrant-wise count rates Data is divided into 100 sec bins |
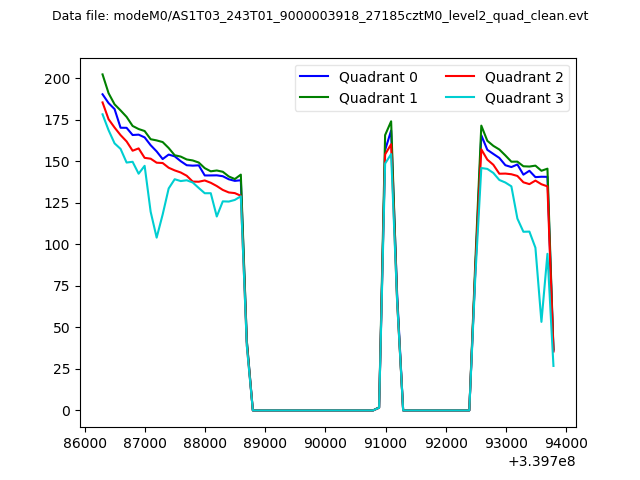 |
|
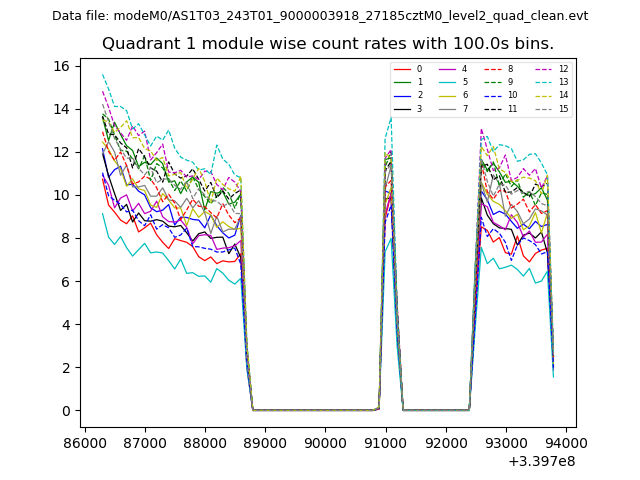
| Module-wise count rates for Quadrant A Data is divided into 100 sec bins |
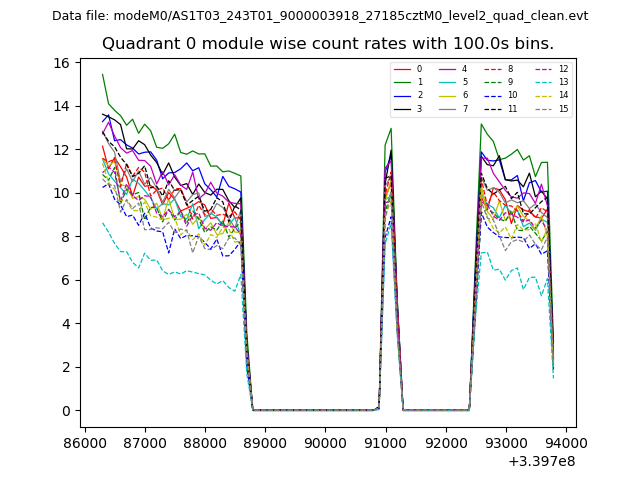 |
 |
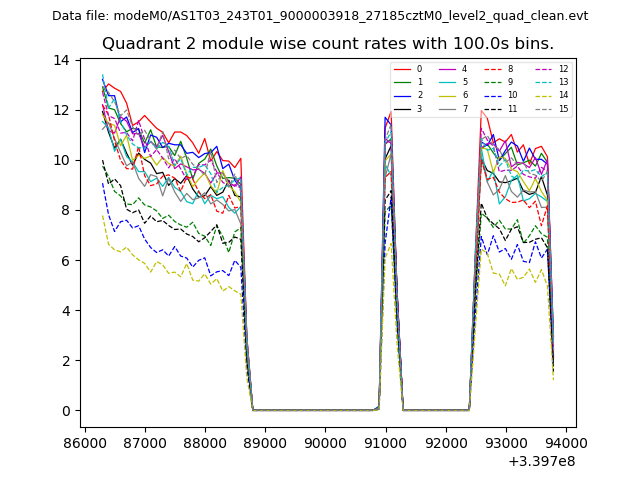
| Module-wise count rates for Quadrant B Data is divided into 100 sec bins |
 |
 |
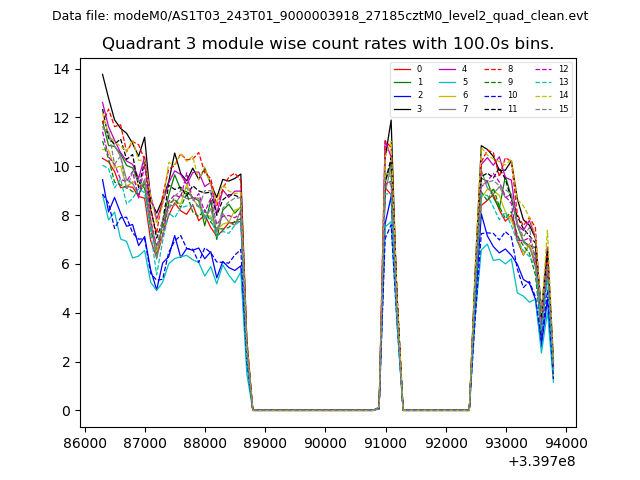
| Module-wise count rates for Quadrant C Data is divided into 100 sec bins |
 |
 |
| Module-wise count rates for Quadrant D Data is divided into 100 sec bins |
 |
 |
| Parameter | Plot |
|---|---|
| CZT HV Monitor | 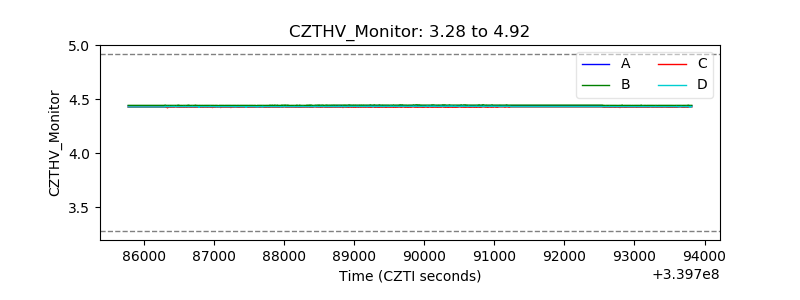 |
| D_VDD | 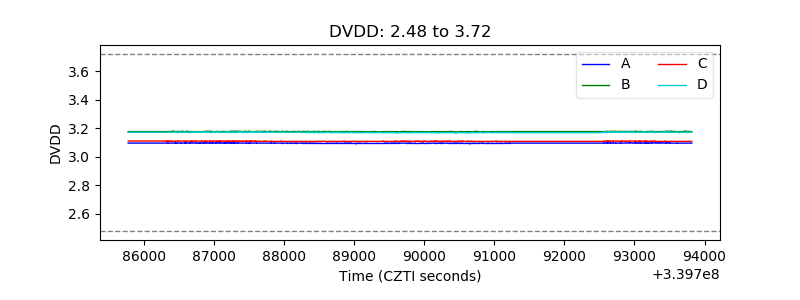 |
| Temperature 1 | 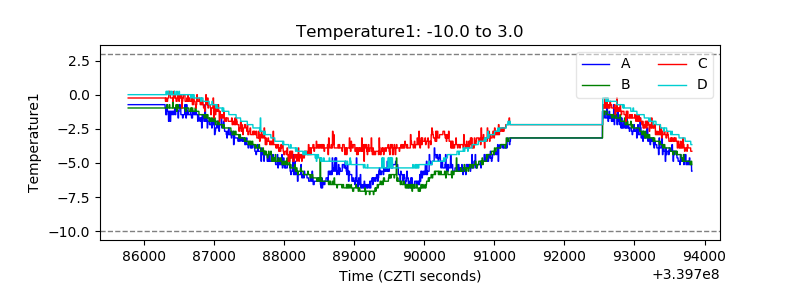 |
| Veto HV Monitor | 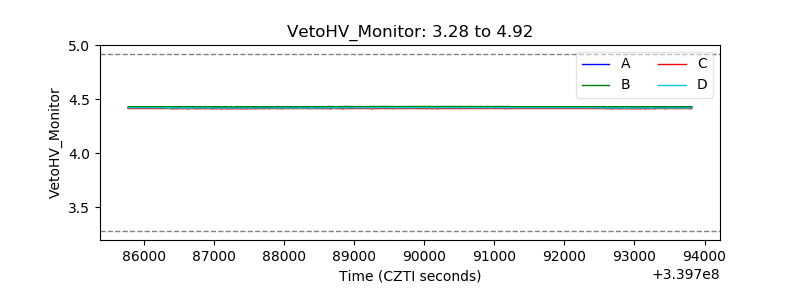 |
| Veto LLD | 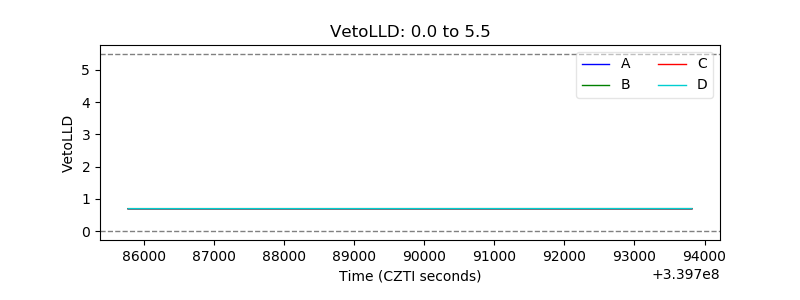 |
| Alpha Counter | 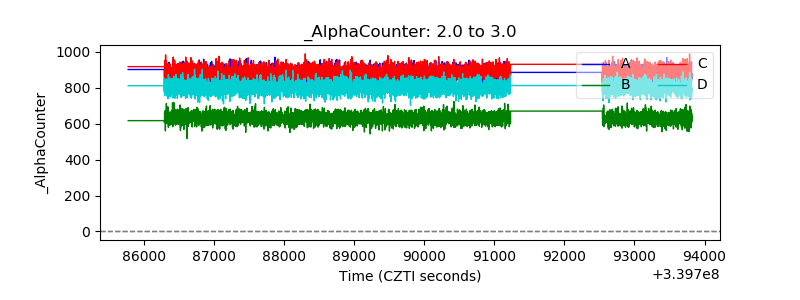 |
| _CPM_Rate | 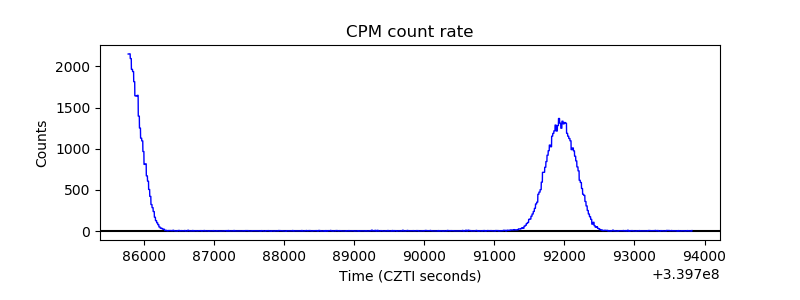 |
| CZT Counter |  |
| +2.5 Volts monitor |  |
| +5 Volts monitor |  |
| _ROLL_ROT | 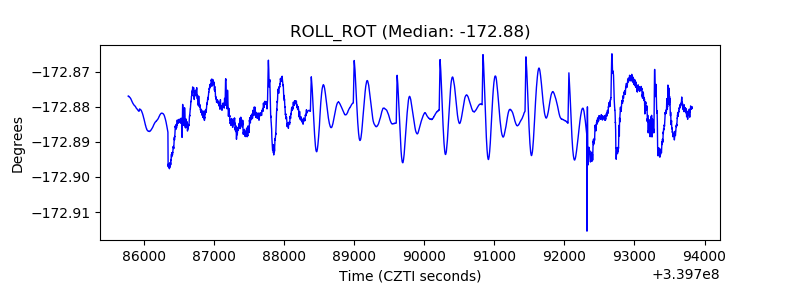 |
| _Roll_DEC |  |
| _Roll_RA | 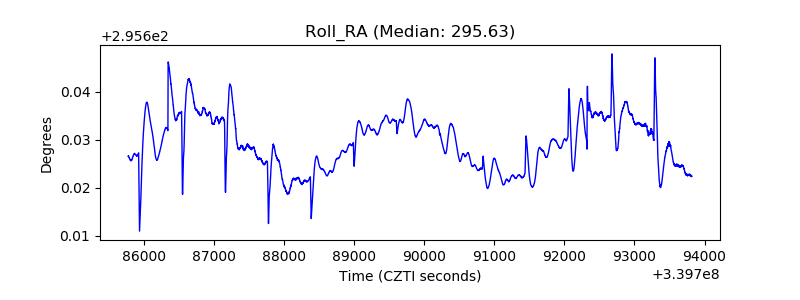 |
| Veto Counter | 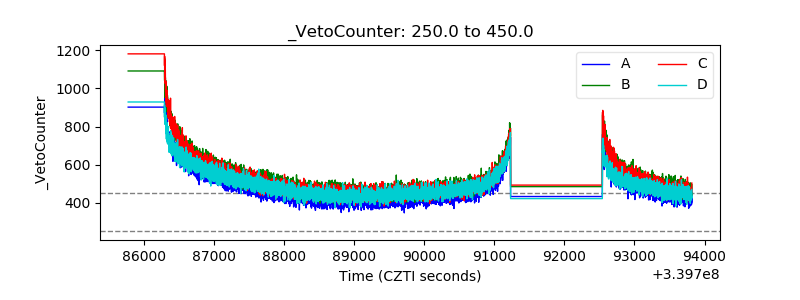 |