| Param | Original file | Final file |
|---|---|---|
| Filename | modeM0/AS1T03_243T01_9000003918_27186cztM0_level2.evt | modeM0/AS1T03_243T01_9000003918_27186cztM0_level2_quad_clean.evt |
| Size (bytes) | 712,175,040 | 92,594,880 |
| Size | 679.2 MB | 88.3 MB |
| Events in quadrant A | 3,327,672 | 616,769 |
| Events in quadrant B | 3,449,262 | 631,575 |
| Events in quadrant C | 3,270,742 | 594,902 |
| Events in quadrant D | 11,073,505 | 498,897 |
| Mode M9 | |||
|---|---|---|---|
| Quadrant | BADHDUFLAG | Total packets | Discarded packets |
| A | 0 | 16 | 0 |
| B | 0 | 17 | 0 |
| C | 0 | 17 | 0 |
| D | 0 | 17 | 0 |
| Mode M0 | |||
|---|---|---|---|
| Quadrant | BADHDUFLAG | Total packets | Discarded packets |
| A | 0 | 14097 | 0 |
| B | 0 | 14333 | 0 |
| C | 0 | 13836 | 0 |
| D | 0 | 37451 | 0 |
| Quadrant | Total seconds | Saturated seconds | Saturation percentage |
|---|---|---|---|
| A | 6610 | 45 | 0.680787% |
| B | 6610 | 67 | 1.013616% |
| C | 6610 | 70 | 1.059002% |
| D | 6609 | 2424 | 36.677258% |
Noise dominated data is calculated using 1-second bins in cleaned event files. If a bin has >2000 counts, and if more than 50% of those come from <1% of pixels, then it is considered to be noise-dominated and hence unusable.
| Quadrant | # 1 sec bins | Bins with >0 counts | Bins with >2000 counts | High rate bins dominated by noise | Noise dominated (total time) | Noise dominated (detector-on time) | Marked lightcurve |
|---|---|---|---|---|---|---|---|
| A | 7570 | 6611 | 3 | 3 | 0.04% | 0.05% | 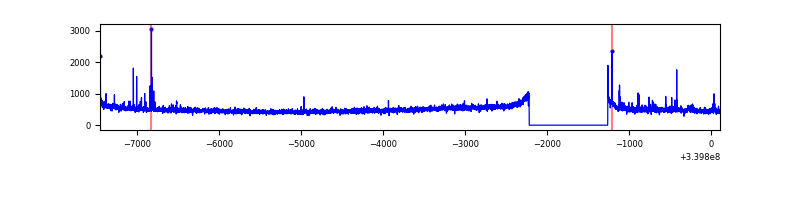 |
| B | 7570 | 6611 | 3 | 3 | 0.04% | 0.05% | 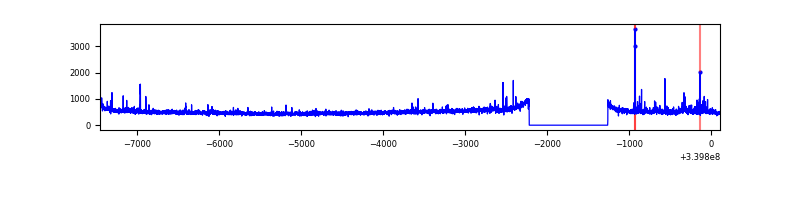 |
| C | 7570 | 6611 | 0 | 0 | 0.00% | 0.00% | 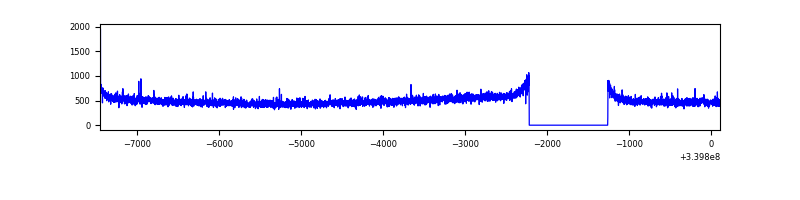 |
| D | 7569 | 6610 | 2552 | 2552 | 33.72% | 38.61% | 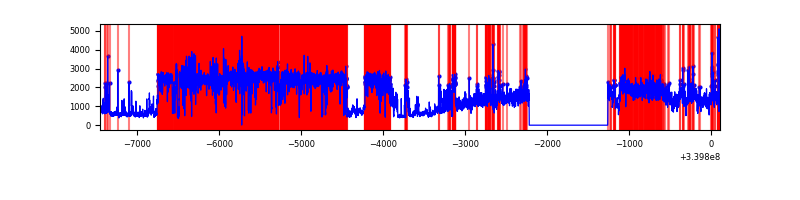 |
Top three noisy pixels from each quadrant. If the there are fewer than three noisy pixels in the level2.evt file, extra rows are filled as -1
| Pixel properties | Quadrant properties | ||||||
|---|---|---|---|---|---|---|---|
| Quadrant | DetID | PixID | Counts | Sigma | Mean | Median | Sigma |
| A | 13 | 248 | 33175 | 192.43 | 839 | 824 | 168.1 |
| A | 15 | 174 | 20082 | 114.55 | 839 | 824 | 168.1 |
| A | 6 | 16 | 14780 | 83.01 | 839 | 824 | 168.1 |
| B | 3 | 112 | 81405 | 503.61 | 839 | 817 | 160.0 |
| B | 5 | 172 | 30410 | 184.93 | 839 | 817 | 160.0 |
| B | 0 | 190 | 22954 | 138.34 | 839 | 817 | 160.0 |
| C | 14 | 238 | 127799 | 676.15 | 801 | 808 | 187.8 |
| C | 2 | 16 | 9731 | 47.51 | 801 | 808 | 187.8 |
| C | 15 | 208 | 6472 | 30.16 | 801 | 808 | 187.8 |
| D | 1 | 52 | 7874917 | 45288.01 | 729 | 710 | 173.9 |
| D | 2 | 250 | 136715 | 782.22 | 729 | 710 | 173.9 |
| D | 7 | 38 | 108753 | 621.4 | 729 | 710 | 173.9 |
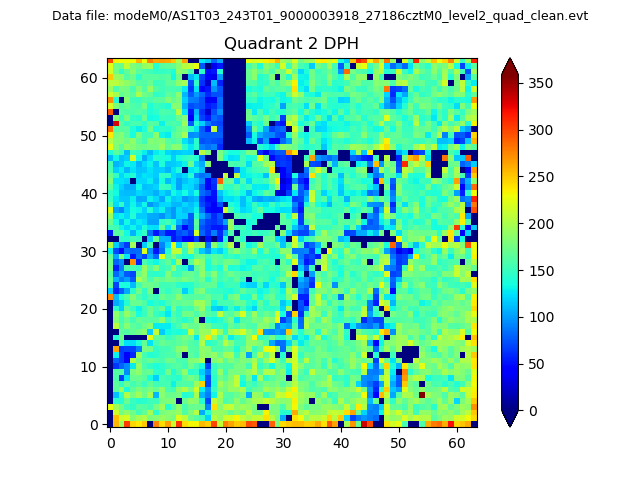
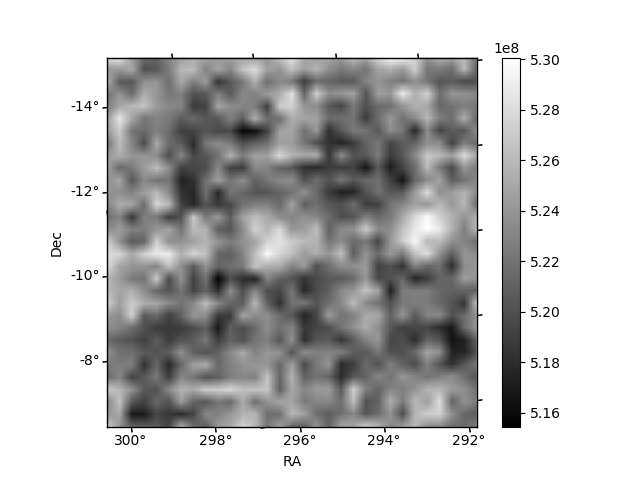
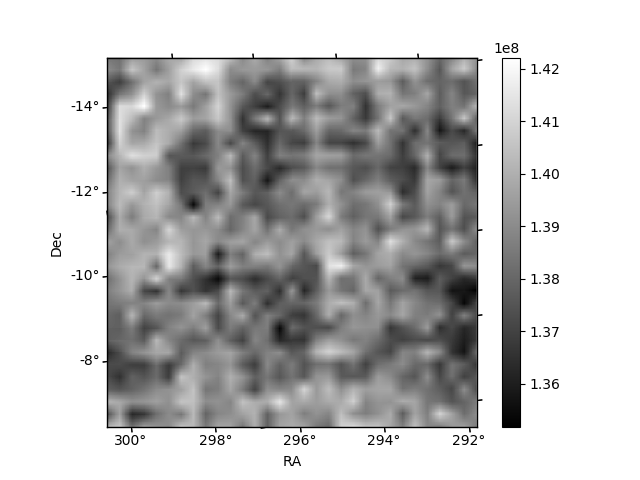
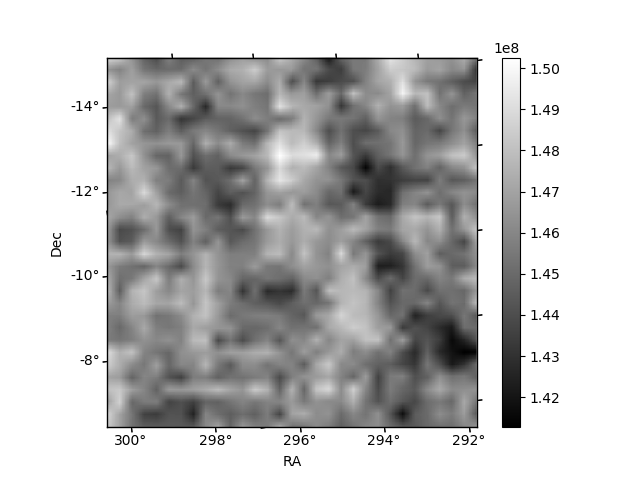
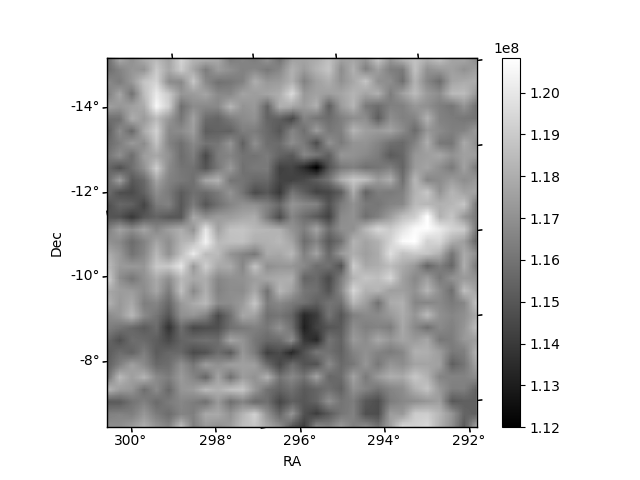
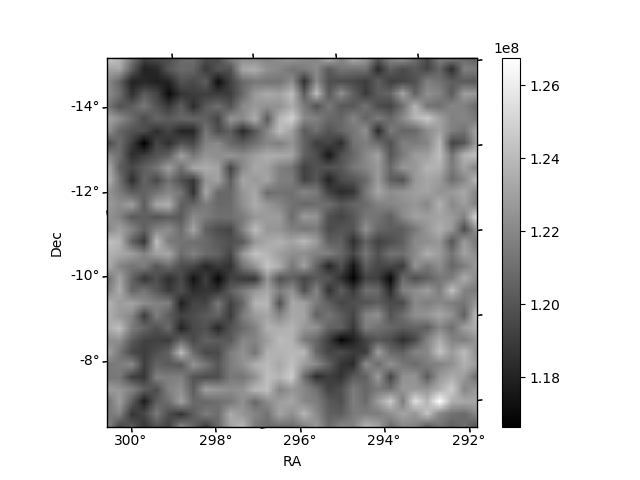
Histogram calculated using DETX and DETY for each event in the final _common_clean file
| Quadrant A | 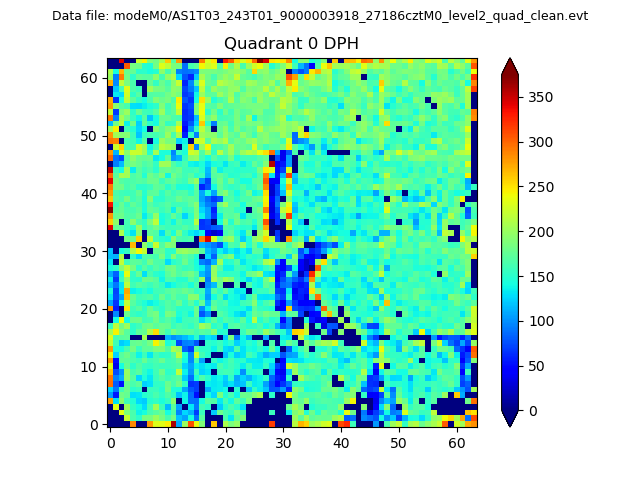 |
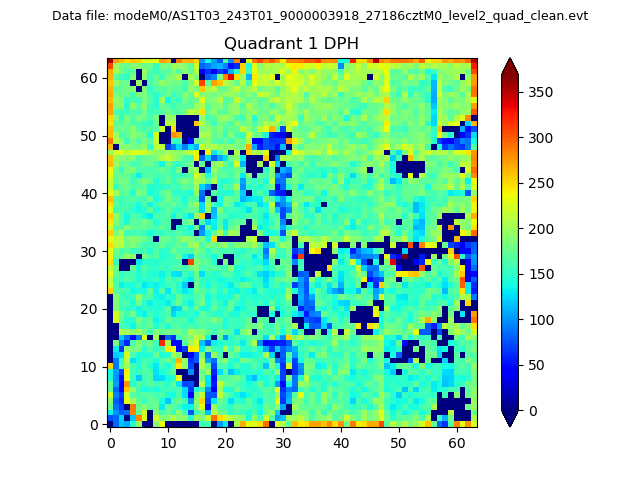 |
Quadrant B |
|---|---|---|---|
| Quadrant D | 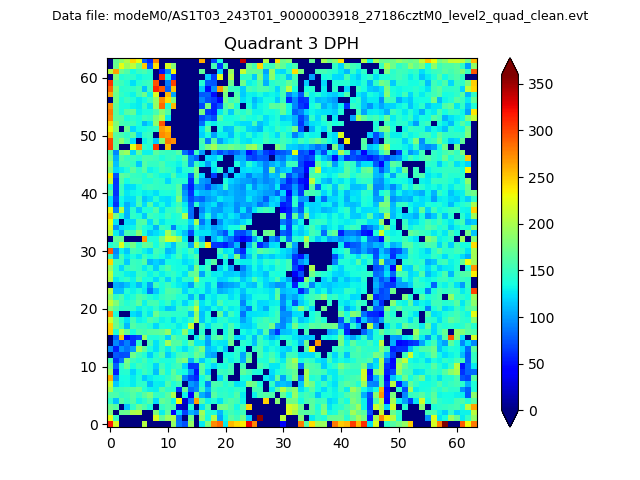 |
 |
Quadrant C |
| Plot type | Count rate plots | Images |
|---|---|---|
| Comparison with Poisson distribution Blue bars denote a histogram of data divided into 1 sec bins. Red curve is a Poisson curve with rate = median count rate of data. |
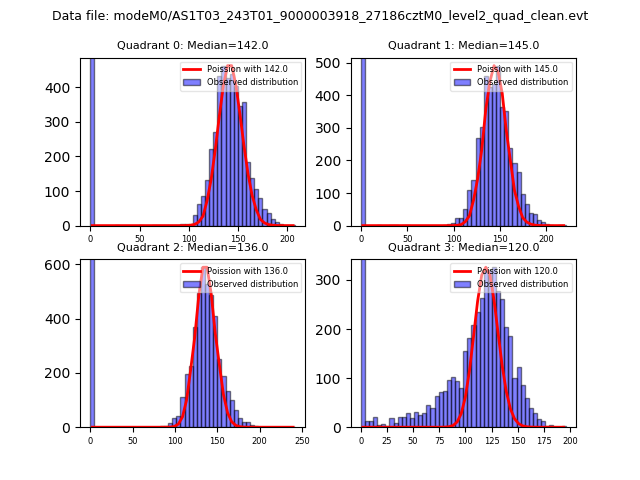 |
 |
| Quadrant-wise count rates Data is divided into 100 sec bins |
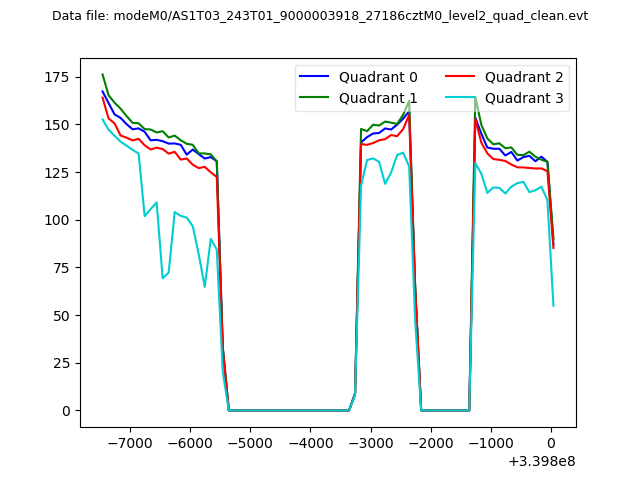 |
|
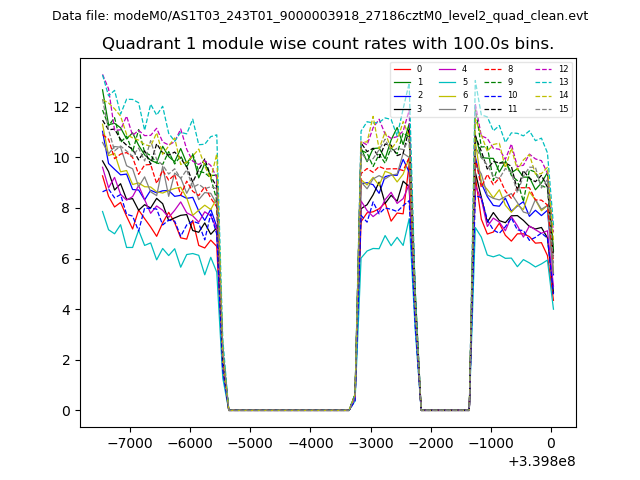
| Module-wise count rates for Quadrant A Data is divided into 100 sec bins |
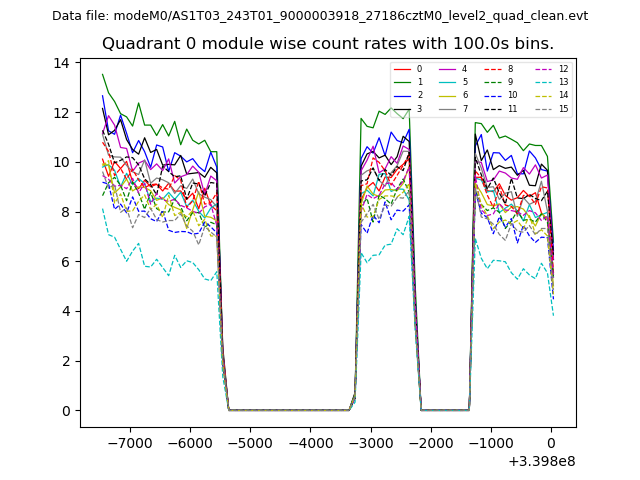 |
 |
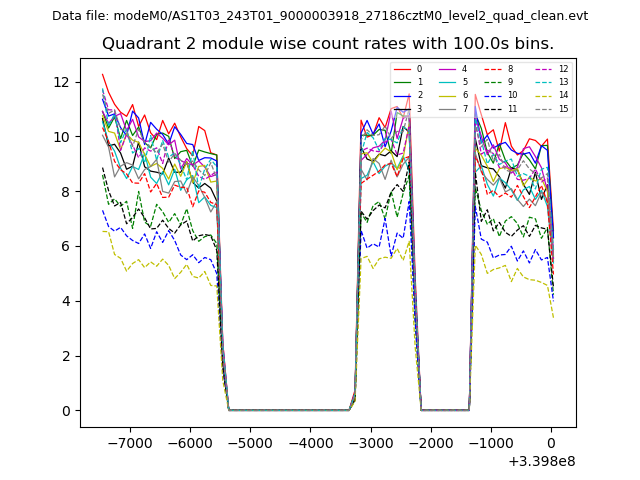
| Module-wise count rates for Quadrant B Data is divided into 100 sec bins |
 |
 |
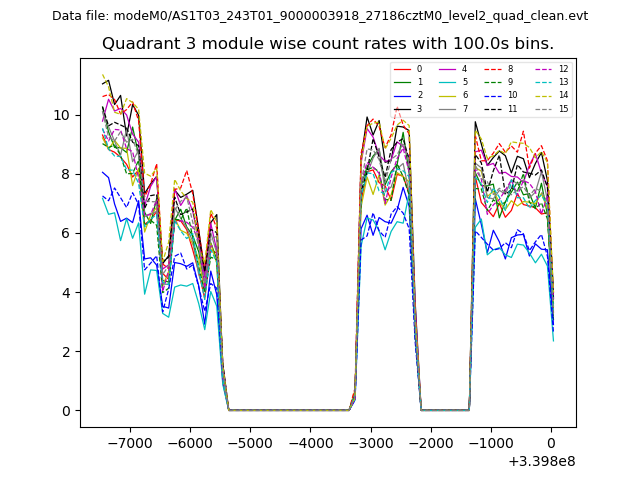
| Module-wise count rates for Quadrant C Data is divided into 100 sec bins |
 |
 |
| Module-wise count rates for Quadrant D Data is divided into 100 sec bins |
 |
 |
| Parameter | Plot |
|---|---|
| CZT HV Monitor | 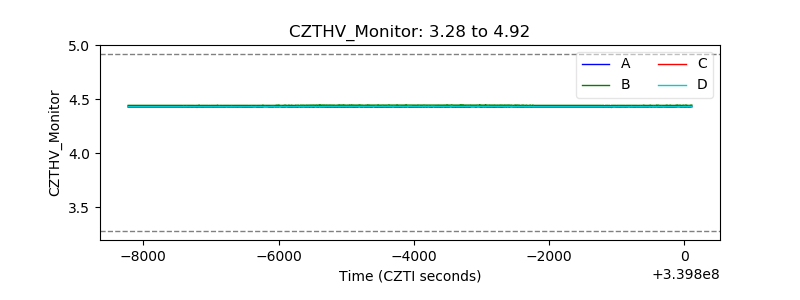 |
| D_VDD | 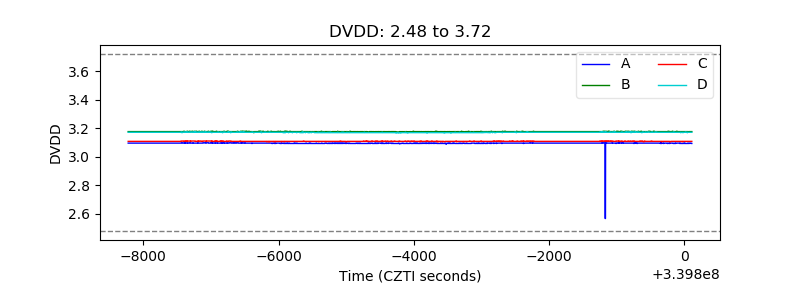 |
| Temperature 1 | 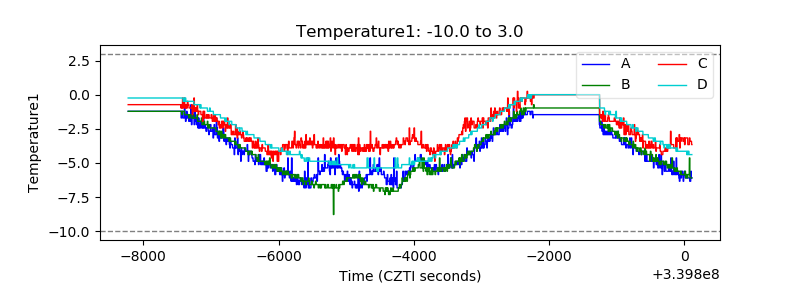 |
| Veto HV Monitor | 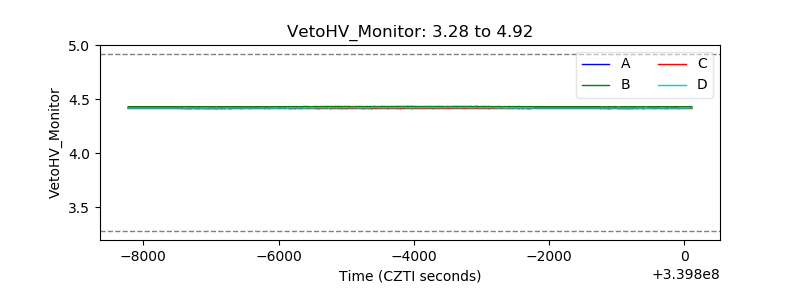 |
| Veto LLD | 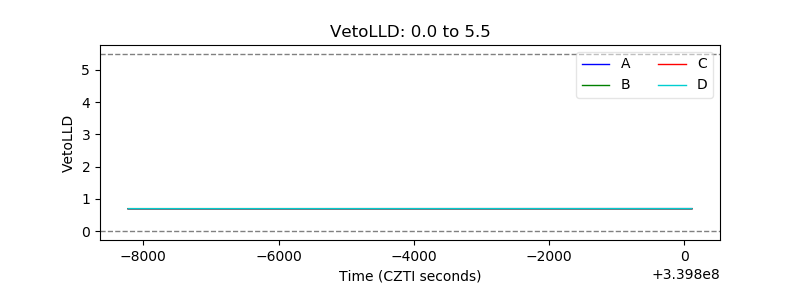 |
| Alpha Counter | 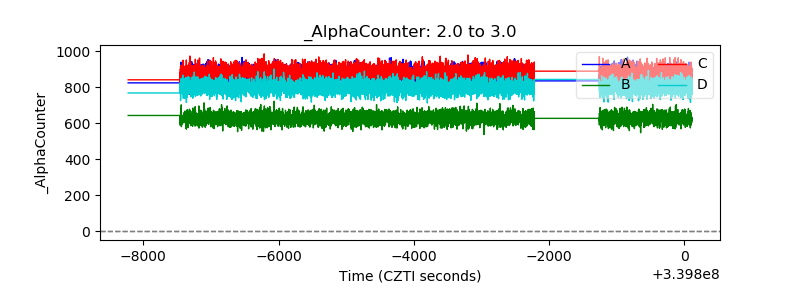 |
| _CPM_Rate | 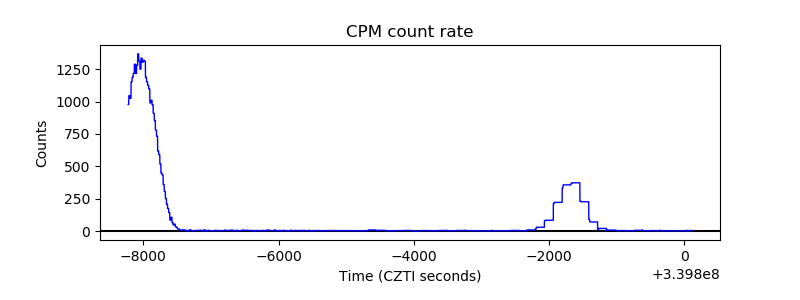 |
| CZT Counter | 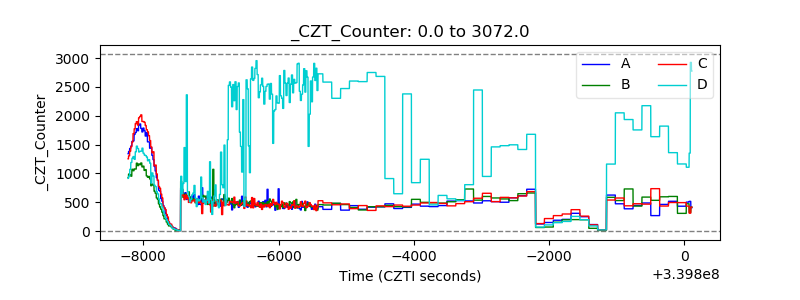 |
| +2.5 Volts monitor |  |
| +5 Volts monitor |  |
| _ROLL_ROT | 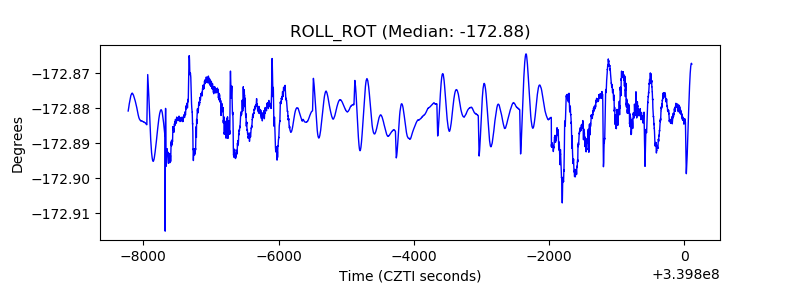 |
| _Roll_DEC | 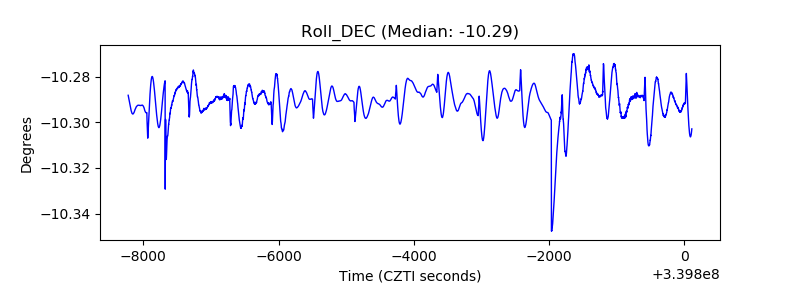 |
| _Roll_RA | 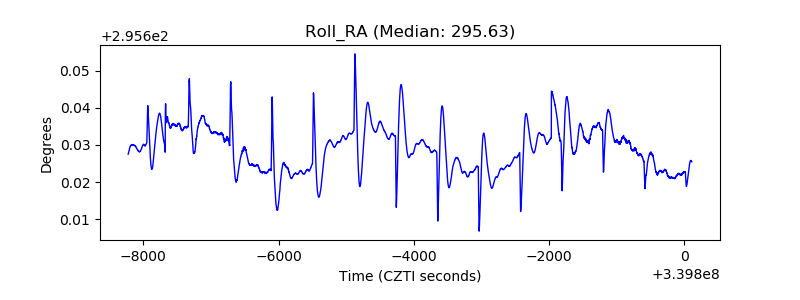 |
| Veto Counter | 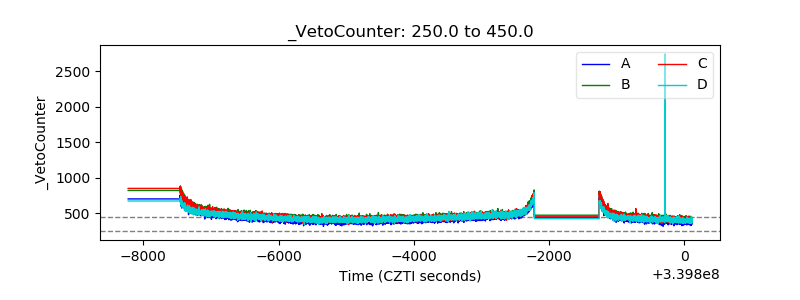 |