| Param | Original file | Final file |
|---|---|---|
| Filename | modeM0/AS1T03_243T01_9000003918_27187cztM0_level2.evt | modeM0/AS1T03_243T01_9000003918_27187cztM0_level2_quad_clean.evt |
| Size (bytes) | 587,894,400 | 97,724,160 |
| Size | 560.7 MB | 93.2 MB |
| Events in quadrant A | 3,553,283 | 631,519 |
| Events in quadrant B | 3,589,848 | 648,012 |
| Events in quadrant C | 3,415,031 | 615,156 |
| Events in quadrant D | 6,765,669 | 570,276 |
| Mode M9 | |||
|---|---|---|---|
| Quadrant | BADHDUFLAG | Total packets | Discarded packets |
| A | 0 | 14 | 0 |
| B | 0 | 15 | 0 |
| C | 0 | 15 | 0 |
| D | 0 | 15 | 0 |
| Mode M0 | |||
|---|---|---|---|
| Quadrant | BADHDUFLAG | Total packets | Discarded packets |
| A | 0 | 15037 | 0 |
| B | 0 | 15003 | 0 |
| C | 0 | 14588 | 0 |
| D | 0 | 25100 | 0 |
| Quadrant | Total seconds | Saturated seconds | Saturation percentage |
|---|---|---|---|
| A | 7099 | 53 | 0.746584% |
| B | 7099 | 70 | 0.986054% |
| C | 7099 | 79 | 1.112833% |
| D | 7099 | 424 | 5.972672% |
Noise dominated data is calculated using 1-second bins in cleaned event files. If a bin has >2000 counts, and if more than 50% of those come from <1% of pixels, then it is considered to be noise-dominated and hence unusable.
| Quadrant | # 1 sec bins | Bins with >0 counts | Bins with >2000 counts | High rate bins dominated by noise | Noise dominated (total time) | Noise dominated (detector-on time) | Marked lightcurve |
|---|---|---|---|---|---|---|---|
| A | 7650 | 7101 | 7 | 7 | 0.09% | 0.10% | 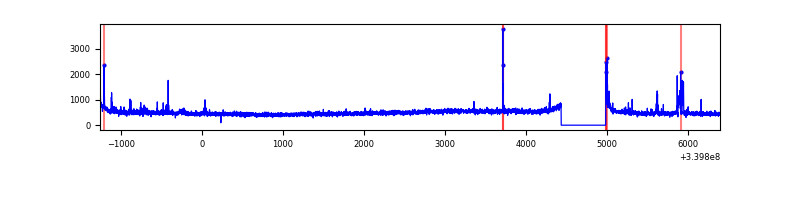 |
| B | 7650 | 7101 | 3 | 3 | 0.04% | 0.04% | 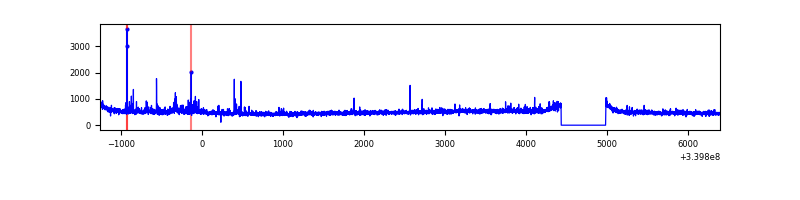 |
| C | 7650 | 7101 | 0 | 0 | 0.00% | 0.00% | 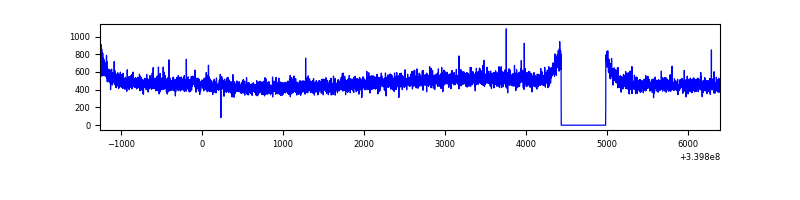 |
| D | 7650 | 7101 | 423 | 423 | 5.53% | 5.96% | 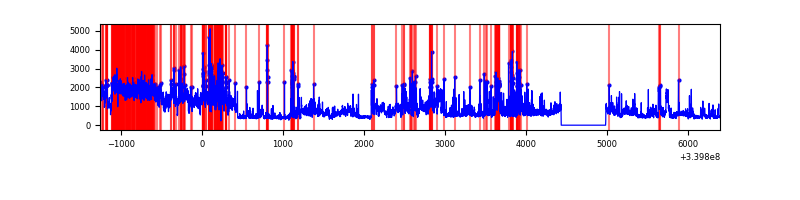 |
Top three noisy pixels from each quadrant. If the there are fewer than three noisy pixels in the level2.evt file, extra rows are filled as -1
| Pixel properties | Quadrant properties | ||||||
|---|---|---|---|---|---|---|---|
| Quadrant | DetID | PixID | Counts | Sigma | Mean | Median | Sigma |
| A | 15 | 174 | 82082 | 462.83 | 873 | 857 | 175.5 |
| A | 6 | 16 | 44795 | 250.36 | 873 | 857 | 175.5 |
| A | 13 | 248 | 27719 | 153.06 | 873 | 857 | 175.5 |
| B | 3 | 112 | 90870 | 538.18 | 875 | 853 | 167.3 |
| B | 12 | 111 | 20308 | 116.31 | 875 | 853 | 167.3 |
| B | 5 | 172 | 20144 | 115.33 | 875 | 853 | 167.3 |
| C | 14 | 238 | 133641 | 671.15 | 839 | 845 | 197.9 |
| C | 2 | 16 | 11252 | 52.6 | 839 | 845 | 197.9 |
| C | 15 | 208 | 6229 | 27.21 | 839 | 845 | 197.9 |
| D | 1 | 52 | 2957522 | 14836.48 | 827 | 803 | 199.3 |
| D | 12 | 233 | 186584 | 932.23 | 827 | 803 | 199.3 |
| D | 2 | 250 | 163219 | 814.98 | 827 | 803 | 199.3 |
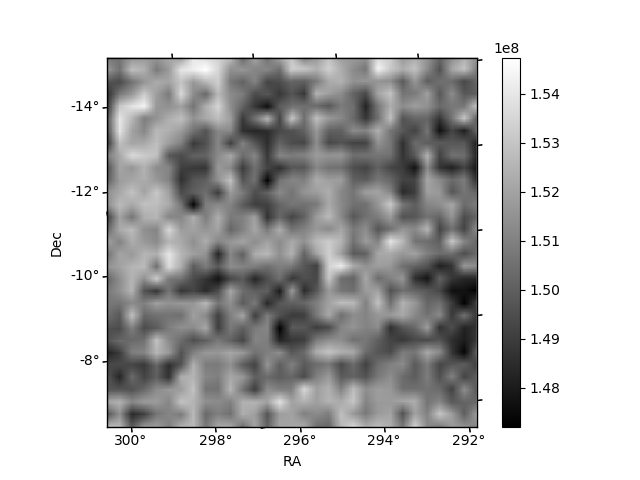
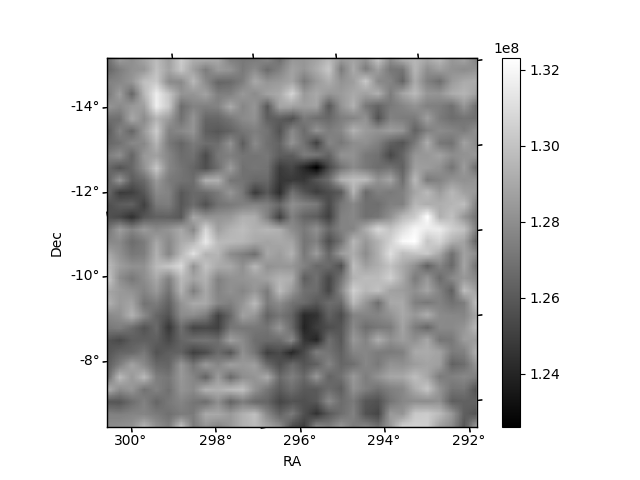
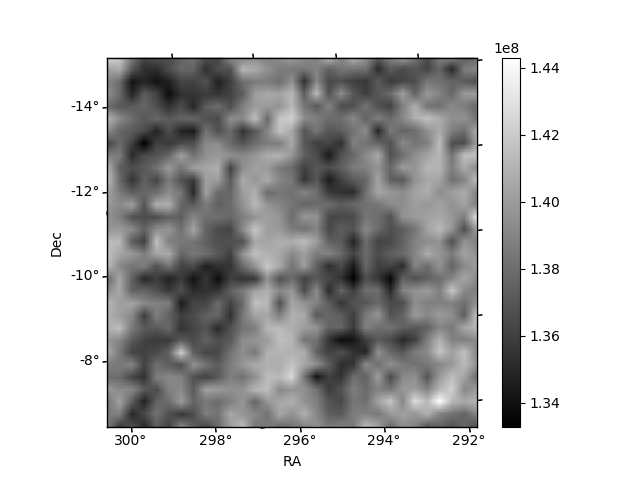
Histogram calculated using DETX and DETY for each event in the final _common_clean file
| Quadrant A | 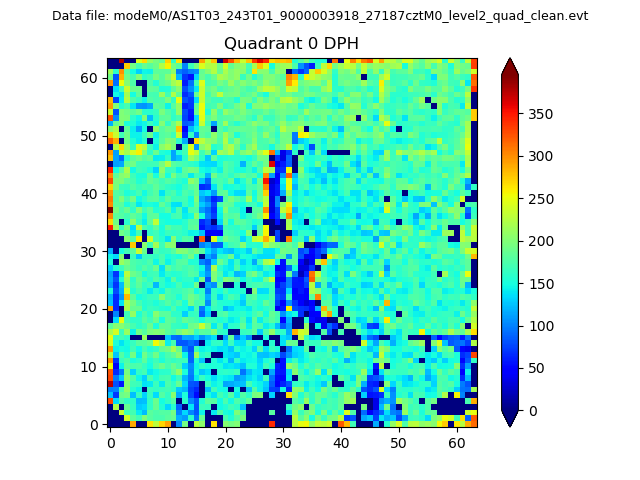 |
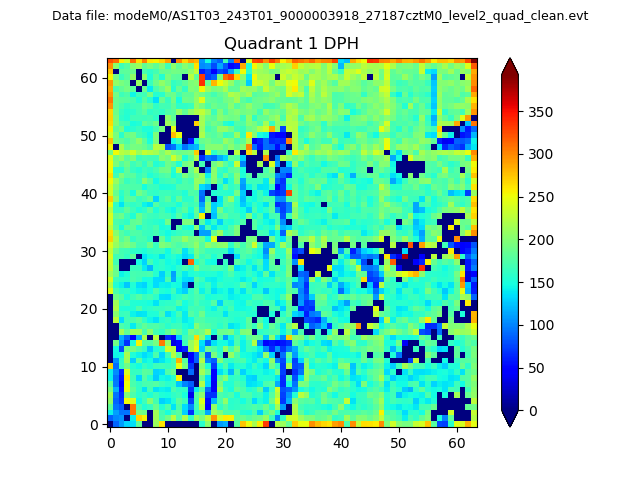 |
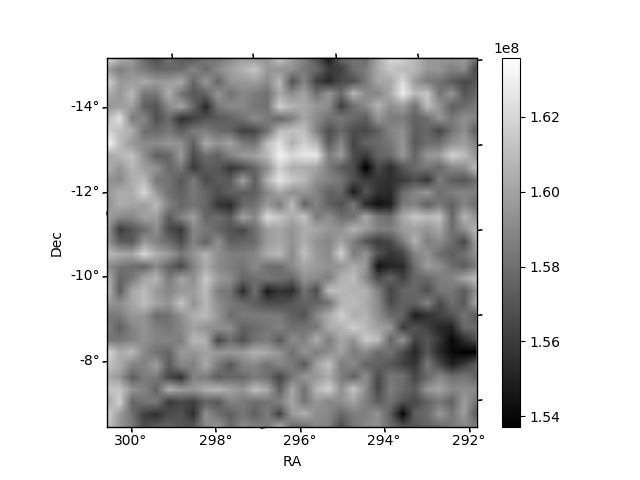
Quadrant B |
|---|---|---|---|
| Quadrant D | 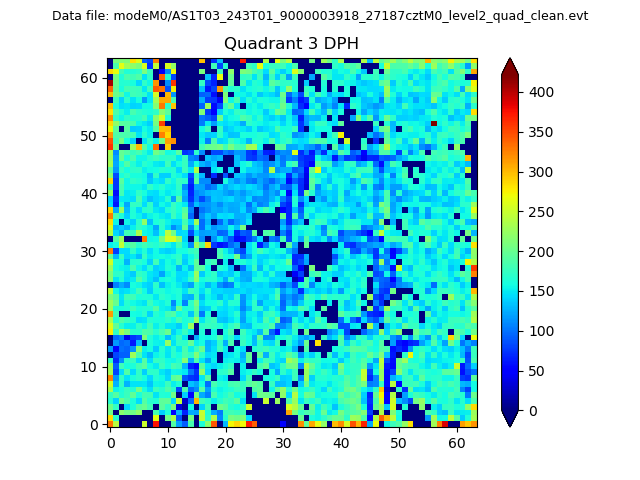 |
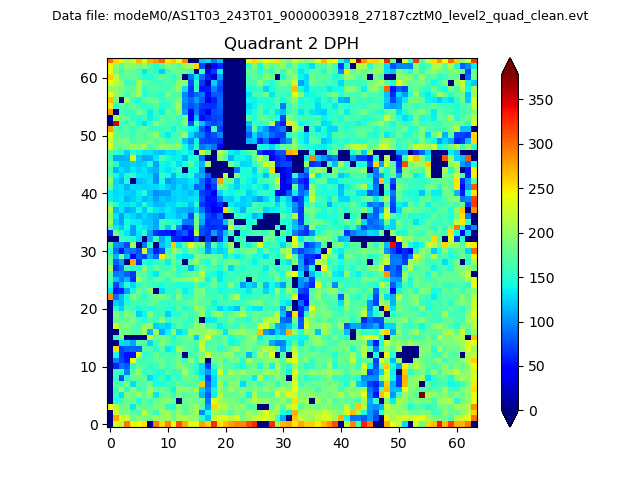 |
Quadrant C |
| Plot type | Count rate plots | Images |
|---|---|---|
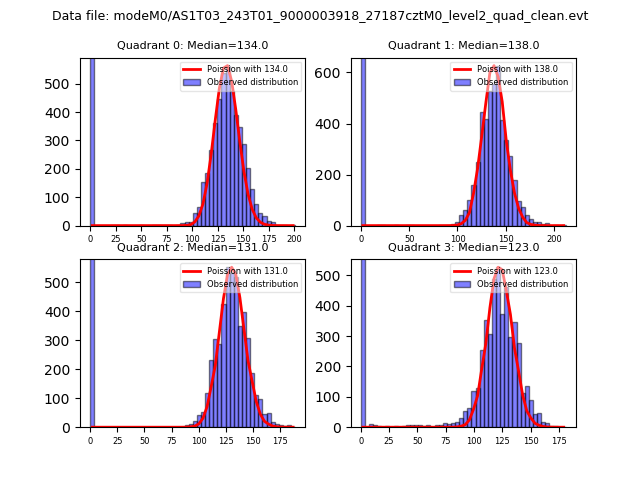
| Comparison with Poisson distribution Blue bars denote a histogram of data divided into 1 sec bins. Red curve is a Poisson curve with rate = median count rate of data. |
 |
 |
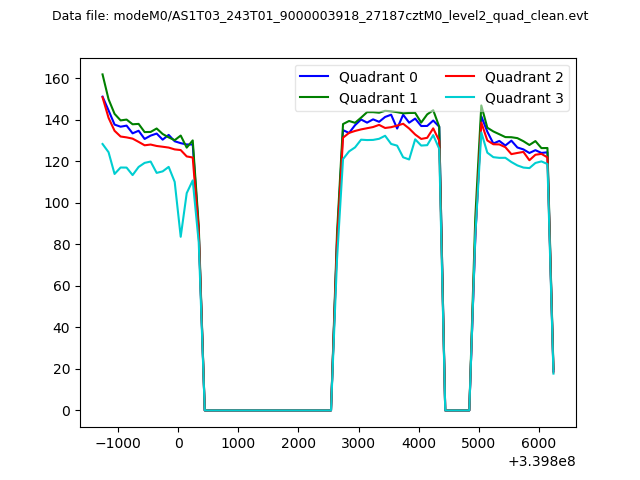
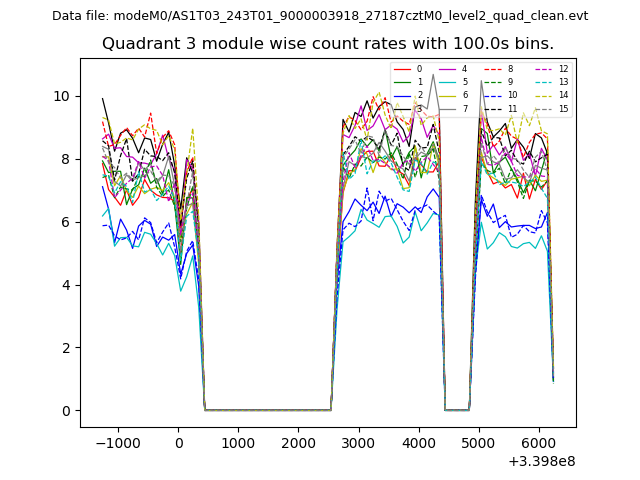
| Quadrant-wise count rates Data is divided into 100 sec bins |
 |
|
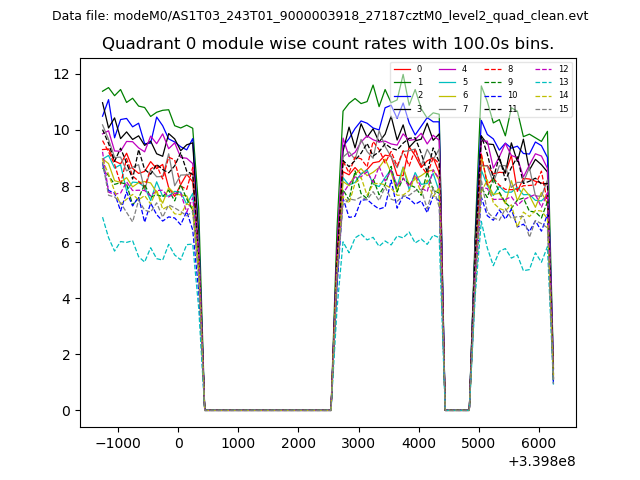
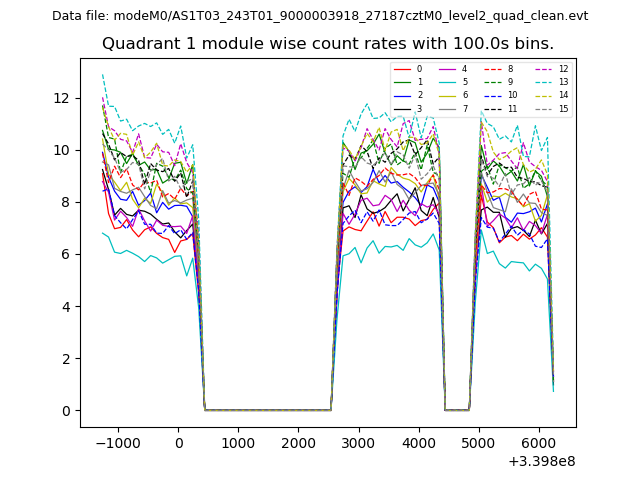
| Module-wise count rates for Quadrant A Data is divided into 100 sec bins |
 |
 |
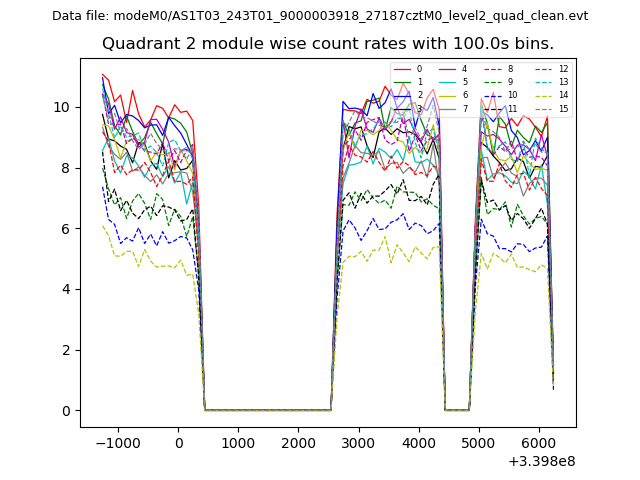
| Module-wise count rates for Quadrant B Data is divided into 100 sec bins |
 |
 |
| Module-wise count rates for Quadrant C Data is divided into 100 sec bins |
 |
 |
| Module-wise count rates for Quadrant D Data is divided into 100 sec bins |
 |
 |
| Parameter | Plot |
|---|---|
| CZT HV Monitor | 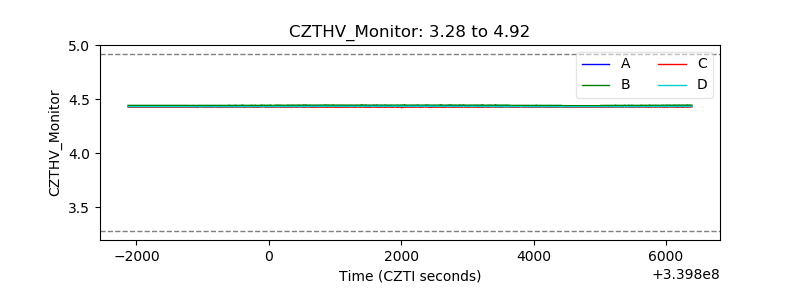 |
| D_VDD | 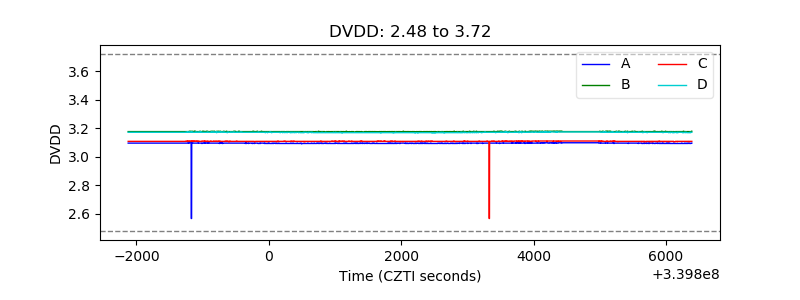 |
| Temperature 1 | 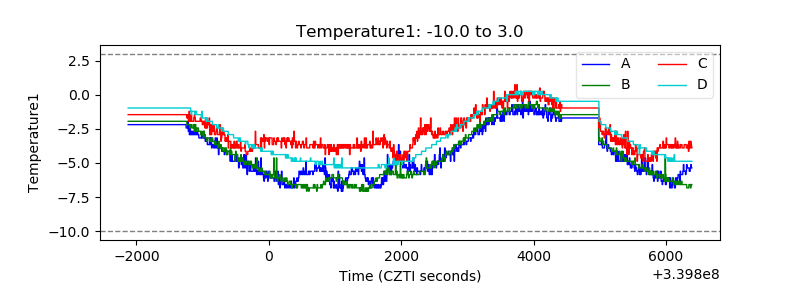 |
| Veto HV Monitor | 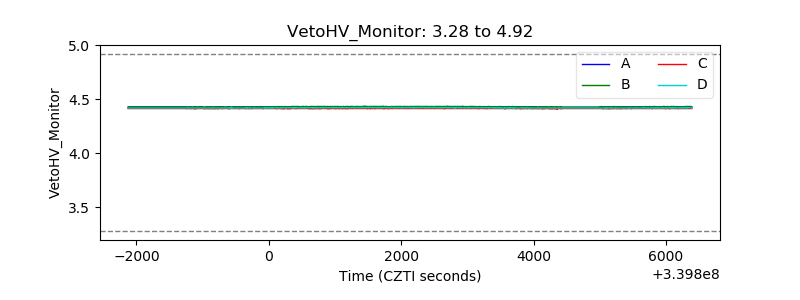 |
| Veto LLD |  |
| Alpha Counter | 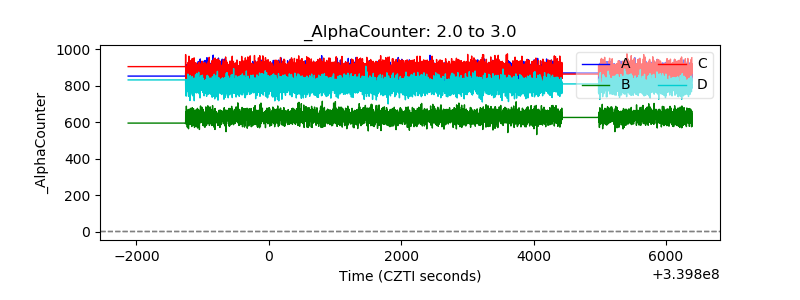 |
| _CPM_Rate | 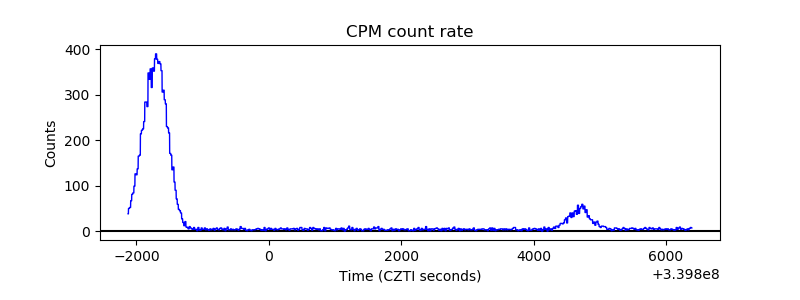 |
| CZT Counter | 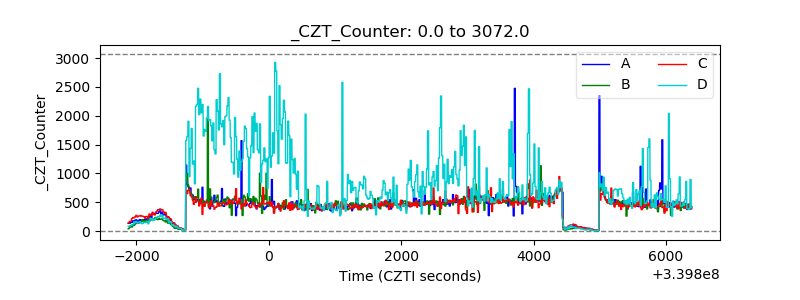 |
| +2.5 Volts monitor |  |
| +5 Volts monitor |  |
| _ROLL_ROT |  |
| _Roll_DEC | 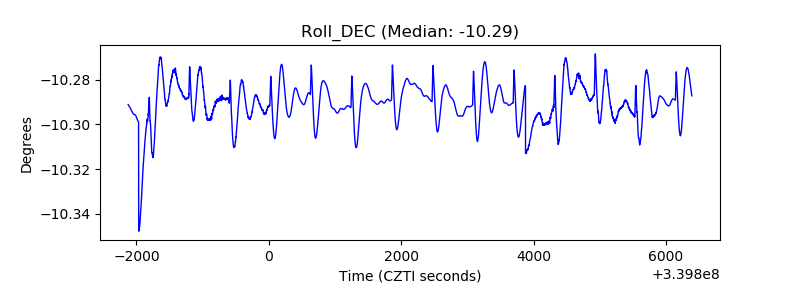 |
| _Roll_RA | 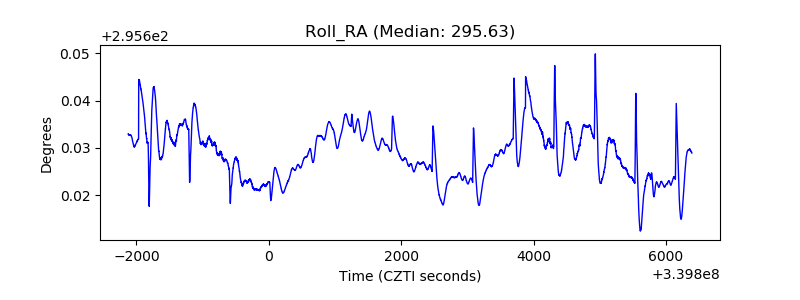 |
| Veto Counter |  |