| Param | Original file | Final file |
|---|---|---|
| Filename | modeM0/AS1T03_243T01_9000003918_27188cztM0_level2.evt | modeM0/AS1T03_243T01_9000003918_27188cztM0_level2_quad_clean.evt |
| Size (bytes) | 569,692,800 | 101,295,360 |
| Size | 543.3 MB | 96.6 MB |
| Events in quadrant A | 3,868,697 | 642,791 |
| Events in quadrant B | 3,858,416 | 659,348 |
| Events in quadrant C | 3,798,215 | 625,998 |
| Events in quadrant D | 5,202,762 | 601,019 |
| Mode M9 | |||
|---|---|---|---|
| Quadrant | BADHDUFLAG | Total packets | Discarded packets |
| A | 0 | 8 | 0 |
| B | 0 | 8 | 0 |
| C | 0 | 8 | 0 |
| D | 0 | 8 | 0 |
| Mode M0 | |||
|---|---|---|---|
| Quadrant | BADHDUFLAG | Total packets | Discarded packets |
| A | 0 | 16452 | 0 |
| B | 0 | 16315 | 0 |
| C | 0 | 16251 | 0 |
| D | 0 | 20868 | 0 |
| Quadrant | Total seconds | Saturated seconds | Saturation percentage |
|---|---|---|---|
| A | 7749 | 120 | 1.548587% |
| B | 7750 | 168 | 2.167742% |
| C | 7750 | 177 | 2.283871% |
| D | 7750 | 284 | 3.664516% |
Noise dominated data is calculated using 1-second bins in cleaned event files. If a bin has >2000 counts, and if more than 50% of those come from <1% of pixels, then it is considered to be noise-dominated and hence unusable.
| Quadrant | # 1 sec bins | Bins with >0 counts | Bins with >2000 counts | High rate bins dominated by noise | Noise dominated (total time) | Noise dominated (detector-on time) | Marked lightcurve |
|---|---|---|---|---|---|---|---|
| A | 8459 | 7752 | 5 | 5 | 0.06% | 0.06% | 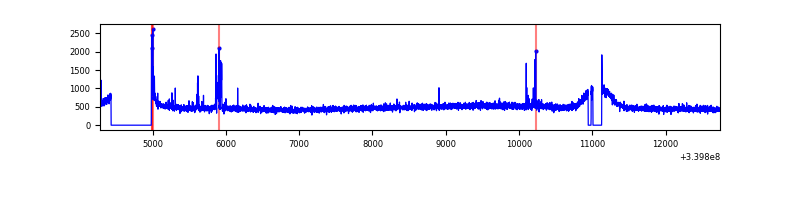 |
| B | 8460 | 7753 | 3 | 3 | 0.04% | 0.04% | 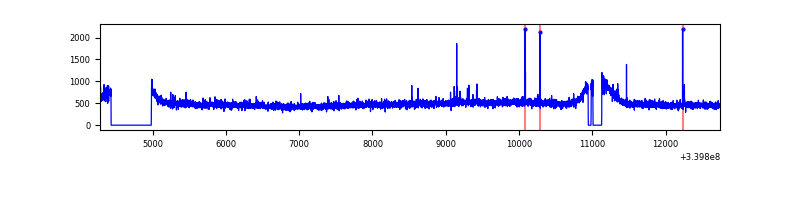 |
| C | 8460 | 7753 | 6 | 6 | 0.07% | 0.08% | 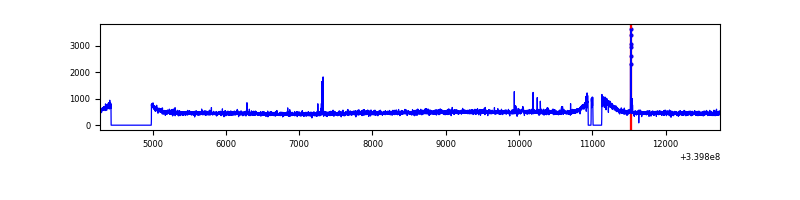 |
| D | 8460 | 7753 | 153 | 153 | 1.81% | 1.97% | 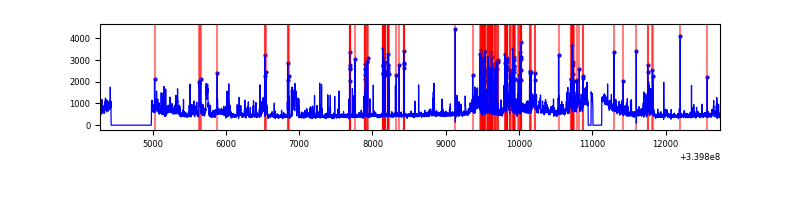 |
Top three noisy pixels from each quadrant. If the there are fewer than three noisy pixels in the level2.evt file, extra rows are filled as -1
| Pixel properties | Quadrant properties | ||||||
|---|---|---|---|---|---|---|---|
| Quadrant | DetID | PixID | Counts | Sigma | Mean | Median | Sigma |
| A | 15 | 174 | 56026 | 280.12 | 968 | 948 | 196.6 |
| A | 6 | 16 | 31319 | 154.46 | 968 | 948 | 196.6 |
| A | 13 | 248 | 29611 | 145.78 | 968 | 948 | 196.6 |
| B | 12 | 111 | 23083 | 119.87 | 967 | 943 | 184.7 |
| B | 11 | 111 | 20396 | 105.32 | 967 | 943 | 184.7 |
| B | 14 | 111 | 17804 | 91.29 | 967 | 943 | 184.7 |
| C | 14 | 238 | 145360 | 657.52 | 925 | 931 | 219.7 |
| C | 15 | 208 | 47272 | 210.97 | 925 | 931 | 219.7 |
| C | 13 | 61 | 6261 | 24.27 | 925 | 931 | 219.7 |
| D | 1 | 52 | 959017 | 3889.17 | 917 | 898 | 246.4 |
| D | 12 | 227 | 267291 | 1081.33 | 917 | 898 | 246.4 |
| D | 2 | 250 | 174996 | 706.69 | 917 | 898 | 246.4 |
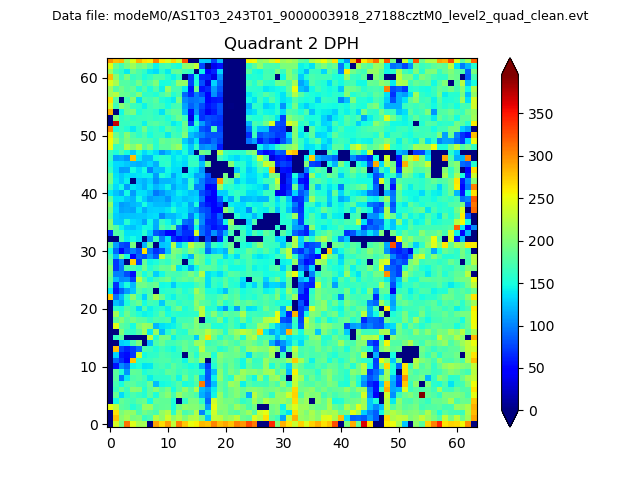
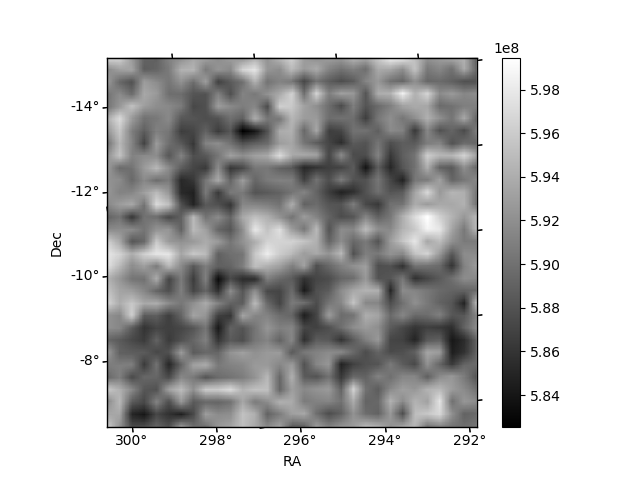
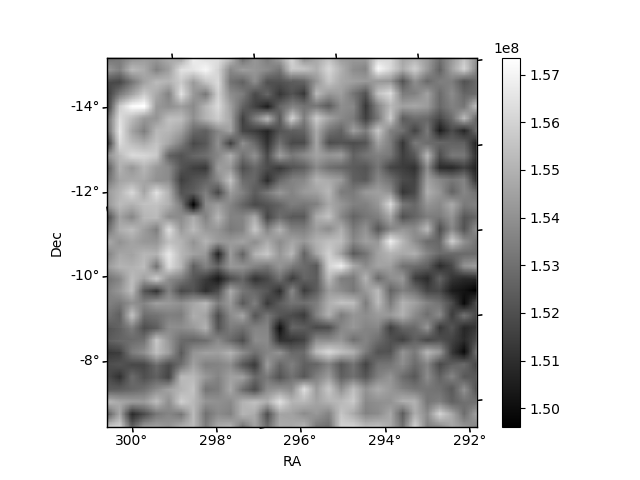
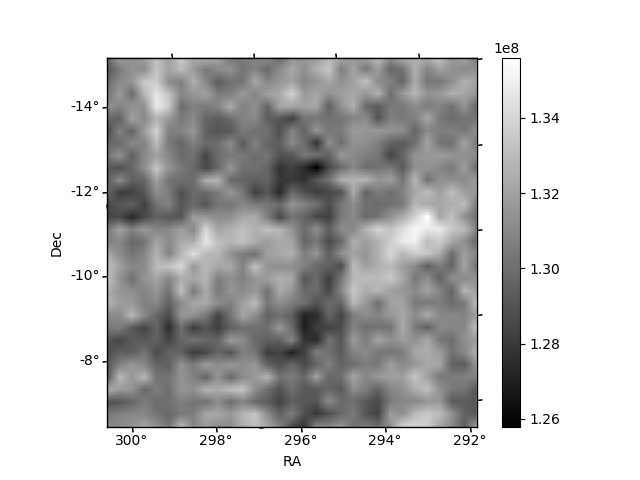
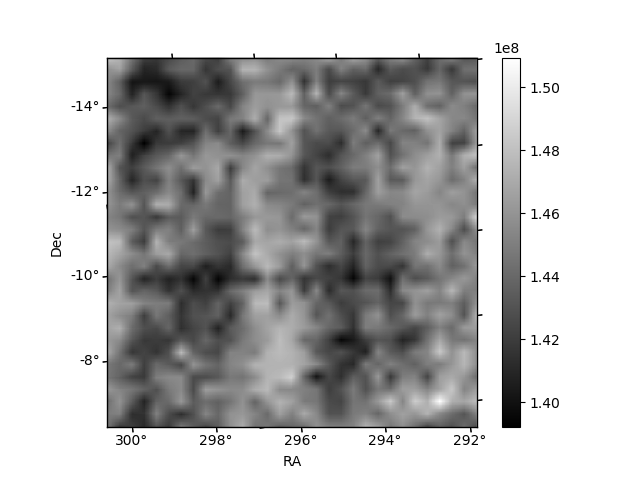
Histogram calculated using DETX and DETY for each event in the final _common_clean file
| Quadrant A | 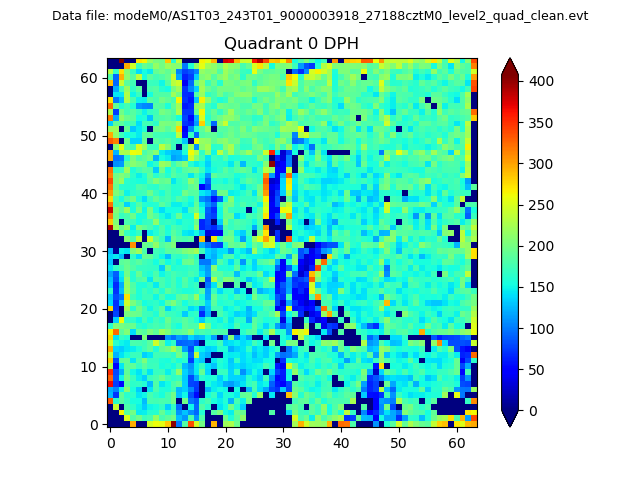 |
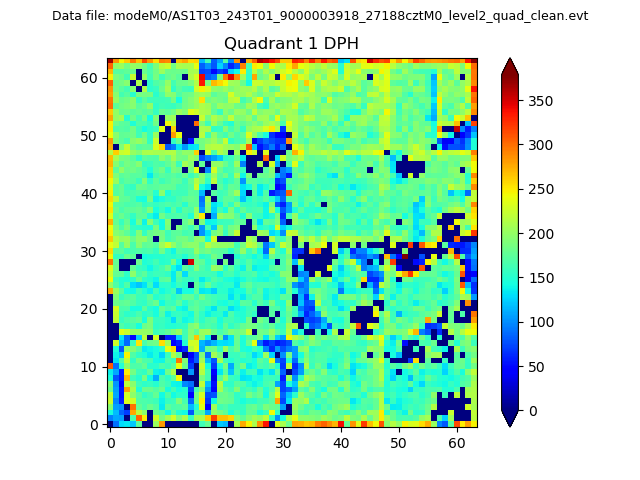 |
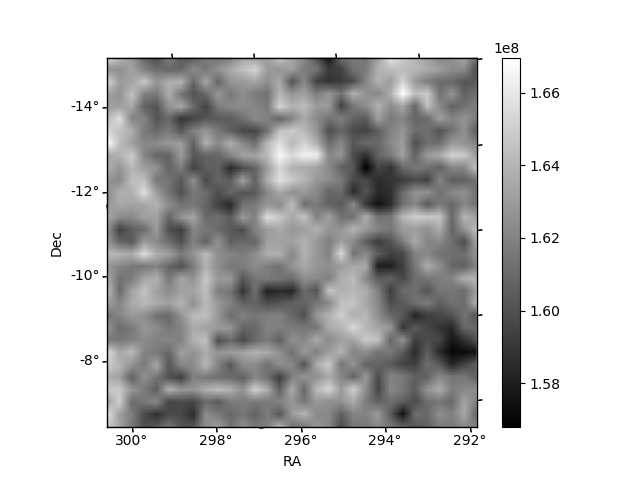
Quadrant B |
|---|---|---|---|
| Quadrant D | 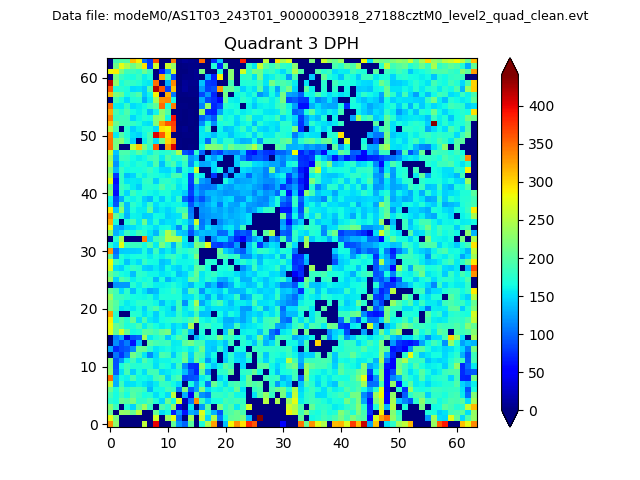 |
 |
Quadrant C |
| Plot type | Count rate plots | Images |
|---|---|---|
| Comparison with Poisson distribution Blue bars denote a histogram of data divided into 1 sec bins. Red curve is a Poisson curve with rate = median count rate of data. |
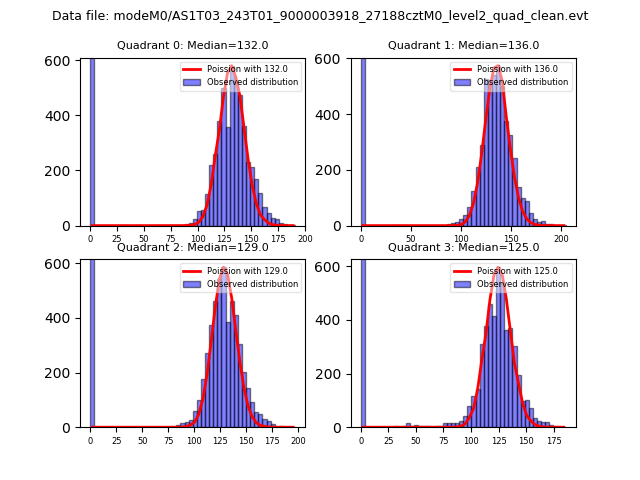 |
 |
| Quadrant-wise count rates Data is divided into 100 sec bins |
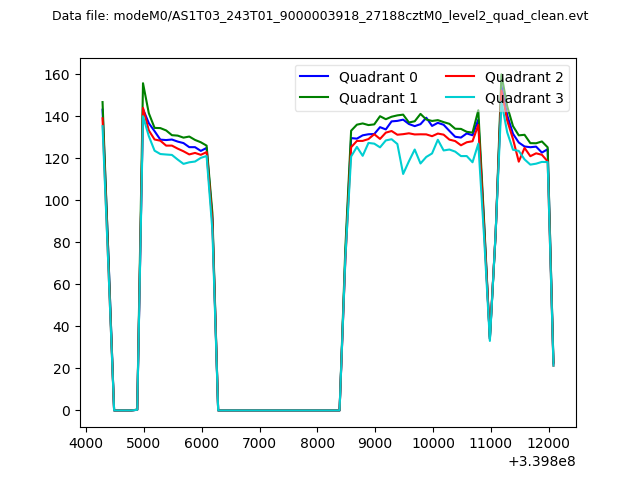 |
|
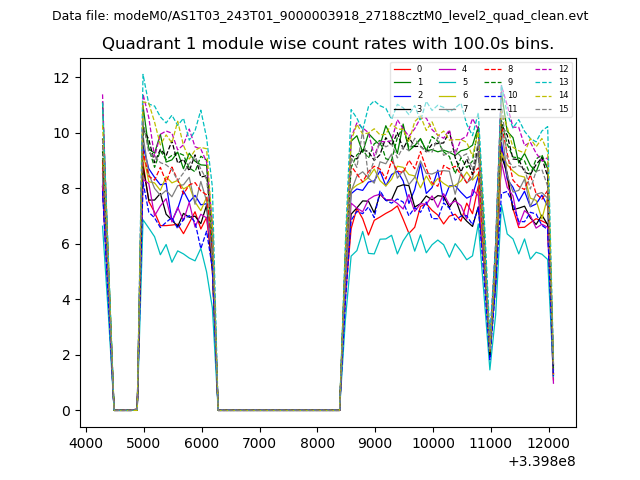
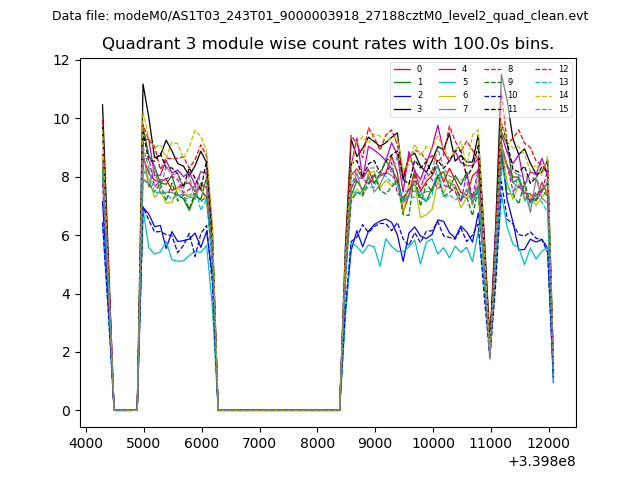
| Module-wise count rates for Quadrant A Data is divided into 100 sec bins |
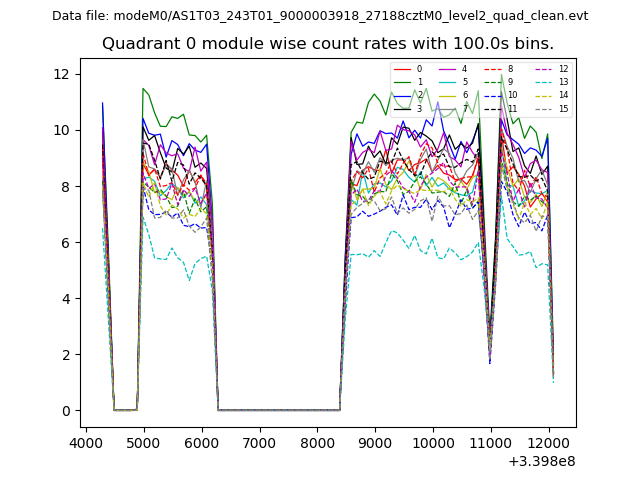 |
 |
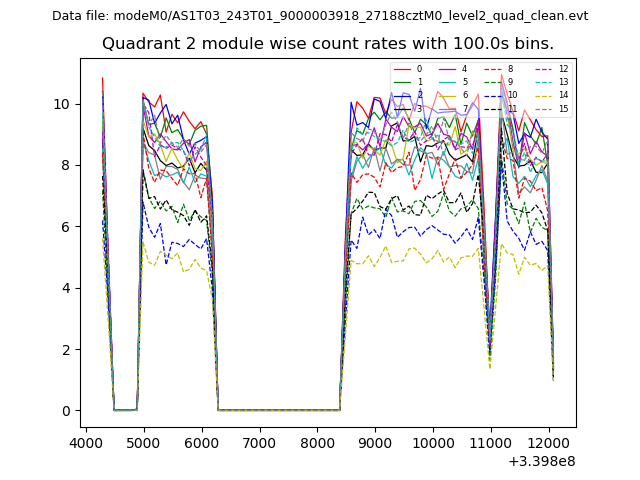
| Module-wise count rates for Quadrant B Data is divided into 100 sec bins |
 |
 |
| Module-wise count rates for Quadrant C Data is divided into 100 sec bins |
 |
 |
| Module-wise count rates for Quadrant D Data is divided into 100 sec bins |
 |
 |
| Parameter | Plot |
|---|---|
| CZT HV Monitor | 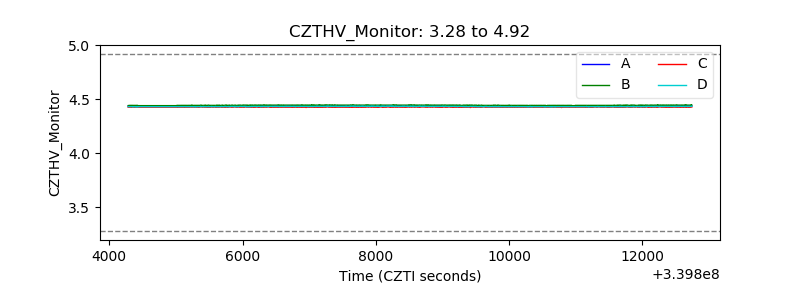 |
| D_VDD | 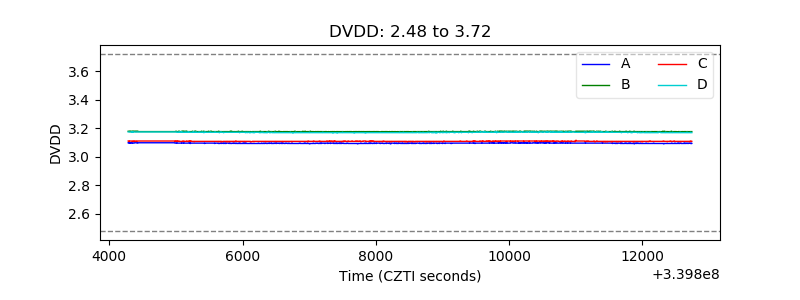 |
| Temperature 1 | 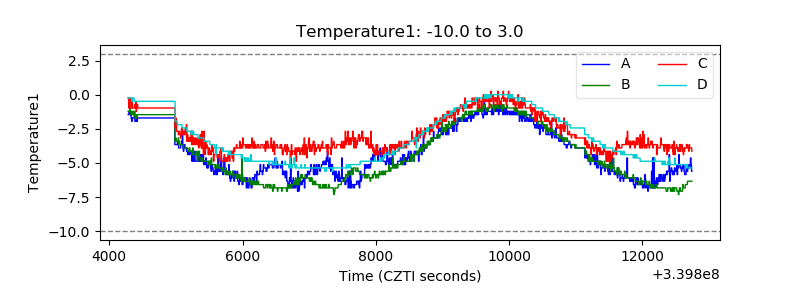 |
| Veto HV Monitor | 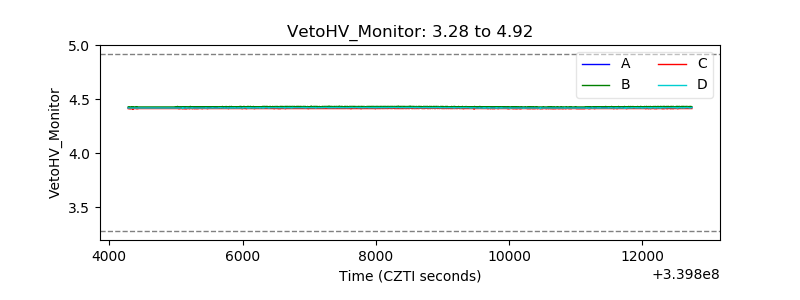 |
| Veto LLD | 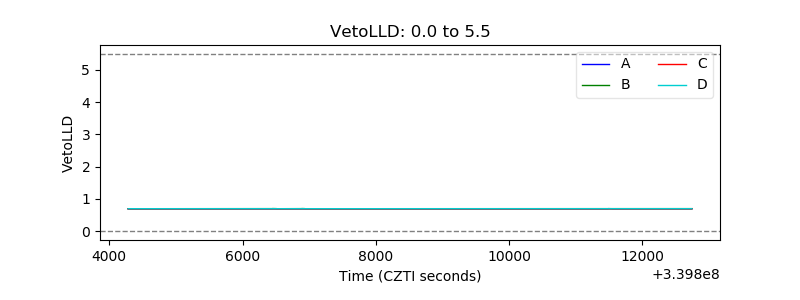 |
| Alpha Counter | 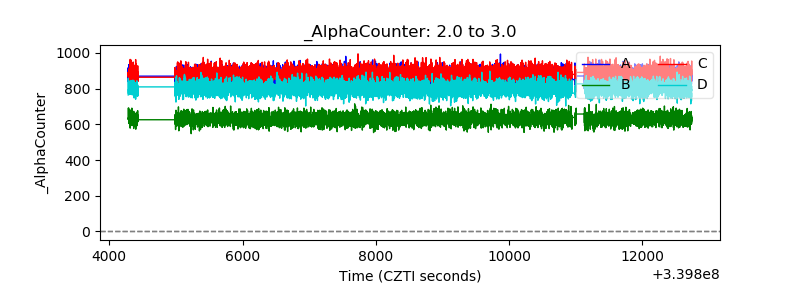 |
| _CPM_Rate | 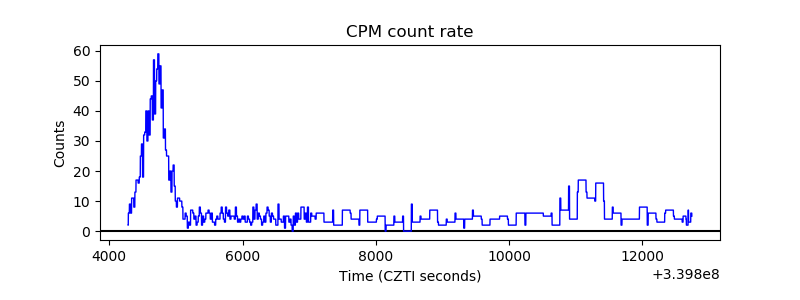 |
| CZT Counter | 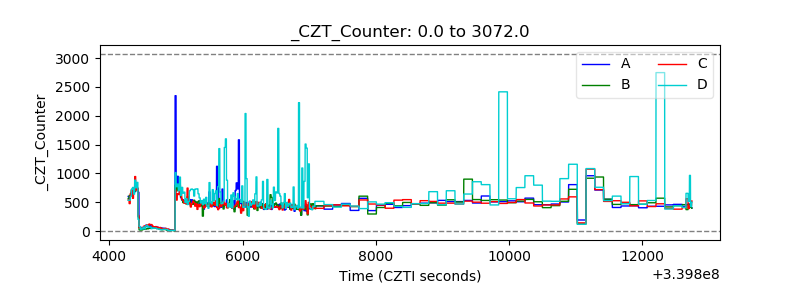 |
| +2.5 Volts monitor |  |
| +5 Volts monitor |  |
| _ROLL_ROT | 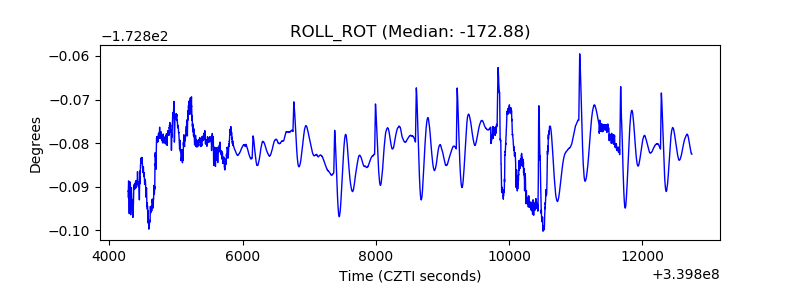 |
| _Roll_DEC | 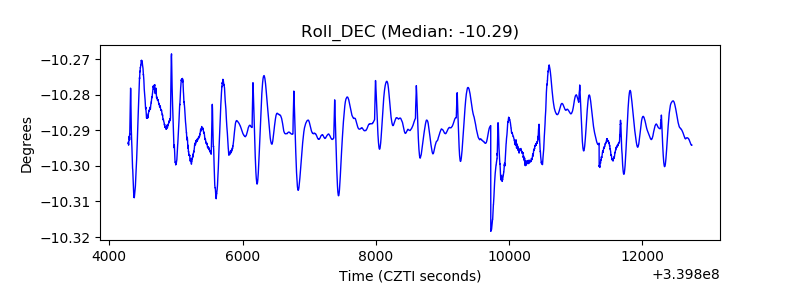 |
| _Roll_RA | 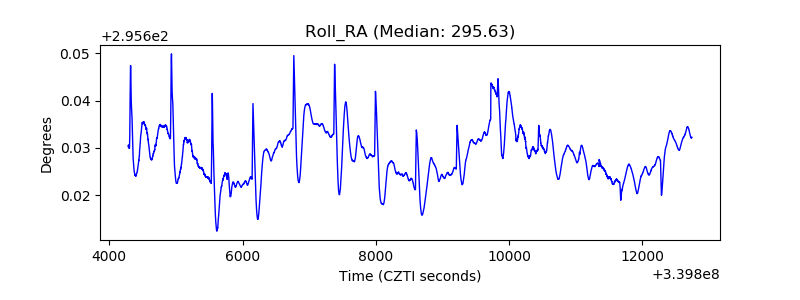 |
| Veto Counter | 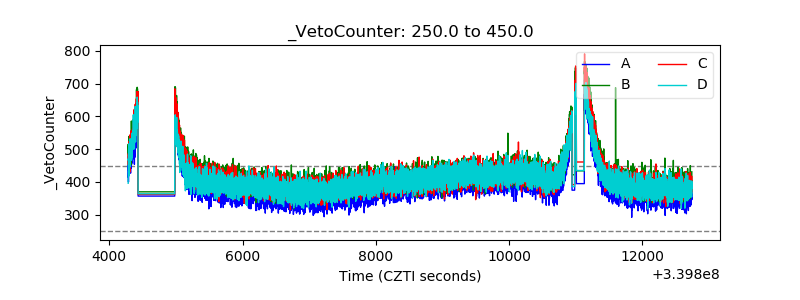 |