| Param | Original file | Final file |
|---|---|---|
| Filename | modeM0/AS1T03_243T01_9000003918_27189cztM0_level2.evt | modeM0/AS1T03_243T01_9000003918_27189cztM0_level2_quad_clean.evt |
| Size (bytes) | 630,273,600 | 105,053,760 |
| Size | 601.1 MB | 100.2 MB |
| Events in quadrant A | 4,171,137 | 658,560 |
| Events in quadrant B | 4,253,529 | 673,543 |
| Events in quadrant C | 4,463,540 | 633,791 |
| Events in quadrant D | 5,619,491 | 621,235 |
| Mode M9 | |||
|---|---|---|---|
| Quadrant | BADHDUFLAG | Total packets | Discarded packets |
| A | 0 | 5 | 0 |
| B | 0 | 5 | 0 |
| C | 0 | 5 | 0 |
| D | 0 | 5 | 0 |
| Mode M0 | |||
|---|---|---|---|
| Quadrant | BADHDUFLAG | Total packets | Discarded packets |
| A | 0 | 17881 | 0 |
| B | 0 | 17975 | 0 |
| C | 0 | 18768 | 0 |
| D | 0 | 22553 | 0 |
| Quadrant | Total seconds | Saturated seconds | Saturation percentage |
|---|---|---|---|
| A | 8558 | 108 | 1.261977% |
| B | 8559 | 180 | 2.103049% |
| C | 8559 | 287 | 3.353195% |
| D | 8559 | 339 | 3.960743% |
Noise dominated data is calculated using 1-second bins in cleaned event files. If a bin has >2000 counts, and if more than 50% of those come from <1% of pixels, then it is considered to be noise-dominated and hence unusable.
| Quadrant | # 1 sec bins | Bins with >0 counts | Bins with >2000 counts | High rate bins dominated by noise | Noise dominated (total time) | Noise dominated (detector-on time) | Marked lightcurve |
|---|---|---|---|---|---|---|---|
| A | 9018 | 8561 | 1 | 1 | 0.01% | 0.01% | 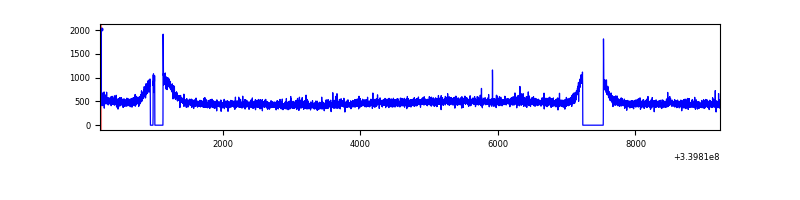 |
| B | 9019 | 8562 | 5 | 5 | 0.06% | 0.06% | 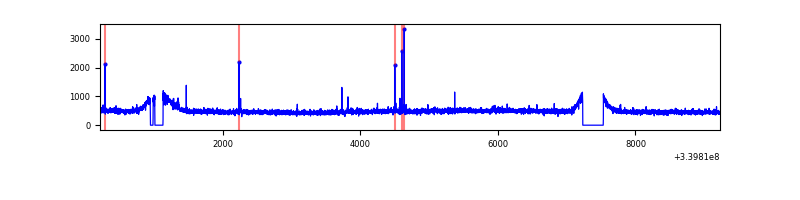 |
| C | 9019 | 8562 | 50 | 50 | 0.55% | 0.58% | 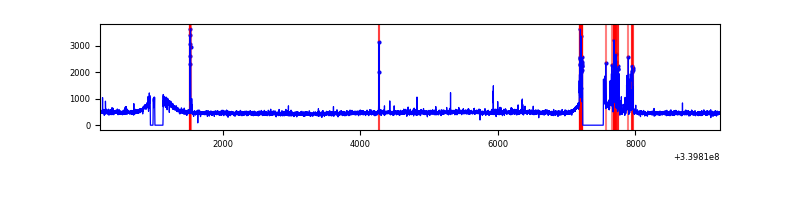 |
| D | 9019 | 8562 | 187 | 187 | 2.07% | 2.18% | 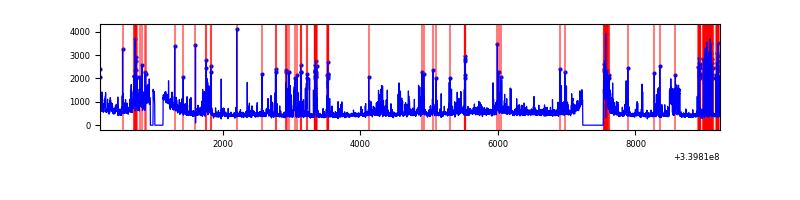 |
Top three noisy pixels from each quadrant. If the there are fewer than three noisy pixels in the level2.evt file, extra rows are filled as -1
| Pixel properties | Quadrant properties | ||||||
|---|---|---|---|---|---|---|---|
| Quadrant | DetID | PixID | Counts | Sigma | Mean | Median | Sigma |
| A | 6 | 16 | 24002 | 106.64 | 1066 | 1044 | 215.3 |
| A | 13 | 254 | 13146 | 56.21 | 1066 | 1044 | 215.3 |
| A | 8 | 192 | 11167 | 47.02 | 1066 | 1044 | 215.3 |
| B | 12 | 111 | 25323 | 117.66 | 1065 | 1038 | 206.4 |
| B | 11 | 111 | 22548 | 104.21 | 1065 | 1038 | 206.4 |
| B | 3 | 112 | 22324 | 103.13 | 1065 | 1038 | 206.4 |
| C | 15 | 208 | 341775 | 1416.09 | 1012 | 1020 | 240.6 |
| C | 14 | 238 | 161296 | 666.07 | 1012 | 1020 | 240.6 |
| C | 2 | 16 | 10067 | 37.6 | 1012 | 1020 | 240.6 |
| D | 1 | 52 | 1204486 | 4448.81 | 1011 | 991 | 270.5 |
| D | 2 | 250 | 219928 | 809.32 | 1011 | 991 | 270.5 |
| D | 12 | 233 | 115519 | 423.36 | 1011 | 991 | 270.5 |
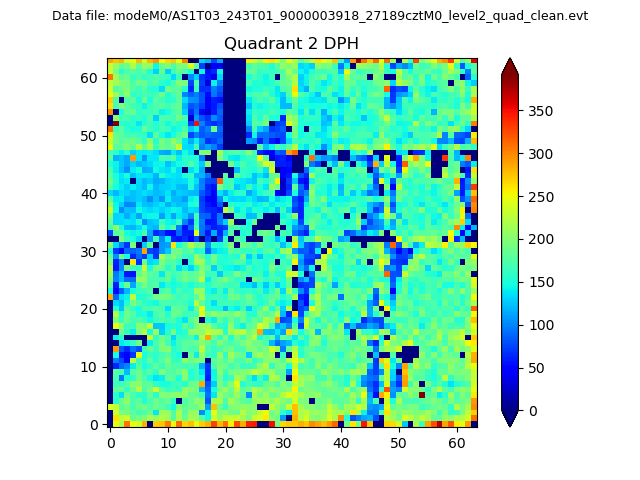
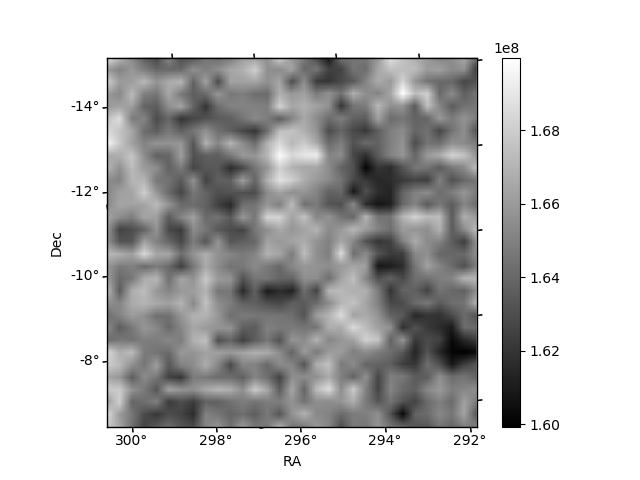
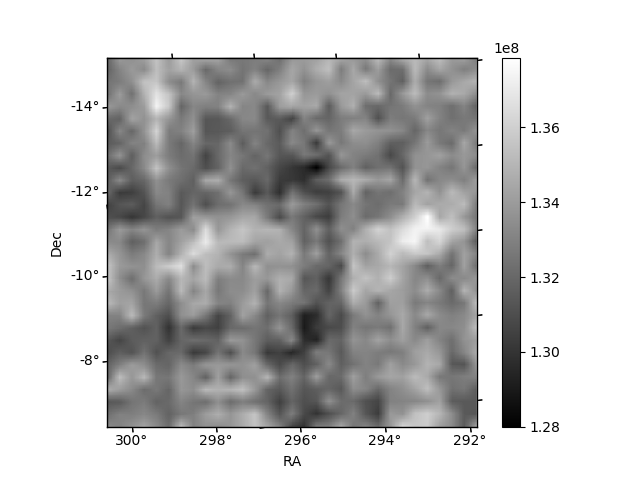
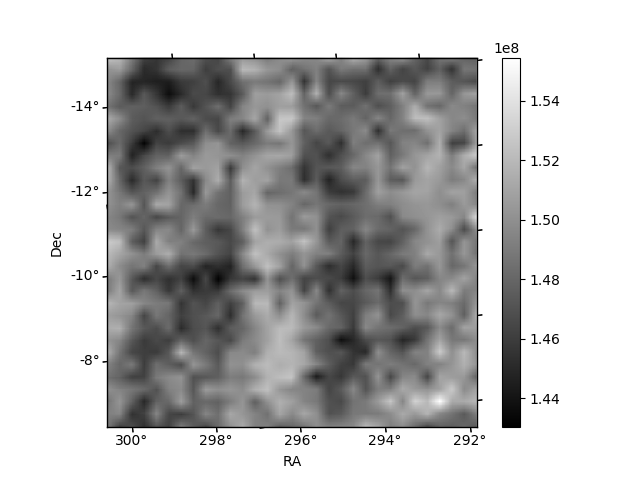
Histogram calculated using DETX and DETY for each event in the final _common_clean file
| Quadrant A | 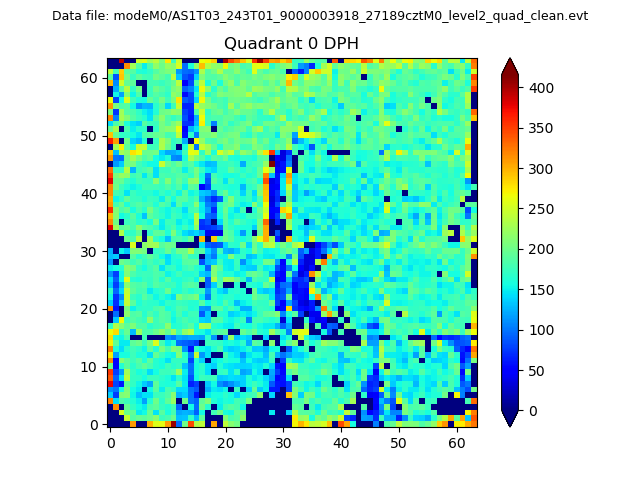 |
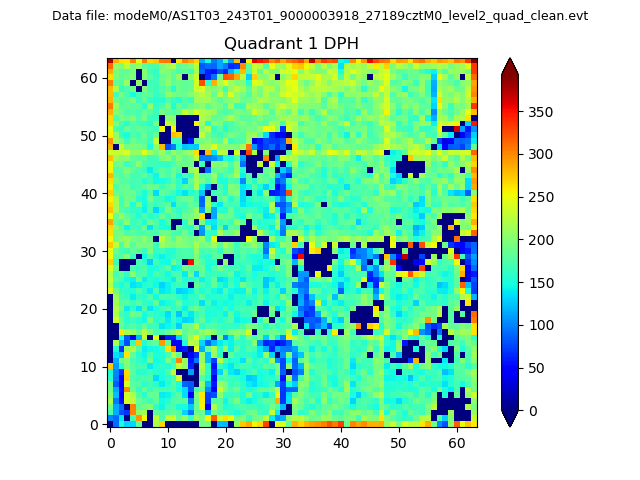 |
Quadrant B |
|---|---|---|---|
| Quadrant D | 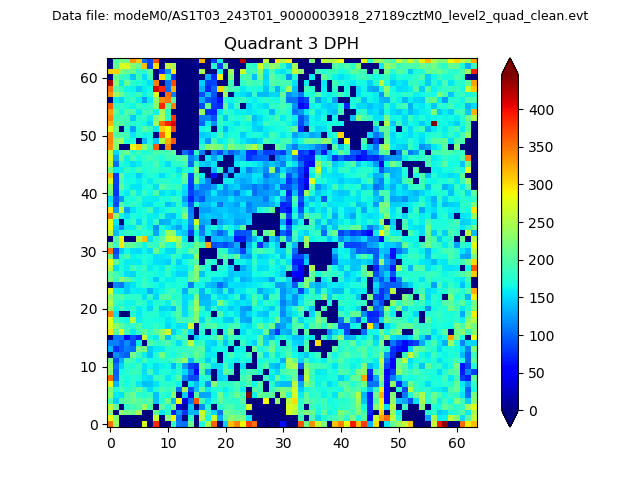 |
 |
Quadrant C |
| Plot type | Count rate plots | Images |
|---|---|---|
| Comparison with Poisson distribution Blue bars denote a histogram of data divided into 1 sec bins. Red curve is a Poisson curve with rate = median count rate of data. |
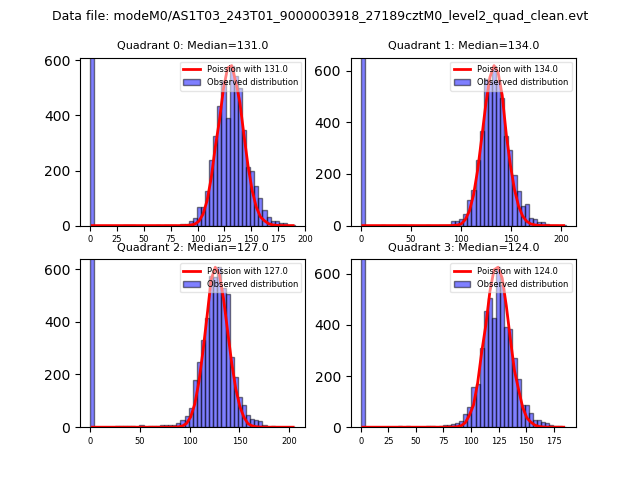 |
 |
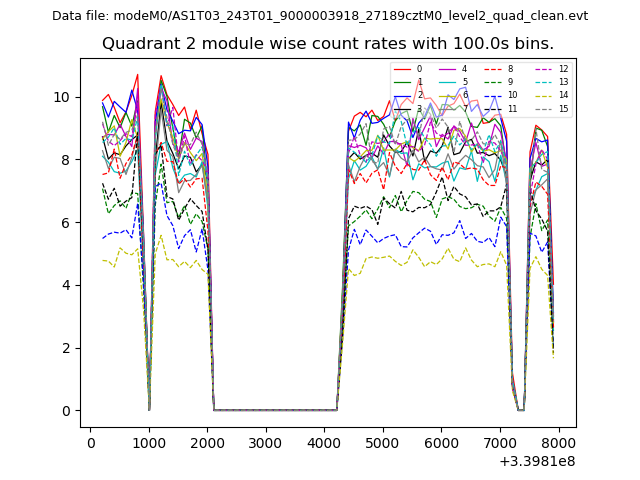
| Quadrant-wise count rates Data is divided into 100 sec bins |
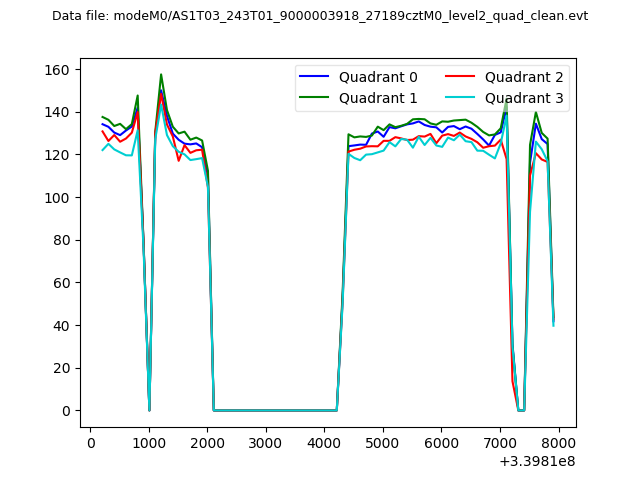 |
|
| Module-wise count rates for Quadrant A Data is divided into 100 sec bins |
 |
 |
| Module-wise count rates for Quadrant B Data is divided into 100 sec bins |
 |
 |
| Module-wise count rates for Quadrant C Data is divided into 100 sec bins |
 |
 |
| Module-wise count rates for Quadrant D Data is divided into 100 sec bins |
 |
 |
| Parameter | Plot |
|---|---|
| CZT HV Monitor | 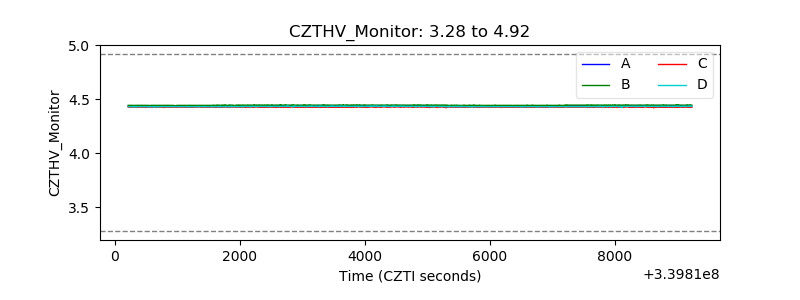 |
| D_VDD | 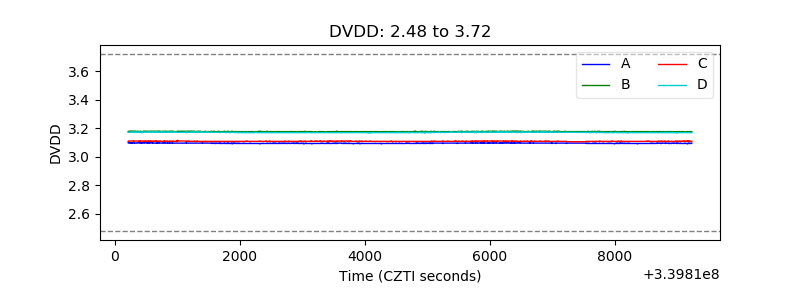 |
| Temperature 1 |  |
| Veto HV Monitor |  |
| Veto LLD | 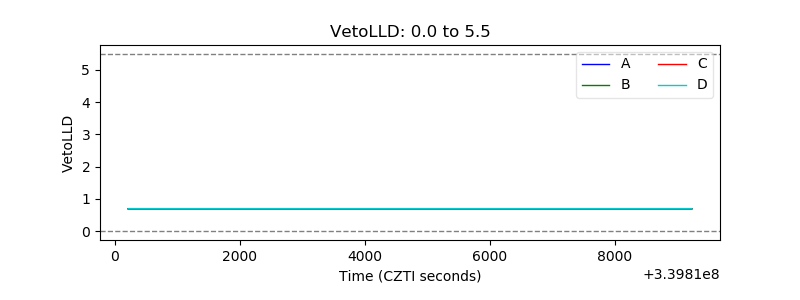 |
| Alpha Counter | 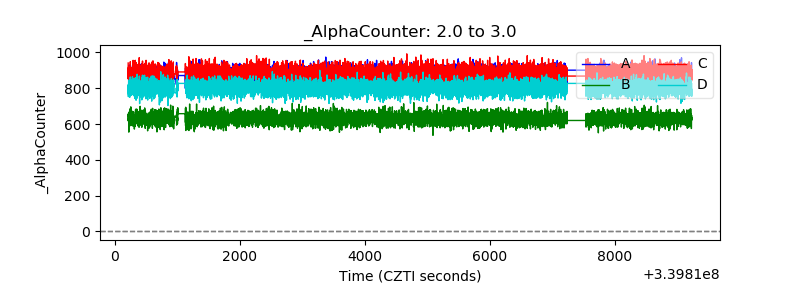 |
| _CPM_Rate | 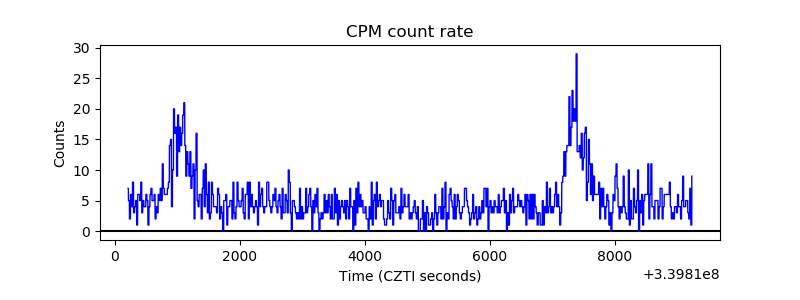 |
| CZT Counter | 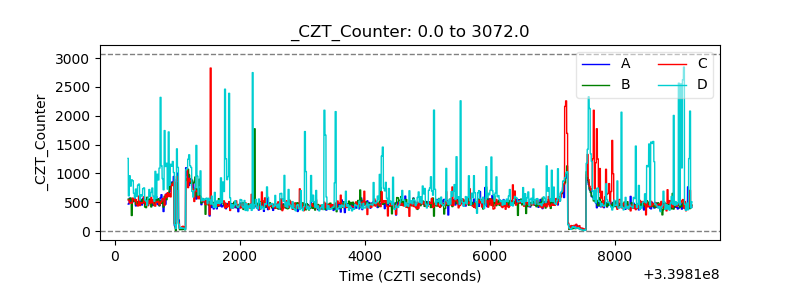 |
| +2.5 Volts monitor |  |
| +5 Volts monitor | 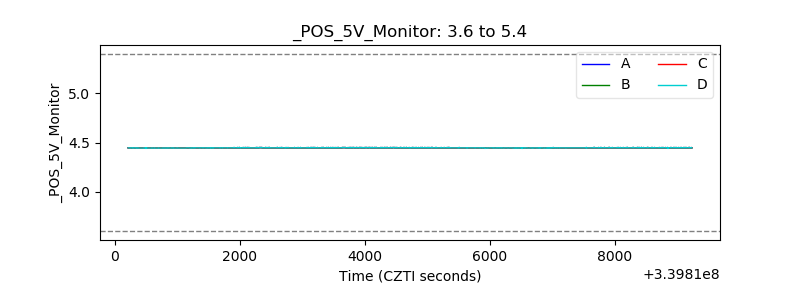 |
| _ROLL_ROT | 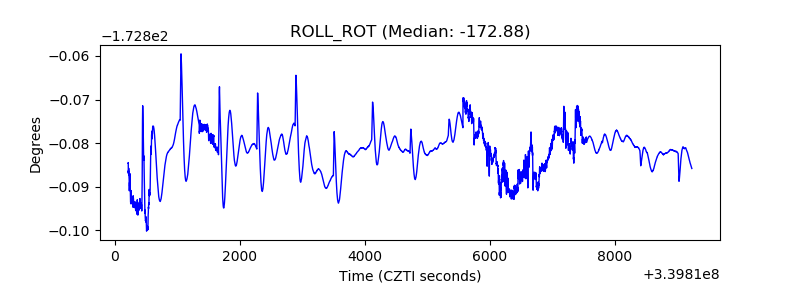 |
| _Roll_DEC | 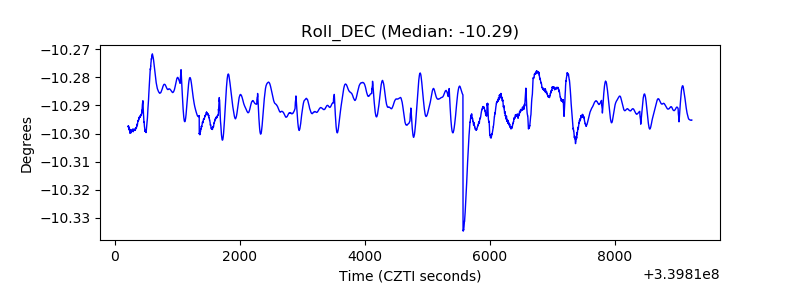 |
| _Roll_RA | 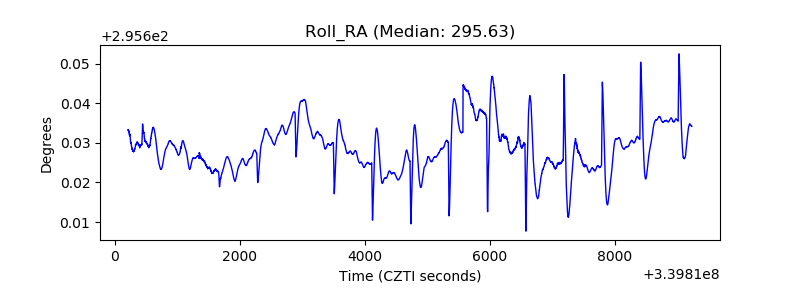 |
| Veto Counter | 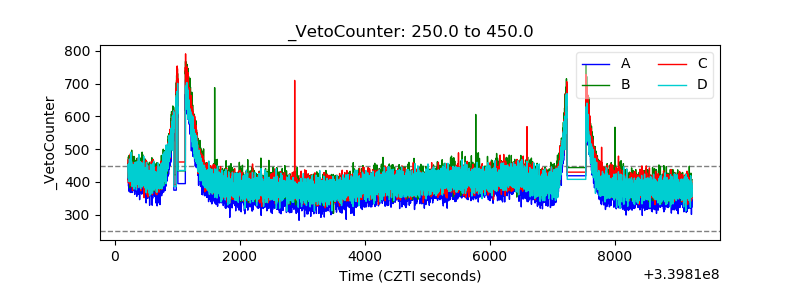 |