| Param | Original file | Final file |
|---|---|---|
| Filename | modeM0/AS1T03_243T01_9000003918_27193cztM0_level2.evt | modeM0/AS1T03_243T01_9000003918_27193cztM0_level2_quad_clean.evt |
| Size (bytes) | 1,801,995,840 | 291,176,640 |
| Size | 1.7 GB | 277.7 MB |
| Events in quadrant A | 11,182,361 | 1,861,107 |
| Events in quadrant B | 14,228,183 | 1,868,747 |
| Events in quadrant C | 11,959,719 | 1,804,948 |
| Events in quadrant D | 15,666,657 | 1,716,768 |
| Mode M9 | |||
|---|---|---|---|
| Quadrant | BADHDUFLAG | Total packets | Discarded packets |
| A | 0 | 28 | 0 |
| B | 0 | 28 | 0 |
| C | 0 | 28 | 0 |
| D | 0 | 28 | 0 |
| Mode M0 | |||
|---|---|---|---|
| Quadrant | BADHDUFLAG | Total packets | Discarded packets |
| A | 0 | 47429 | 0 |
| B | 0 | 56537 | 0 |
| C | 0 | 50007 | 0 |
| D | 0 | 61677 | 0 |
| Quadrant | Total seconds | Saturated seconds | Saturation percentage |
|---|---|---|---|
| A | 22773 | 287 | 1.260264% |
| B | 22773 | 1559 | 6.845826% |
| C | 22773 | 651 | 2.858648% |
| D | 22772 | 1381 | 6.064465% |
Noise dominated data is calculated using 1-second bins in cleaned event files. If a bin has >2000 counts, and if more than 50% of those come from <1% of pixels, then it is considered to be noise-dominated and hence unusable.
| Quadrant | # 1 sec bins | Bins with >0 counts | Bins with >2000 counts | High rate bins dominated by noise | Noise dominated (total time) | Noise dominated (detector-on time) | Marked lightcurve |
|---|---|---|---|---|---|---|---|
| A | 25538 | 22777 | 11 | 11 | 0.04% | 0.05% | 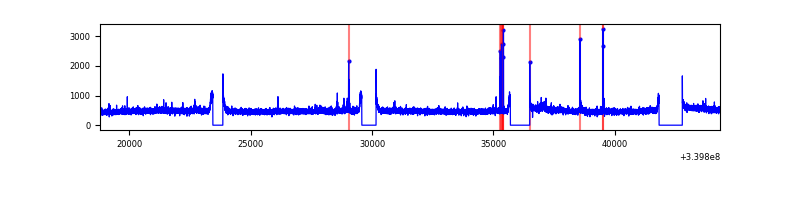 |
| B | 25538 | 22777 | 850 | 850 | 3.33% | 3.73% | 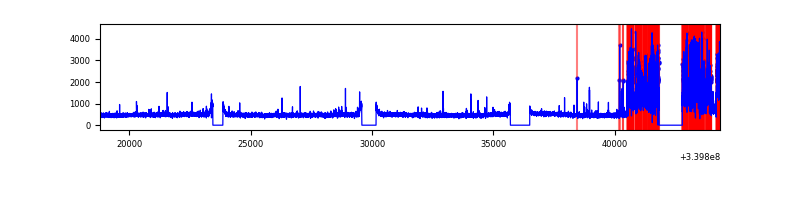 |
| C | 25538 | 22777 | 163 | 163 | 0.64% | 0.72% | 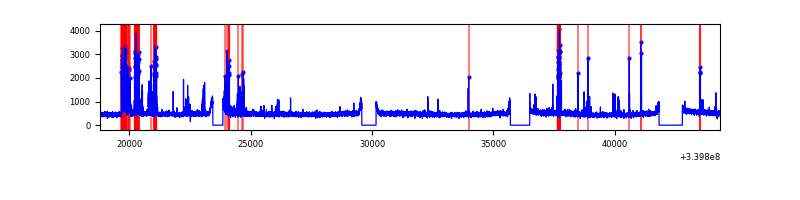 |
| D | 25538 | 22777 | 992 | 992 | 3.88% | 4.36% | 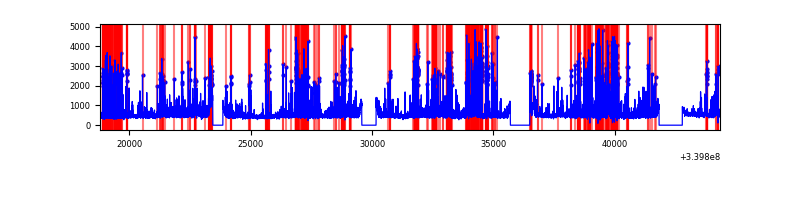 |
Top three noisy pixels from each quadrant. If the there are fewer than three noisy pixels in the level2.evt file, extra rows are filled as -1
| Pixel properties | Quadrant properties | ||||||
|---|---|---|---|---|---|---|---|
| Quadrant | DetID | PixID | Counts | Sigma | Mean | Median | Sigma |
| A | 6 | 16 | 228867 | 402.88 | 2813 | 2760 | 561.2 |
| A | 14 | 235 | 38088 | 62.95 | 2813 | 2760 | 561.2 |
| A | 13 | 254 | 33218 | 54.27 | 2813 | 2760 | 561.2 |
| B | 3 | 64 | 3398101 | 6536.25 | 2713 | 2645 | 519.5 |
| B | 12 | 111 | 65211 | 120.44 | 2713 | 2645 | 519.5 |
| B | 0 | 190 | 64306 | 118.7 | 2713 | 2645 | 519.5 |
| C | 15 | 208 | 1079643 | 1722.81 | 2671 | 2687 | 625.1 |
| C | 14 | 238 | 424415 | 674.64 | 2671 | 2687 | 625.1 |
| C | 2 | 16 | 44648 | 67.13 | 2671 | 2687 | 625.1 |
| D | 1 | 52 | 3595326 | 5217.83 | 2631 | 2585 | 688.6 |
| D | 12 | 0 | 675946 | 977.94 | 2631 | 2585 | 688.6 |
| D | 2 | 250 | 626344 | 905.9 | 2631 | 2585 | 688.6 |
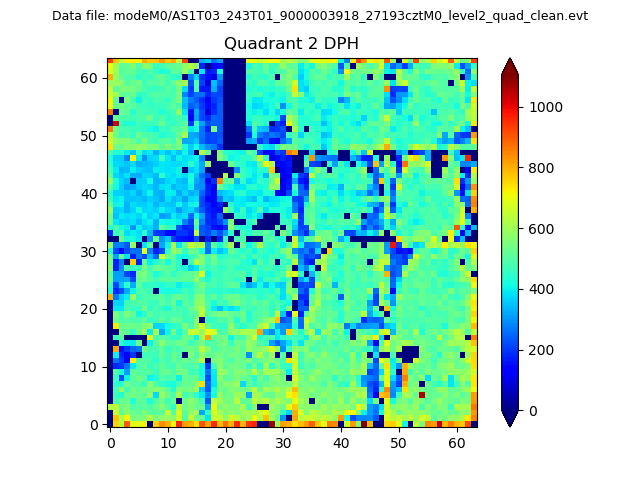
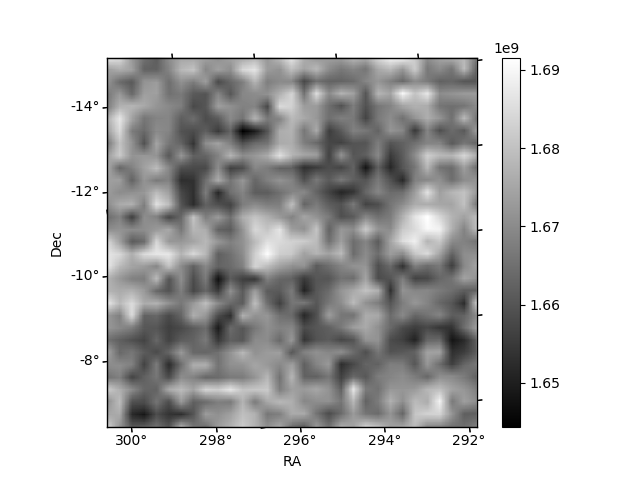
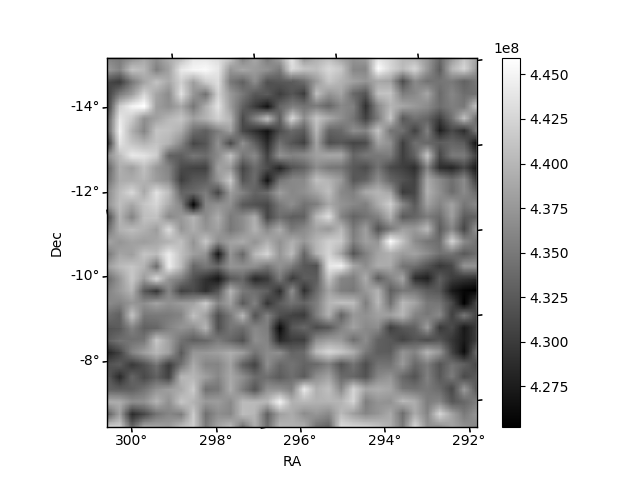
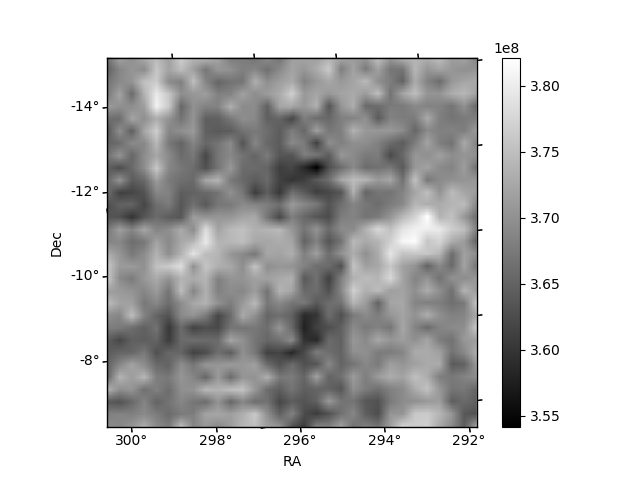
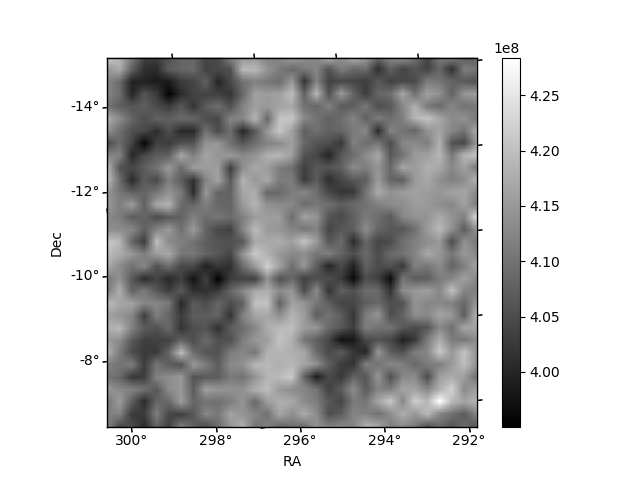
Histogram calculated using DETX and DETY for each event in the final _common_clean file
| Quadrant A | 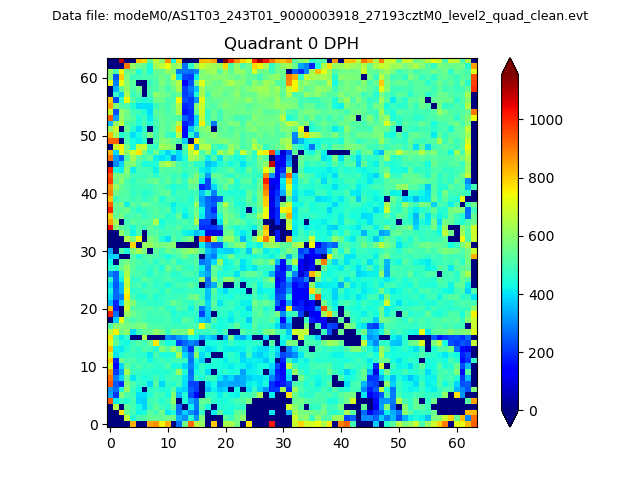 |
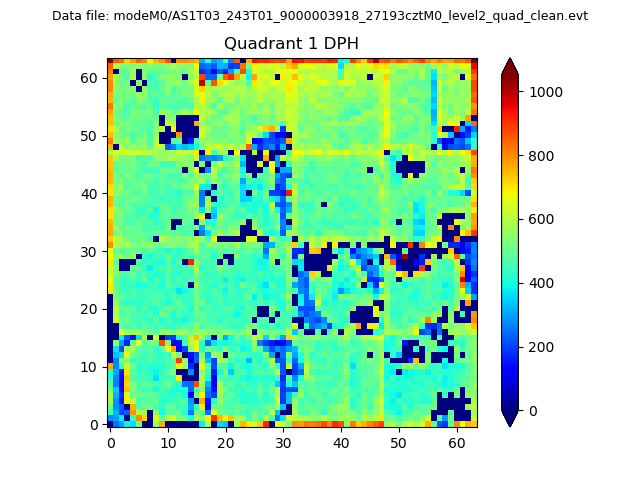 |
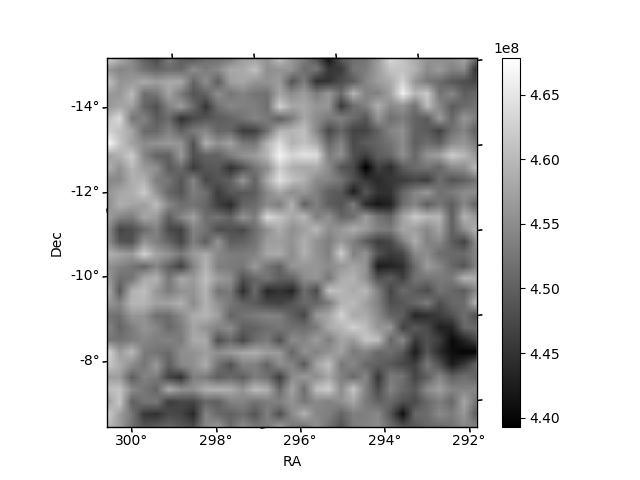
Quadrant B |
|---|---|---|---|
| Quadrant D | 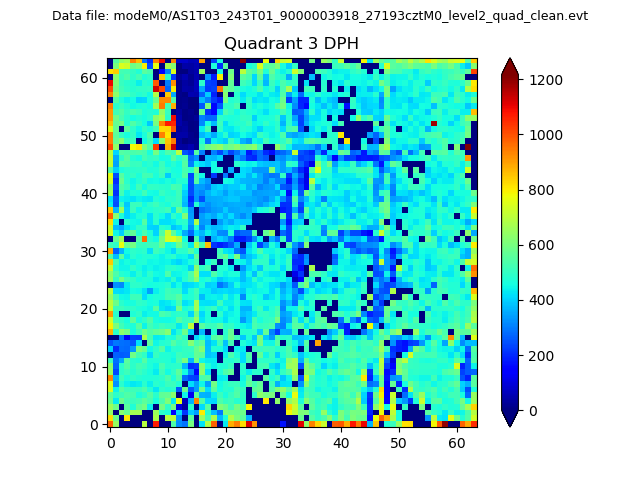 |
 |
Quadrant C |
| Plot type | Count rate plots | Images |
|---|---|---|
| Comparison with Poisson distribution Blue bars denote a histogram of data divided into 1 sec bins. Red curve is a Poisson curve with rate = median count rate of data. |
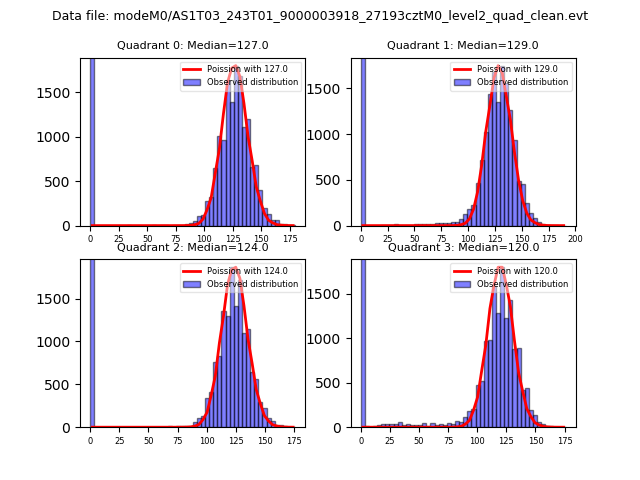 |
 |
| Quadrant-wise count rates Data is divided into 100 sec bins |
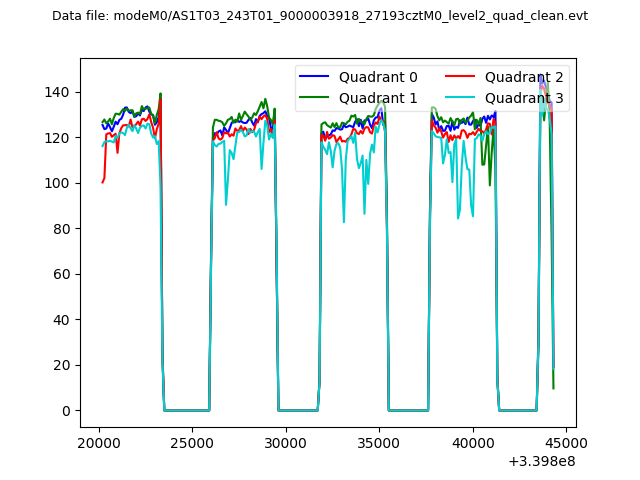 |
|
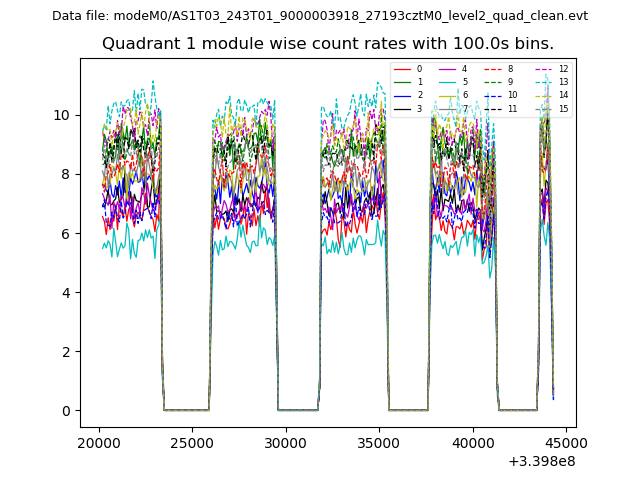
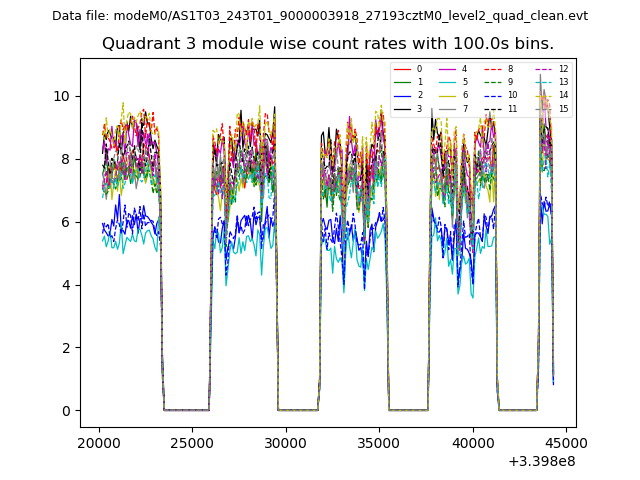
| Module-wise count rates for Quadrant A Data is divided into 100 sec bins |
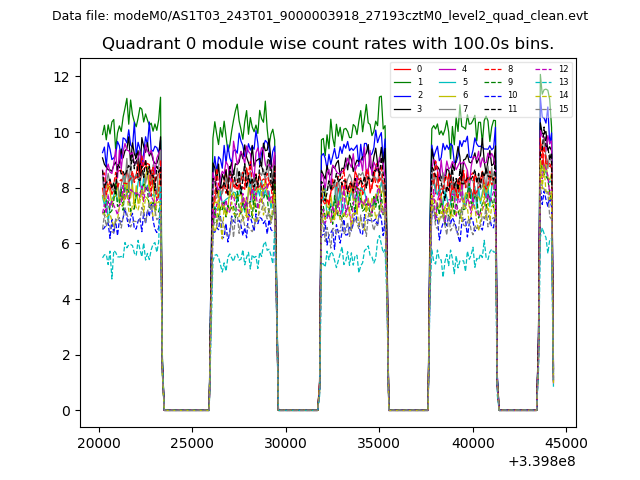 |
 |
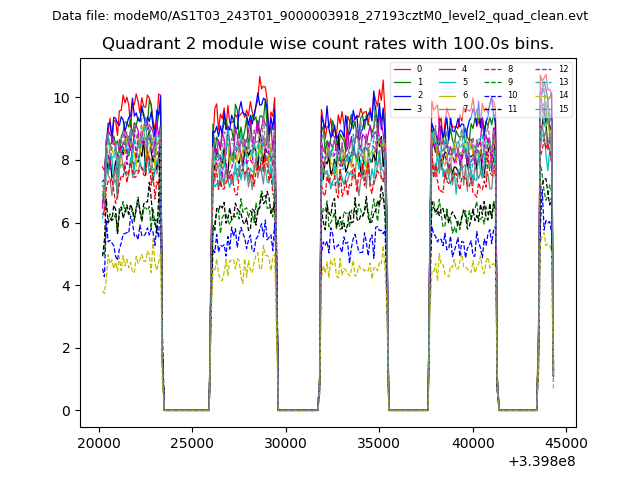
| Module-wise count rates for Quadrant B Data is divided into 100 sec bins |
 |
 |
| Module-wise count rates for Quadrant C Data is divided into 100 sec bins |
 |
 |
| Module-wise count rates for Quadrant D Data is divided into 100 sec bins |
 |
 |
| Parameter | Plot |
|---|---|
| CZT HV Monitor | 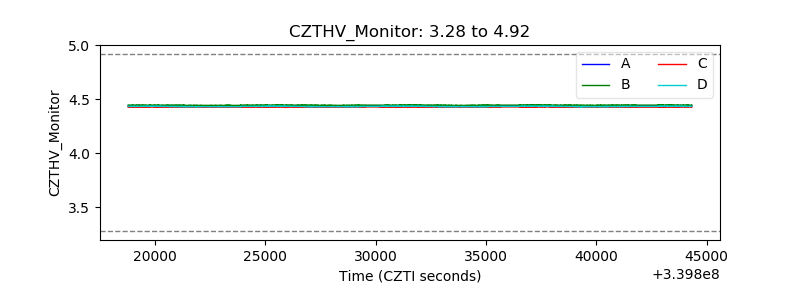 |
| D_VDD | 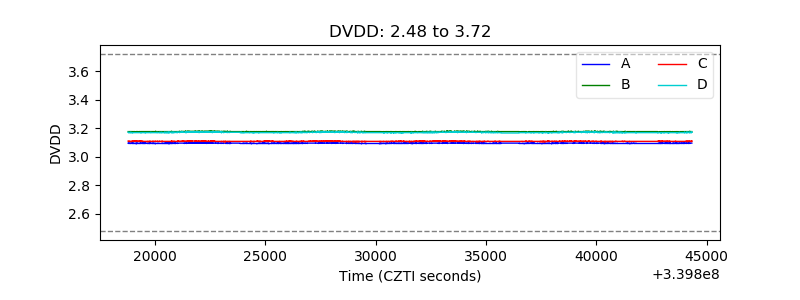 |
| Temperature 1 | 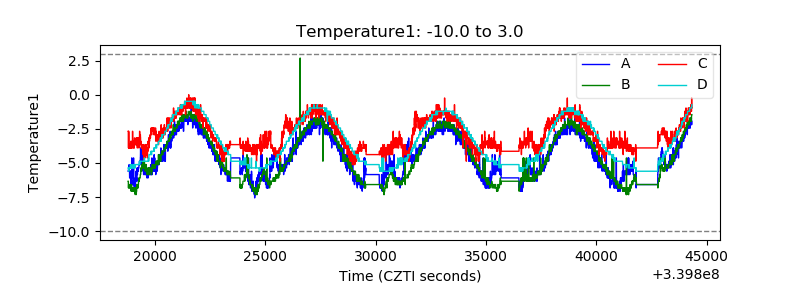 |
| Veto HV Monitor | 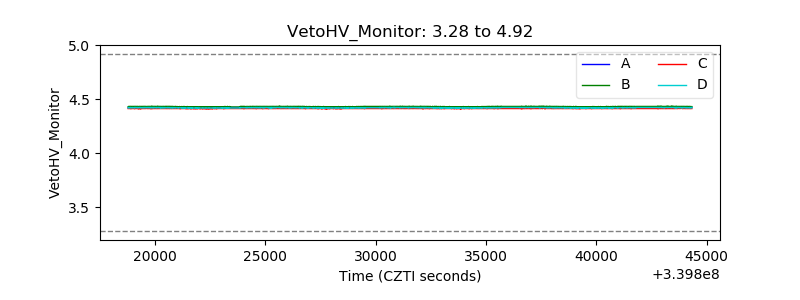 |
| Veto LLD | 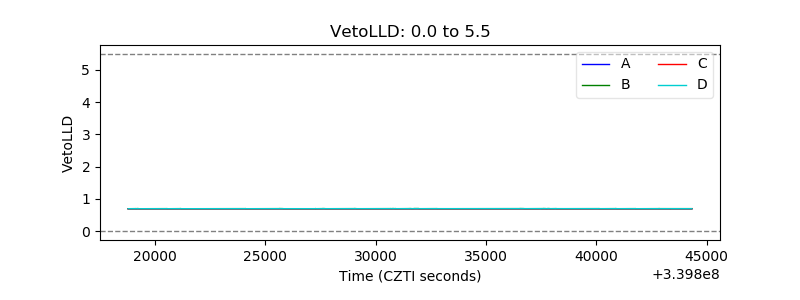 |
| Alpha Counter | 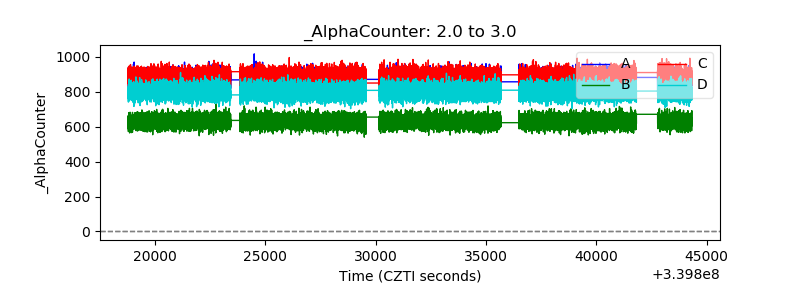 |
| _CPM_Rate | 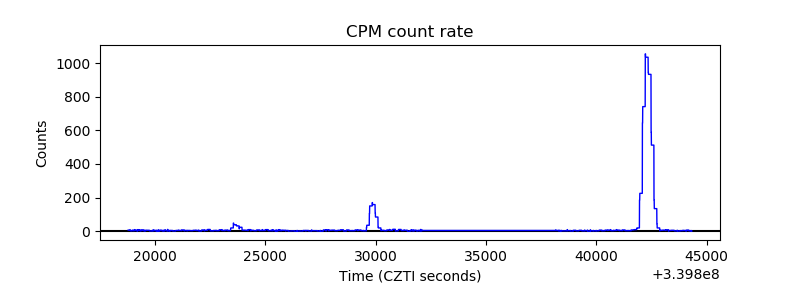 |
| CZT Counter | 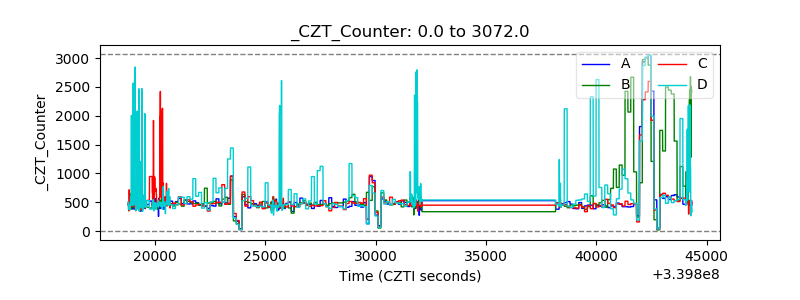 |
| +2.5 Volts monitor |  |
| +5 Volts monitor | 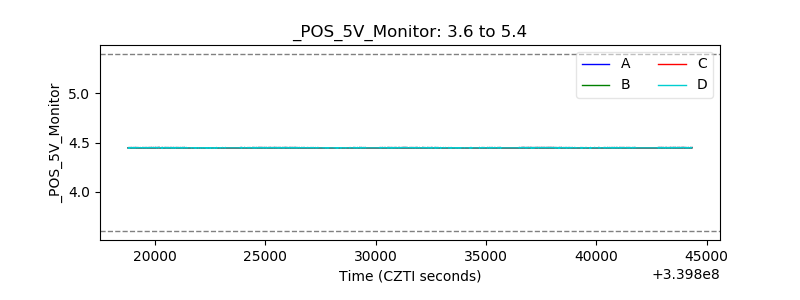 |
| _ROLL_ROT | 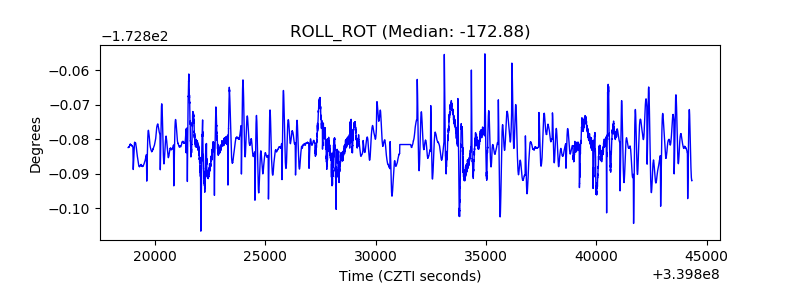 |
| _Roll_DEC | 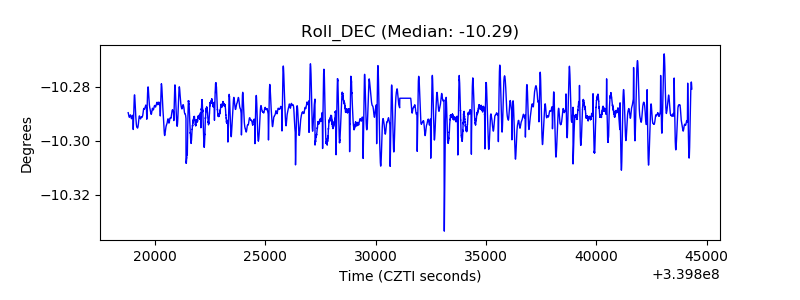 |
| _Roll_RA | 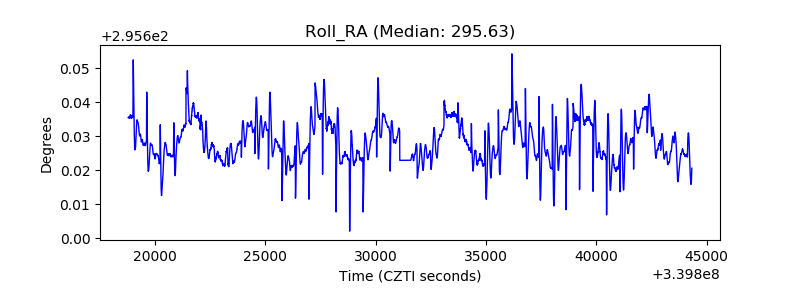 |
| Veto Counter | 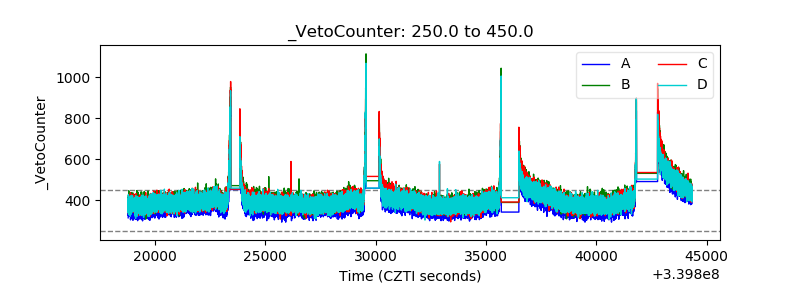 |